INFOGRAPHICS: March 2018 Greater Vancouver Market Reports

Here’s the latest on how the market is doing within the Real Estate Board of Greater Vancouver (REBGV)! These infographics cover current trends in North Vancouver, West Vancouver, Vancouver East, and Vancouver West.
It has been surmised that newer rules on taxes and mortgages might possibly be affecting buyer and seller activity.
From REBGV’s latest press release:
“We saw less demand from buyers and fewer homes listed for sale in our region in the first quarter of the year,” Phil Moore, REBGV president said. “High prices, new tax announcements, rising interest rates, and stricter mortgage requirements are among the factors affecting home buyer and seller activity today.”
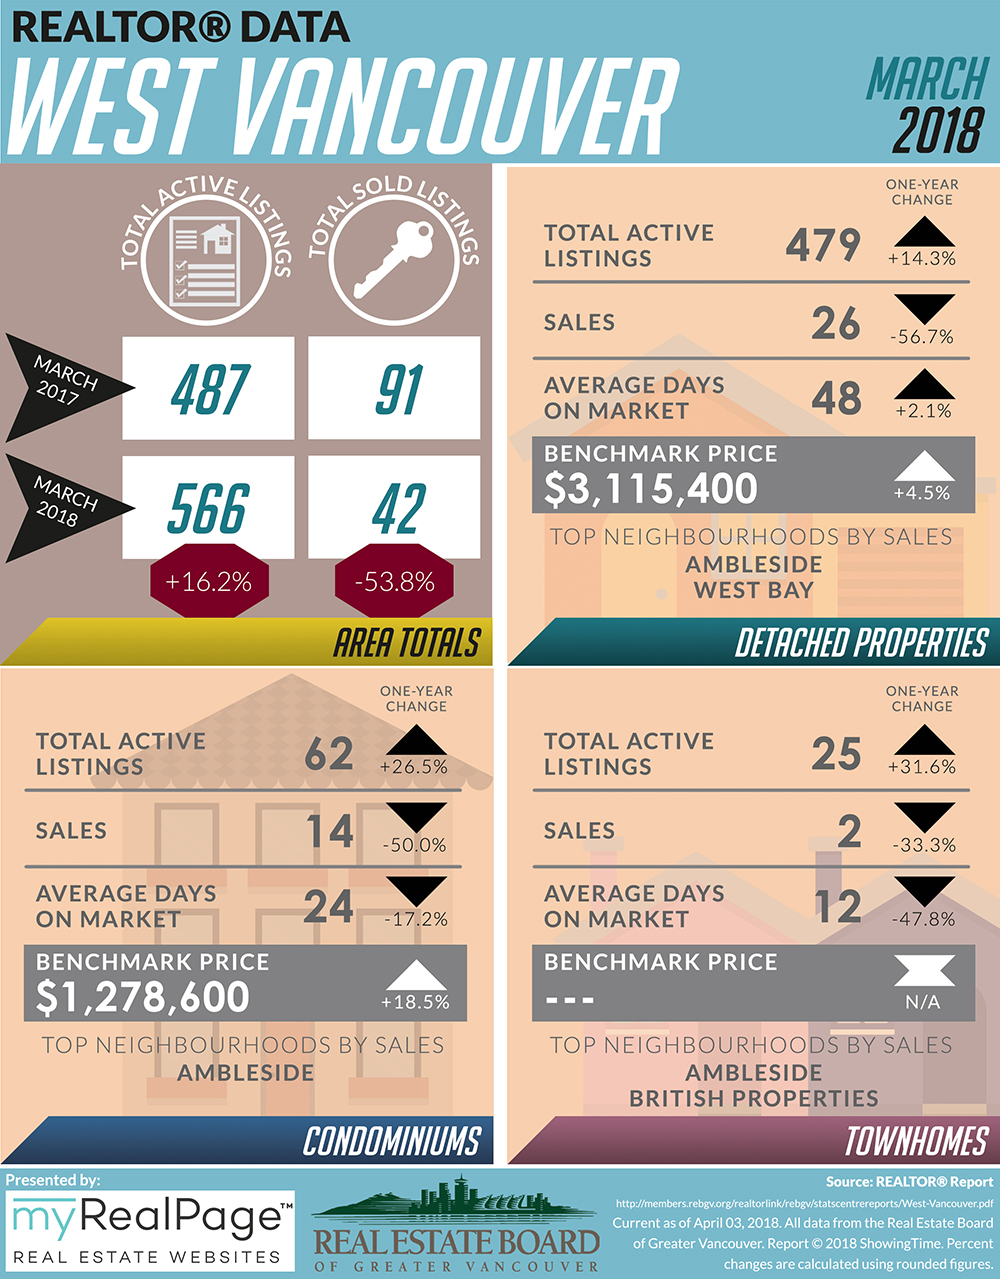
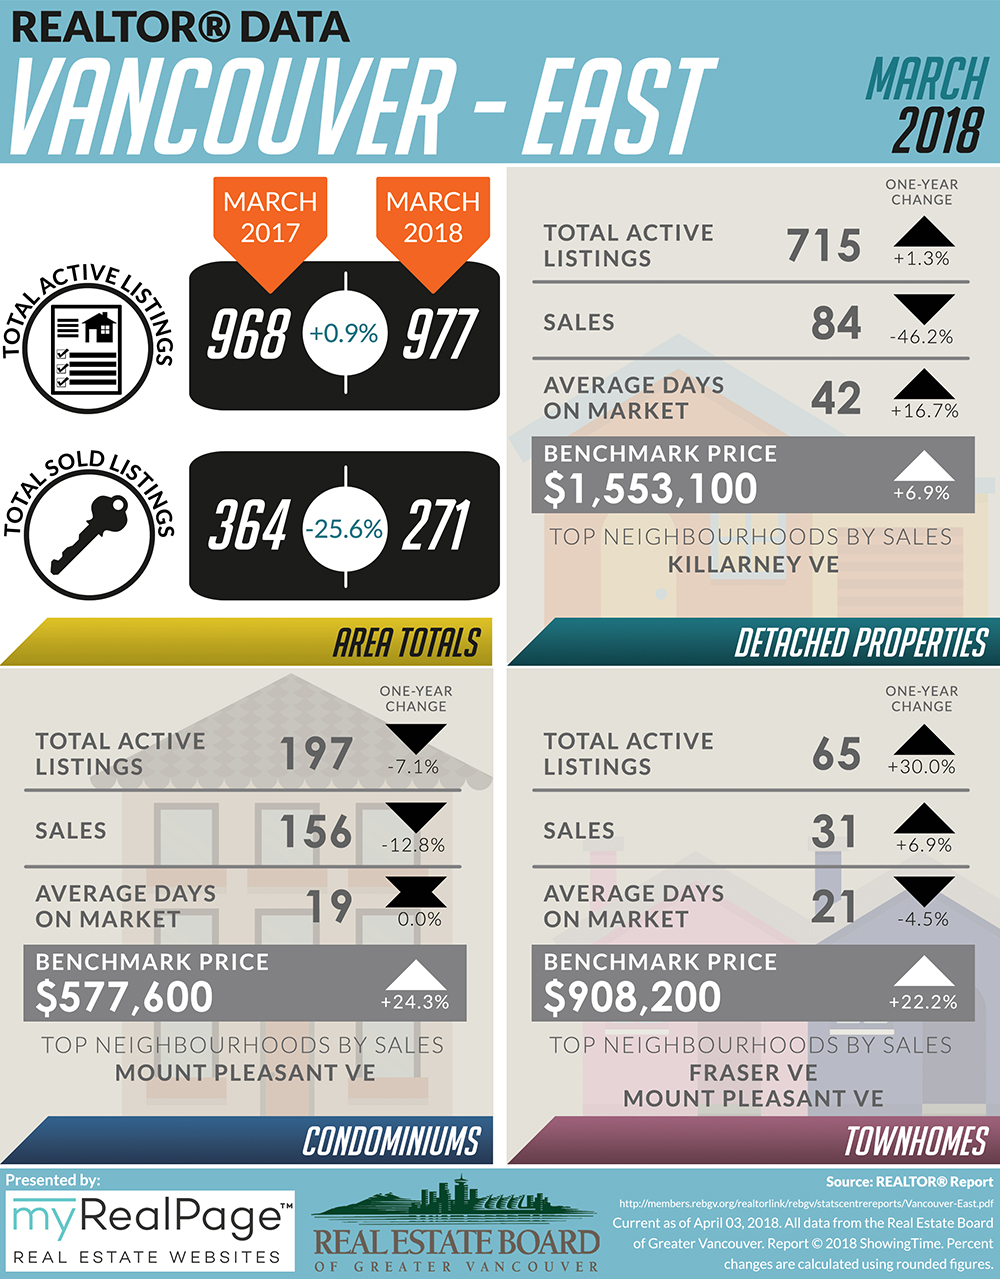
The following data is a comparison between March 2017 and March 2018 numbers, and is current as of April 2018. For last month’s update, you can check out our previous post. Or follow this link for all our REBGV Infographics!
Click on the images for a larger view!
(Protip: Make sure to grab the printable PDF versions, too! It fits best when printed on A4-sized sheets, AND we’ve added an area on the sheet where you can attach your business card! 🙂 )
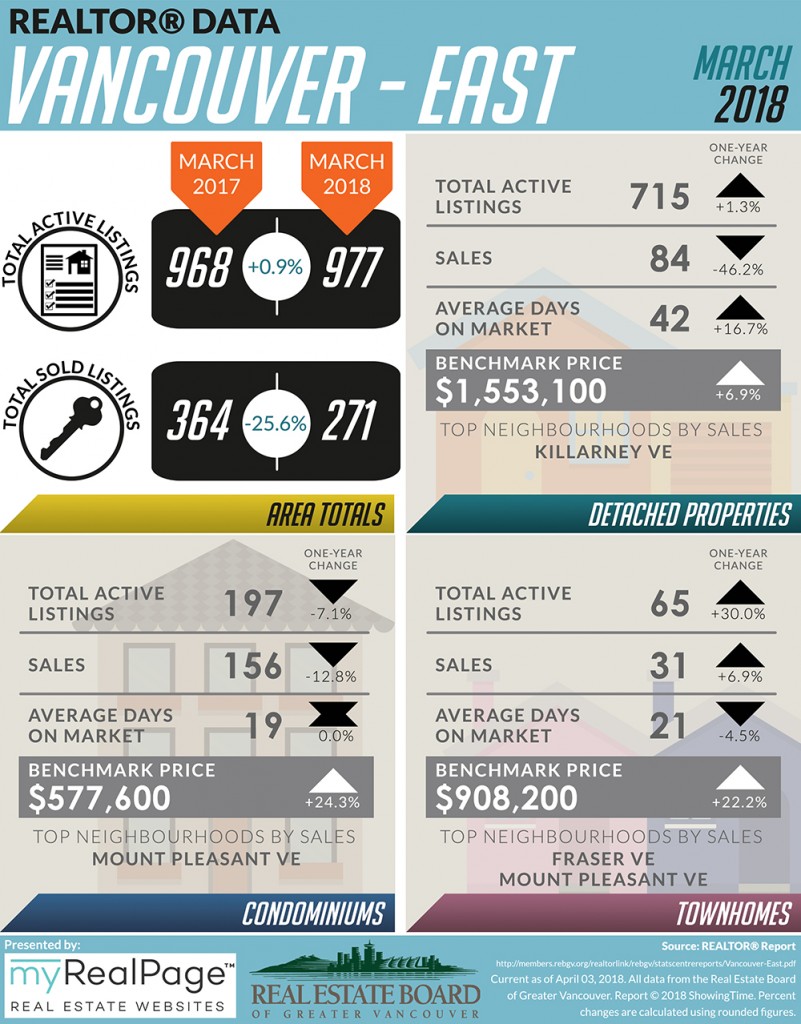 Download Printable Version – Vancouver East
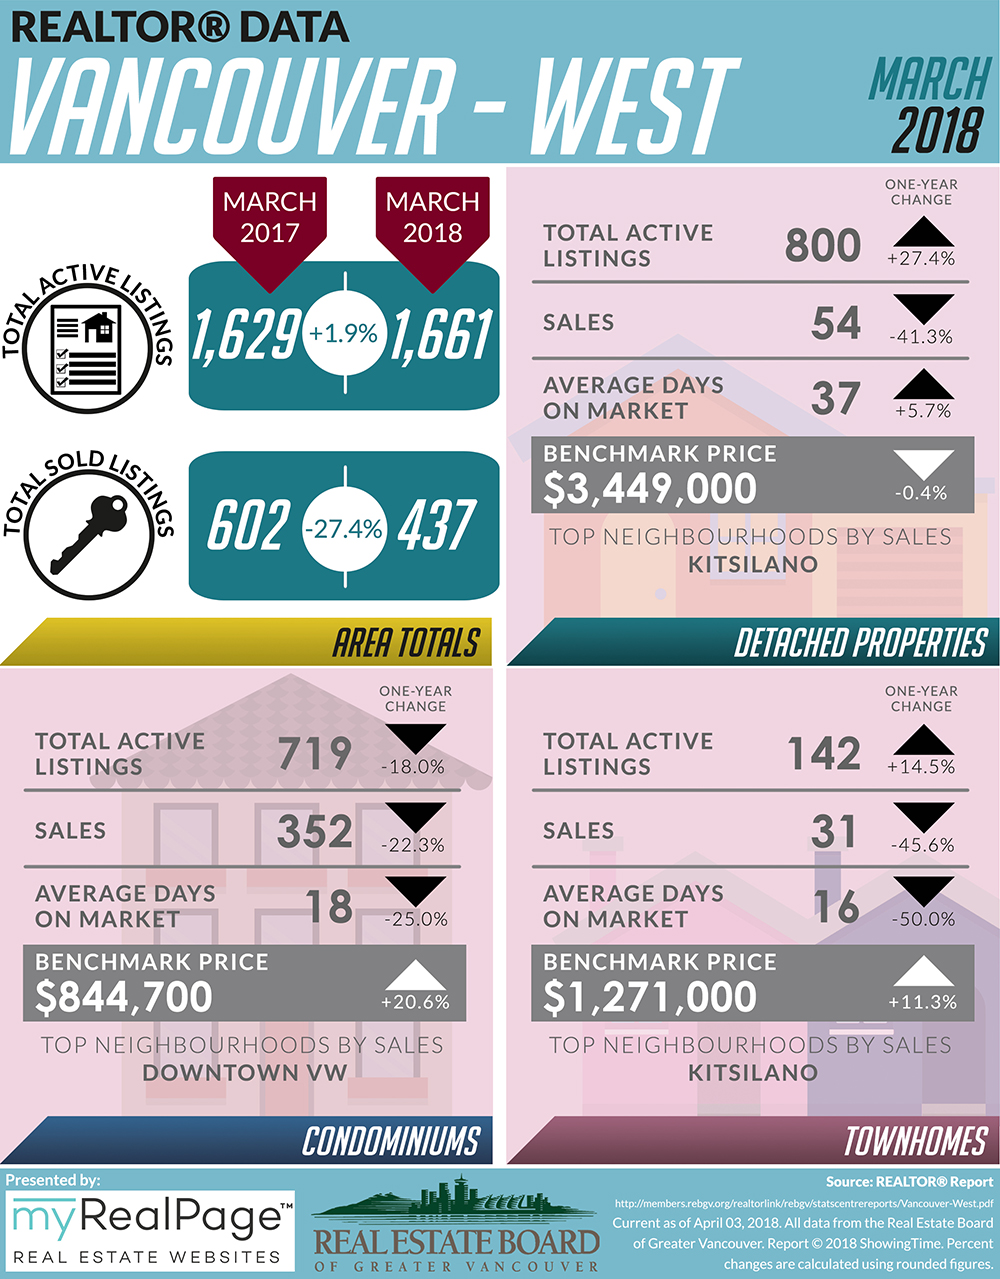
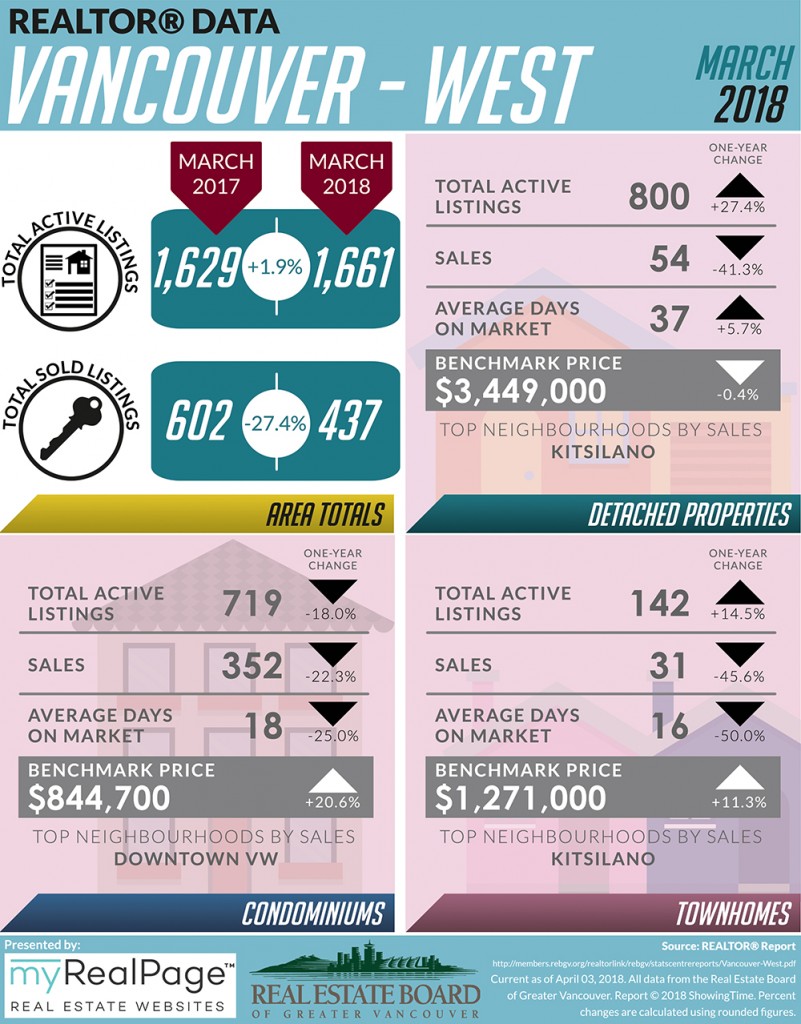 Download Printable Version – Vancouver West
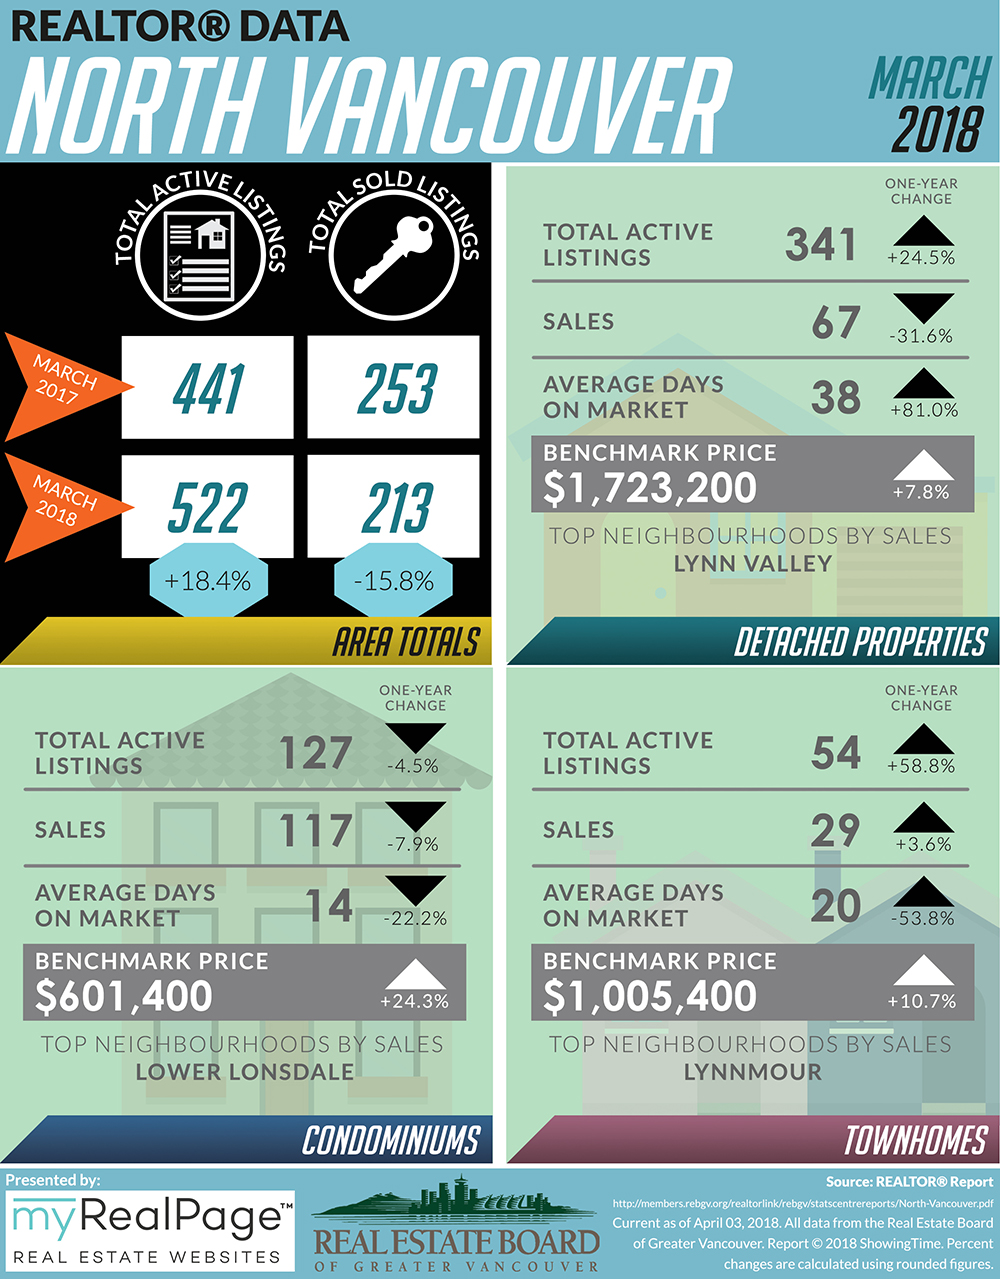
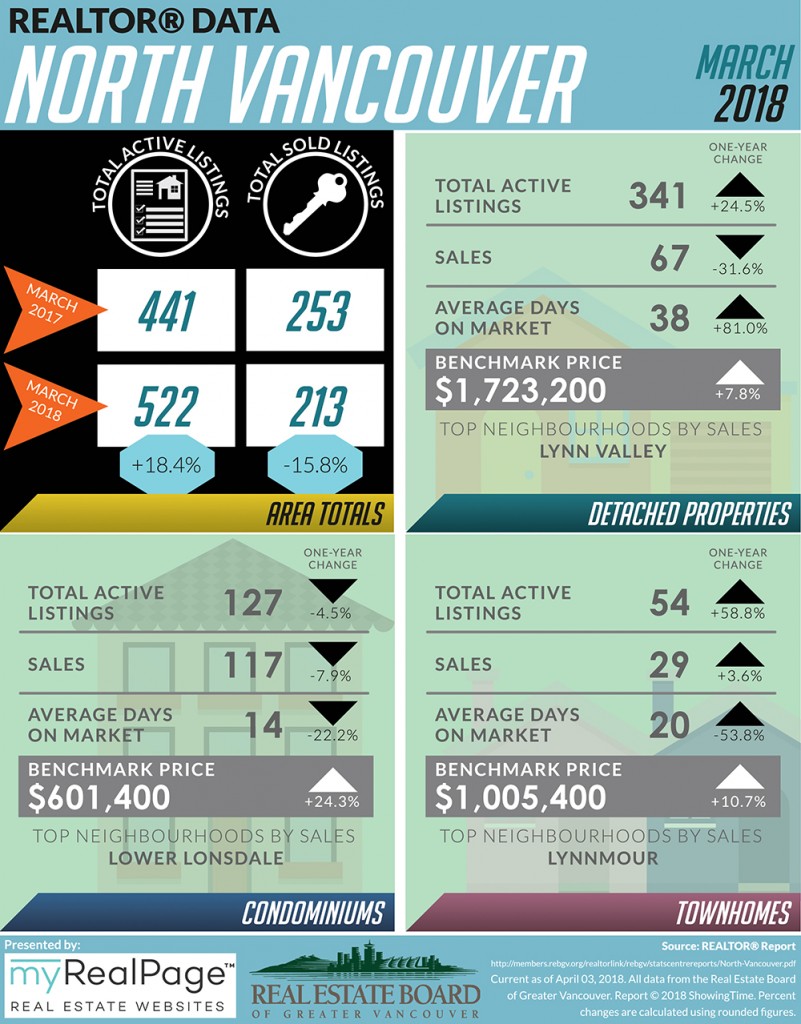 Download Printable Version – North Vancouver
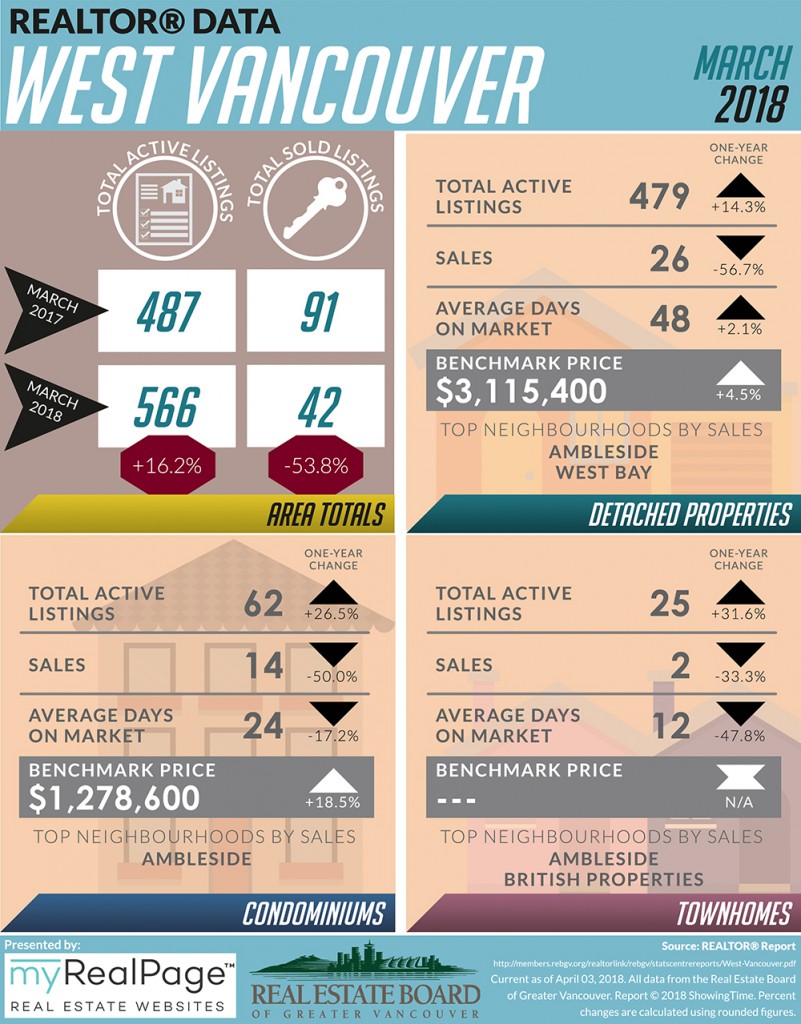 Download Printable Version – West Vancouver