INFOGRAPHICS: August 2019 CREB City And Region Market Reports

And in the blink of an eye, we’re barelling straight into Fall! Closing out the summer months, here are the latest housing market updates for areas covered by the Calgary Real Estate Board (CREB)!
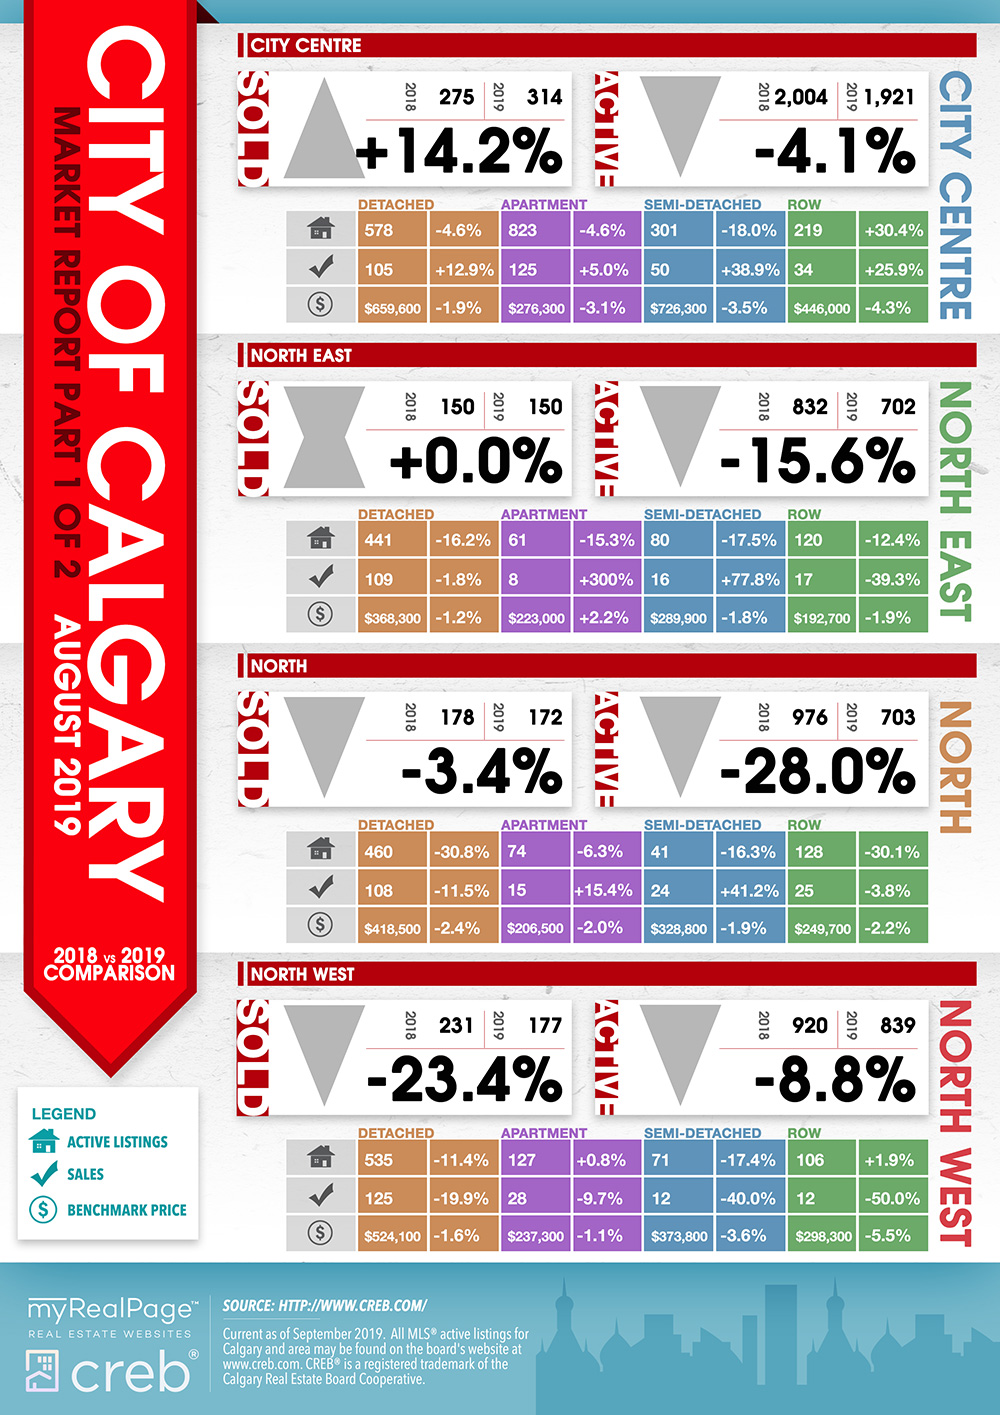
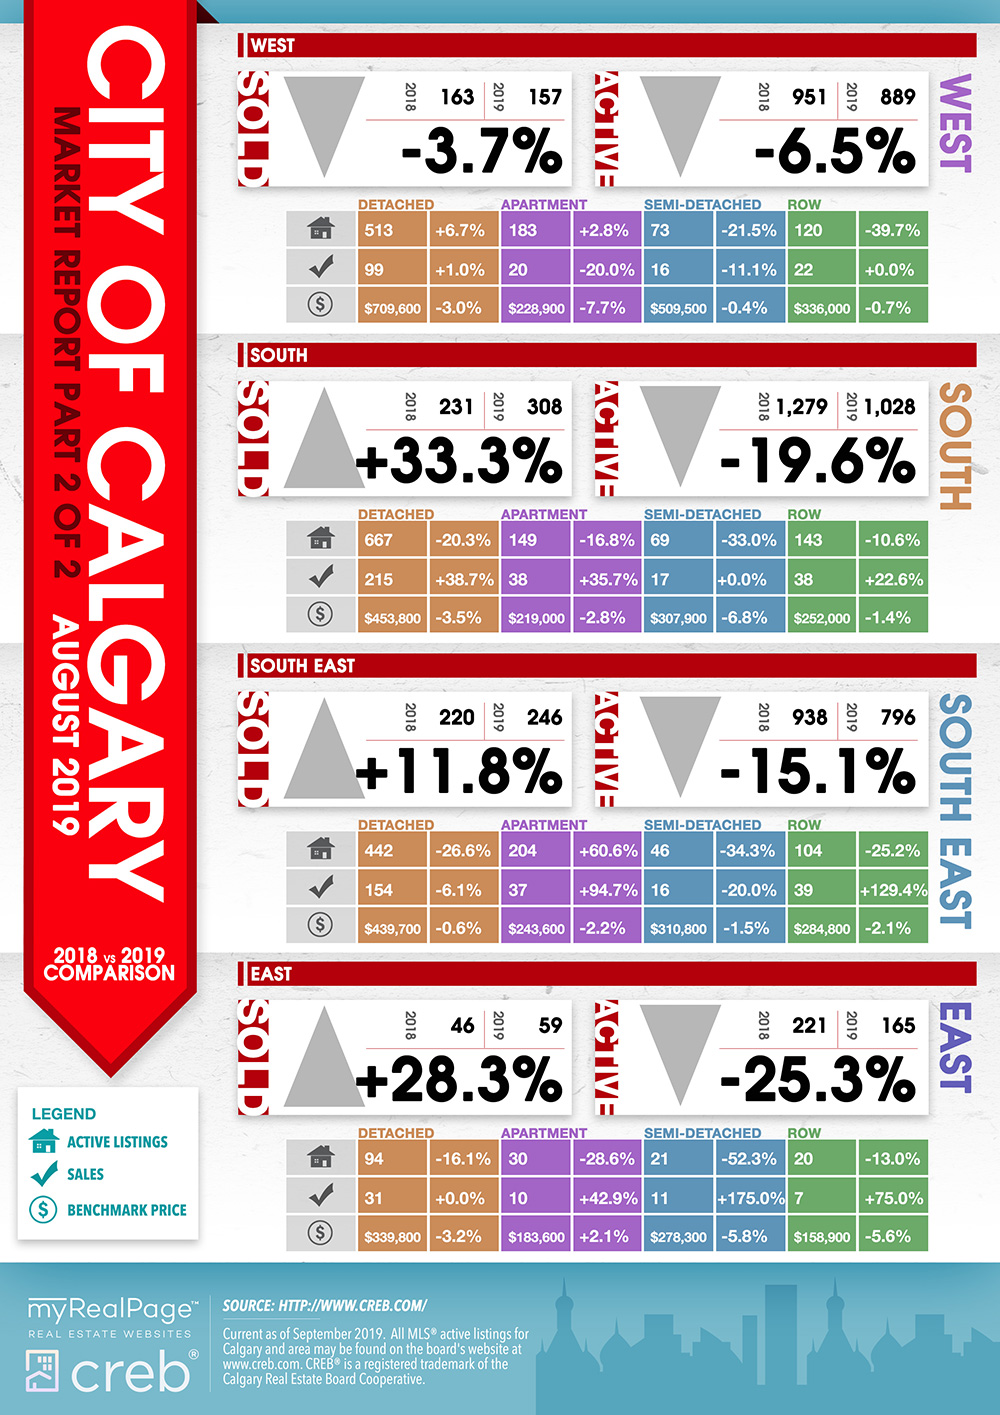
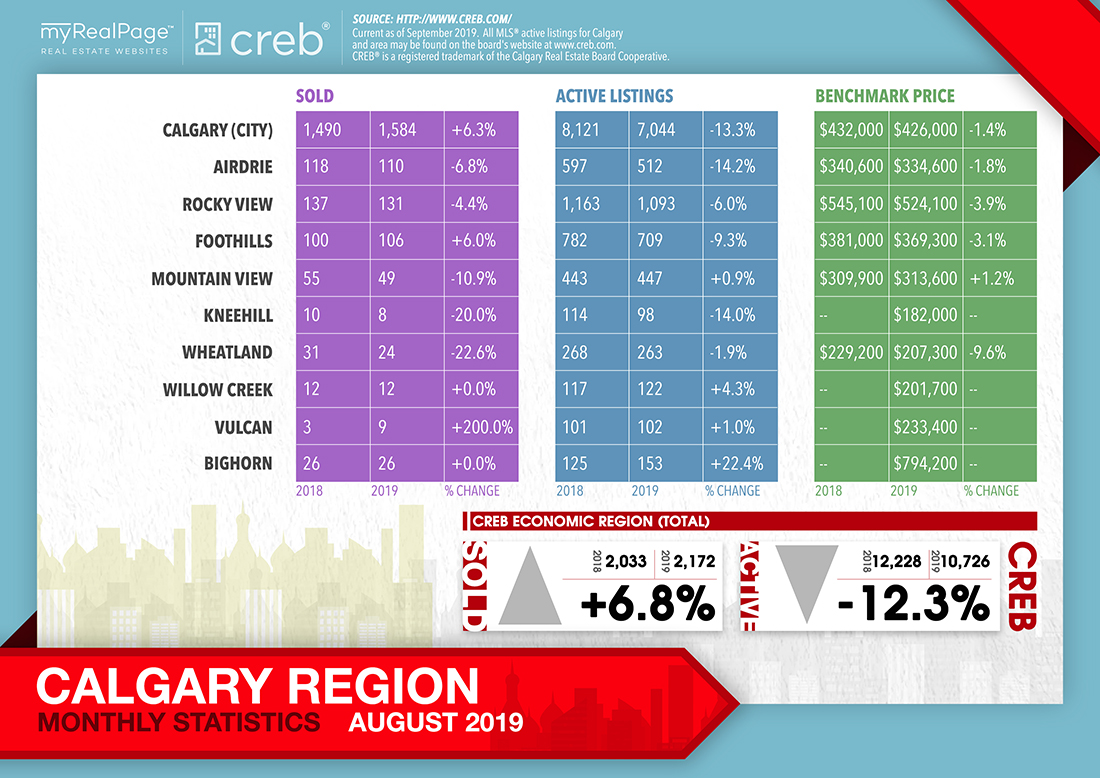
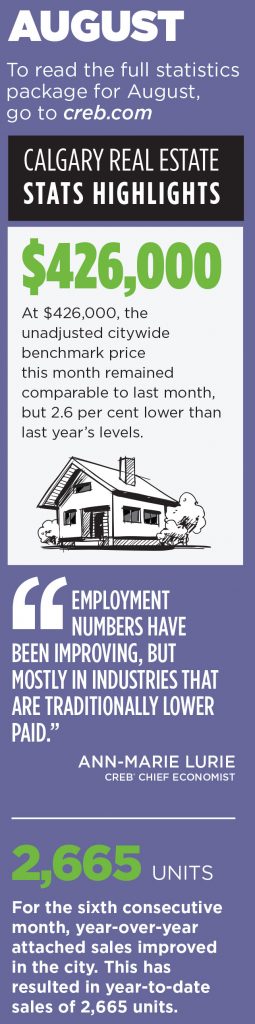
According to their latest release, CREB has seen an increase in sales activity, mostly led by homes priced below $500,000.
These rising numbers offset sales declines in the higher price ranges. This caused August sales to improve by 6% compared to last year. Sales activity improved for all product types. The growth was largest for apartment-style and attached properties.
New listings continued to ease this month, which caused inventory to decline. This is helping the market shift toward more balanced conditions.
Despite improving sales and reductions in inventory, housing market recovery will take time. Inventory levels remain elevated and sales activity is still well below historical norms. The market continues to favour the buyer, with over four months of supply.
The following data is a comparison between August 2018 and August 2019 numbers, and is current as of September 2019. For last month’s numbers, check out our previous infographic.
Or follow this link for all our CREB Infographics!
Click on the images for a larger view!
(Protip: Make sure to grab the printable PDF versions, too! It fits best when printed on A4-sized sheets, AND we’ve added an area on the sheet where you can attach your business card! 🙂 )
Download Printable Version – August 2019 CREB, City of Calgary Report
Download Printable Version – August 2019 CREB, Calgary Region Report
(Image from CREBNow.com)
Last Updated on July 25, 2022 by myRealPage
