INFOGRAPHICS: July 2022 FVREB Fraser Valley, South Surrey, Etc. Market Reports

Sales slide for fourth straight month as rising interest rates put brakes on Fraser Valley real estate market
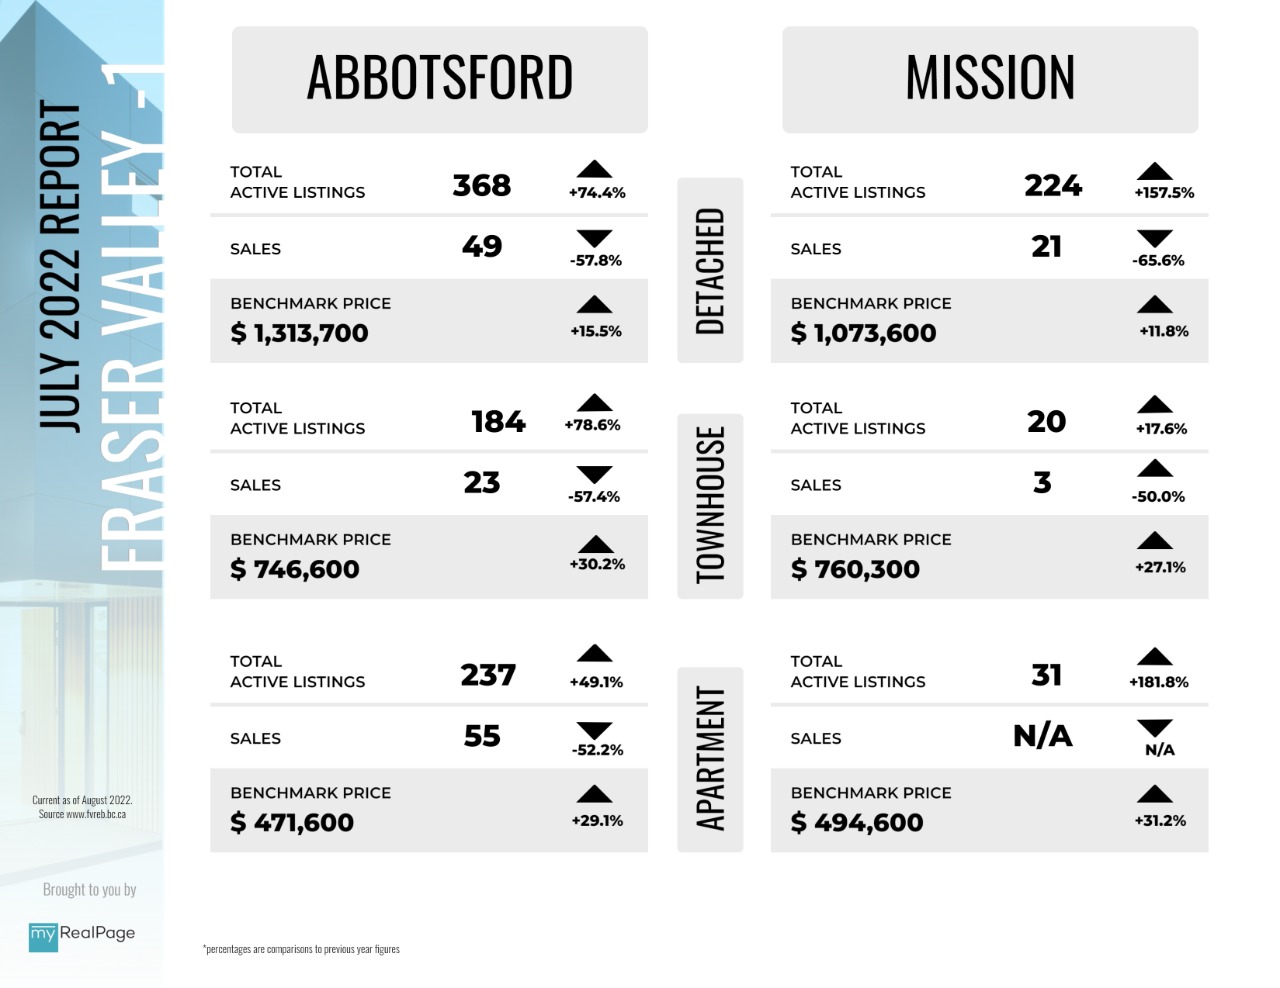
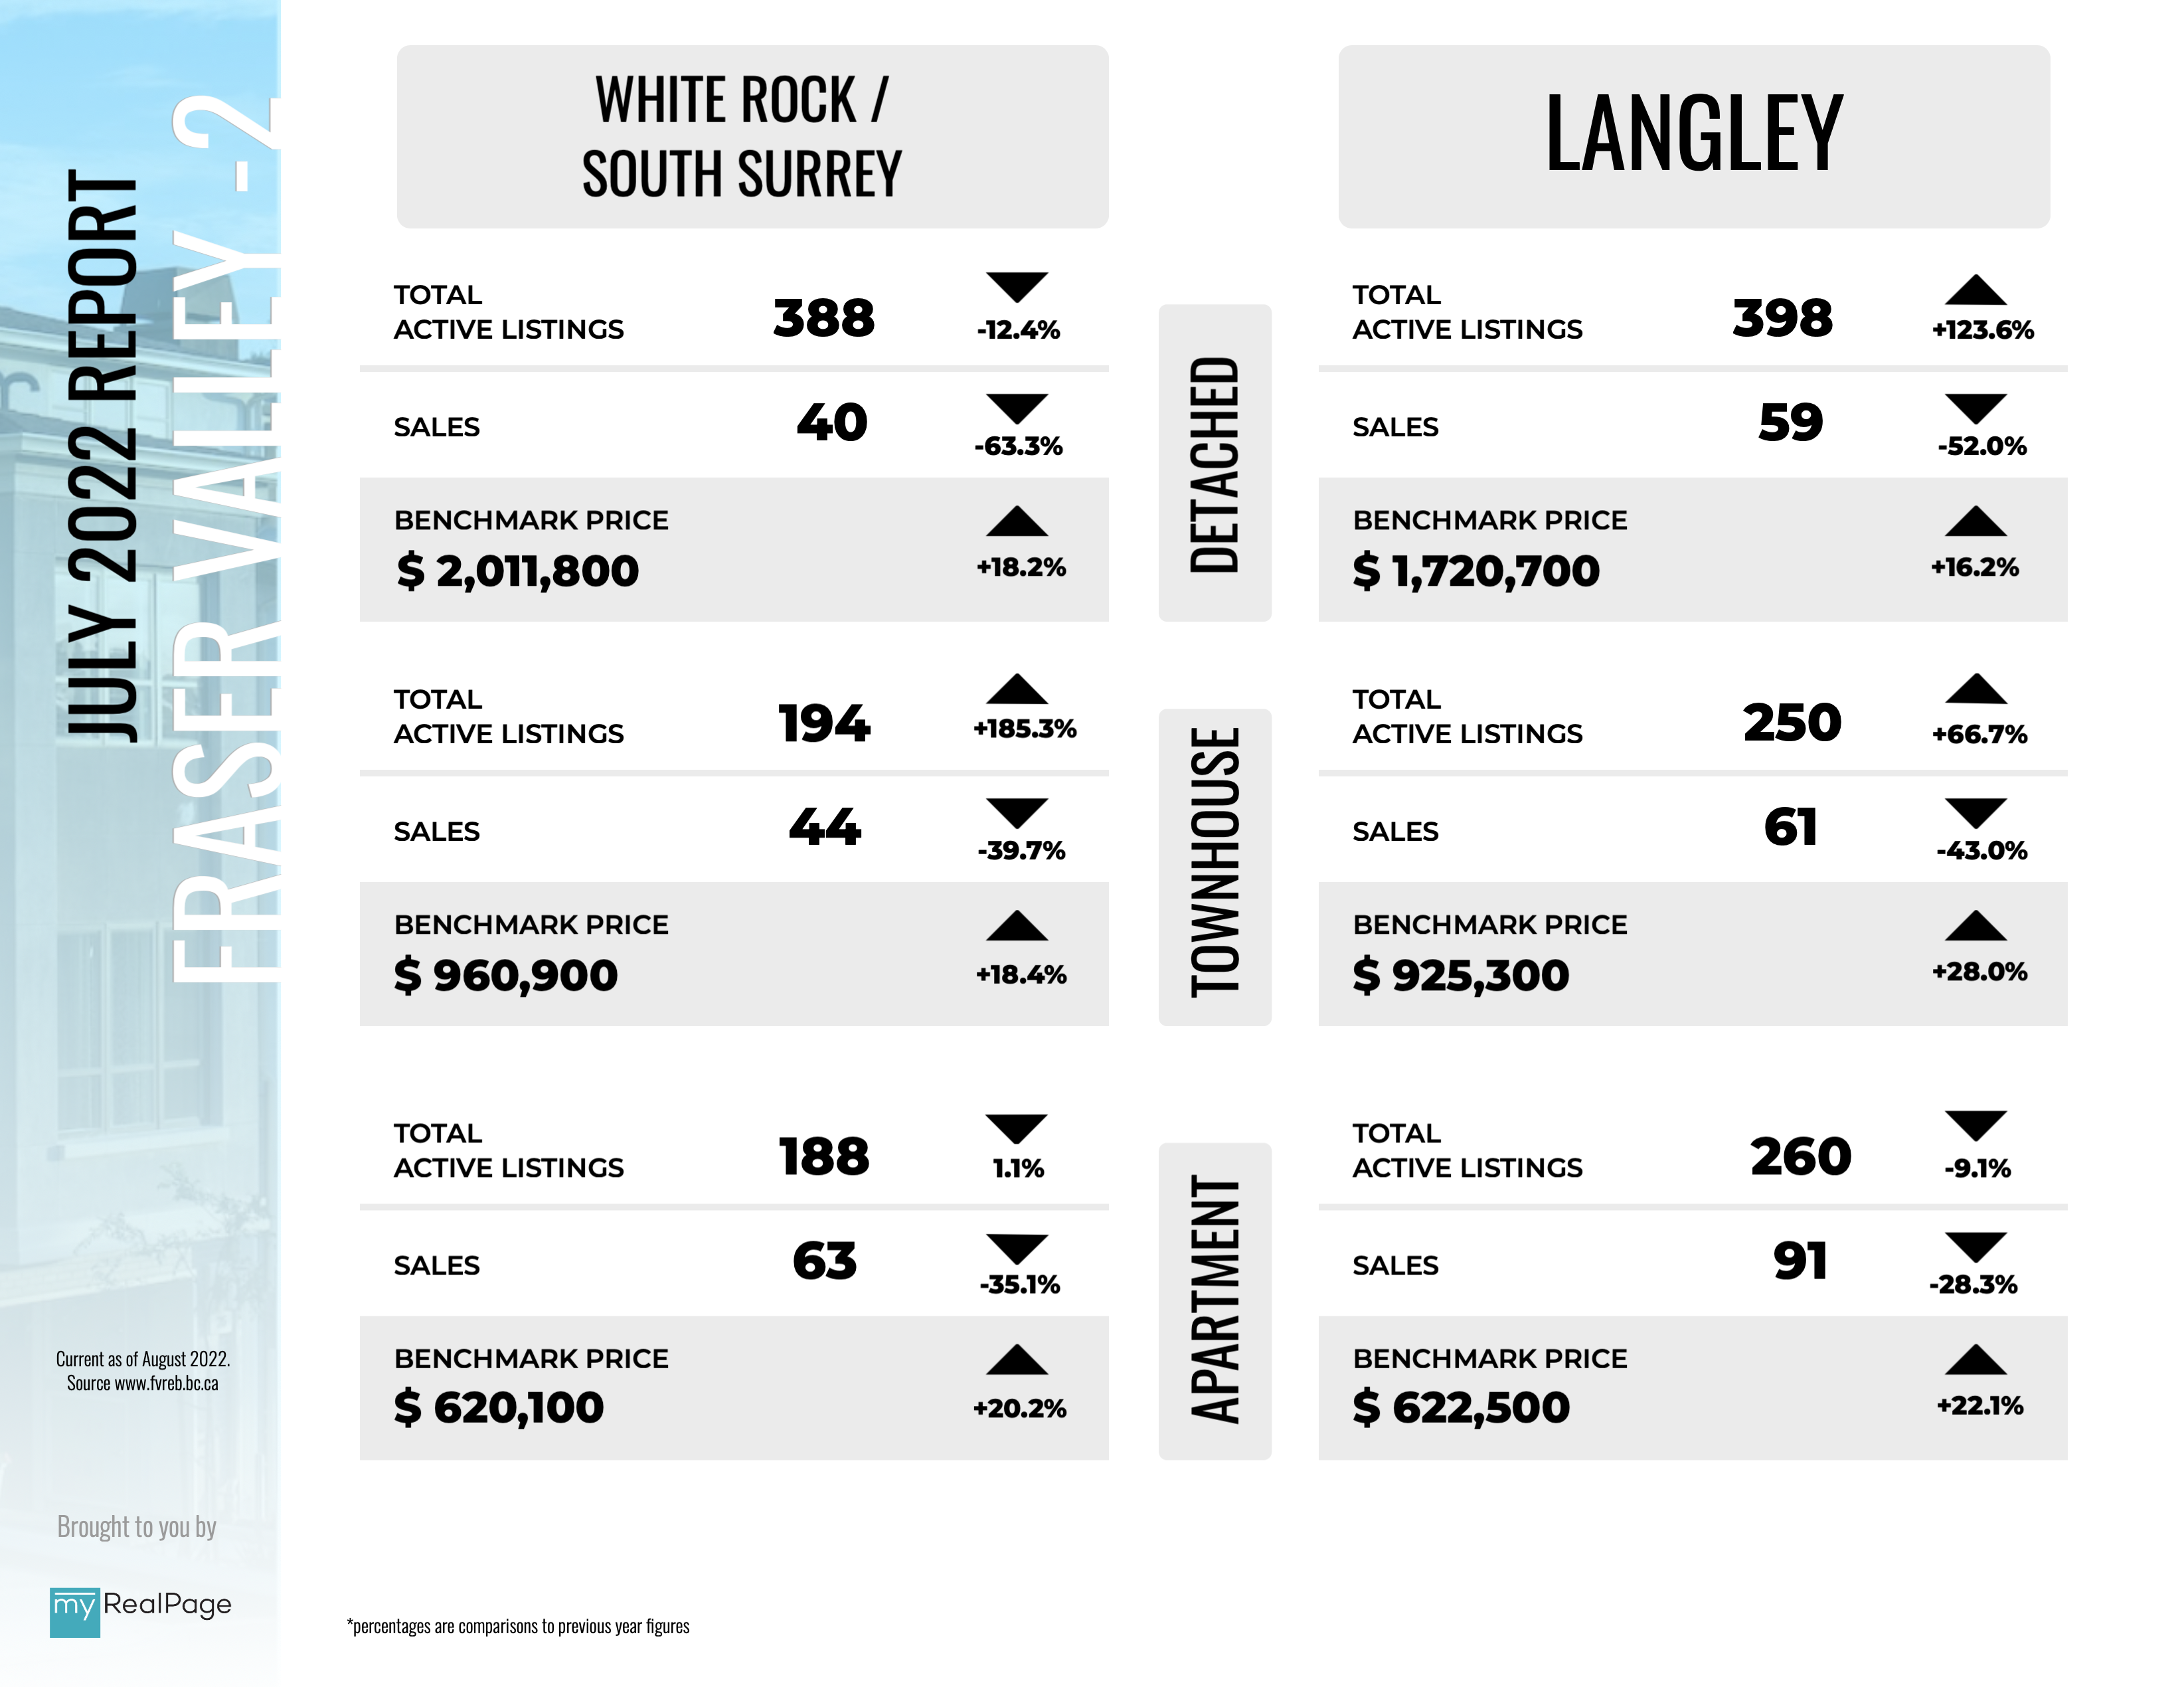
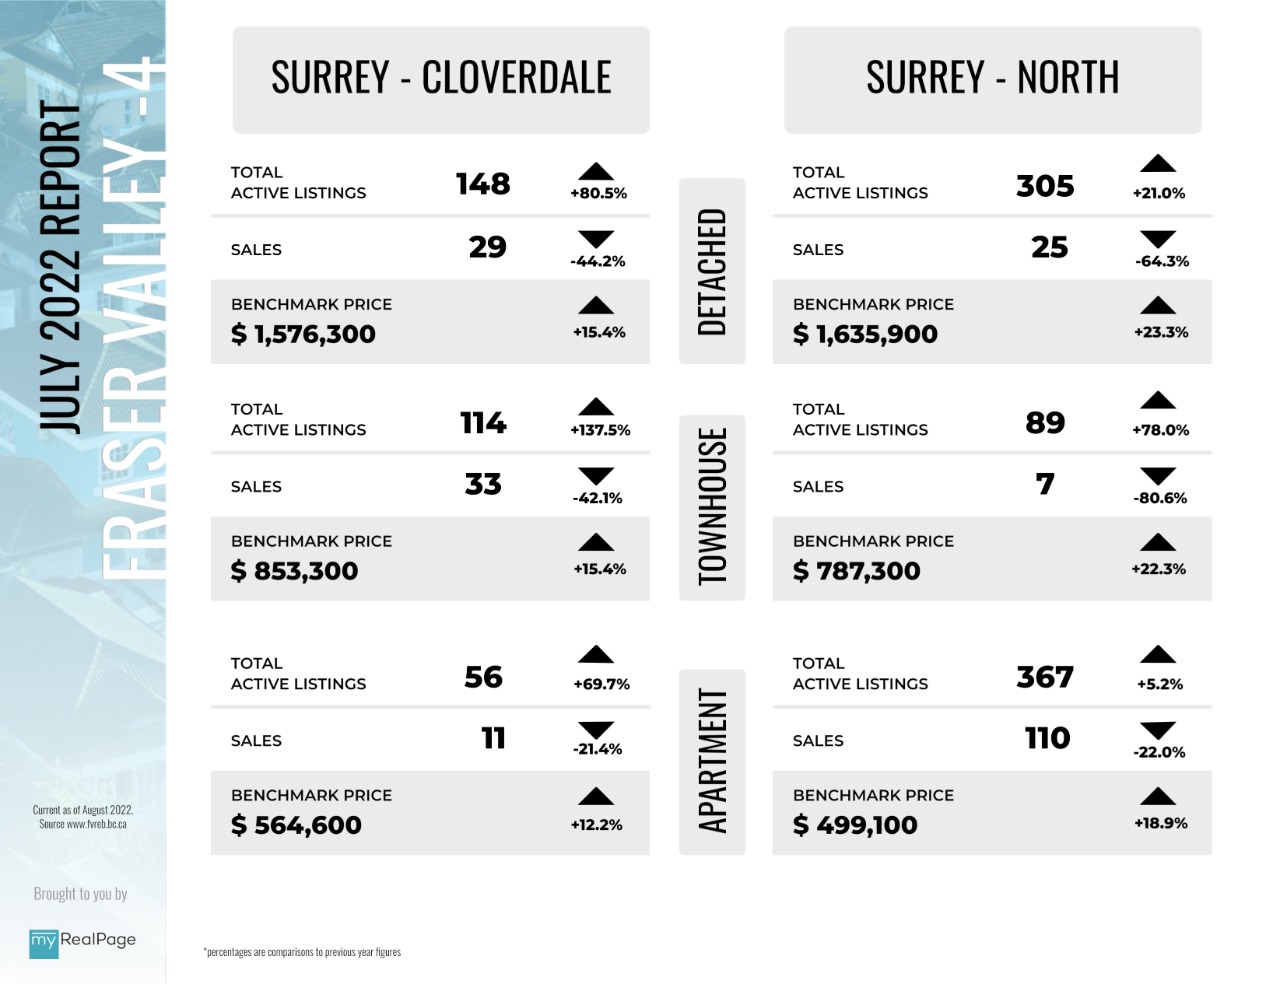
The Fraser Valley real estate market saw sales fall again in July in the face of continued interest rate hikes, as the government struggles to bring inflation under control.
In July, the Fraser Valley Real Estate Board (FVREB) processed 993 sales on its Multiple Listing Service® (MLS®), a decrease of 22.5 per cent from the previous month and a 50.5 per cent drop compared to July 2021, when the province was still in acute pandemic mode. July new listings totaled 2,385, a 28.4 per cent decrease compared to June and a decrease of 1.9 per cent compared to July 2021.
Active listings, at 6,413, remained relatively unchanged from June and were up 30.9 per cent over last July – bringing the sector into balance for townhomes and detached homes (sales-to-active ratios: 18 per cent and 12 per cent, respectively); and favouring sellers slightly for apartments (28 per cent). The market is considered balanced when the sales-to-active ratio is between 12 per cent and 20 per cent.
Read the full report on the FVREB website!
The following data is a comparison between July 2022 and July 2021 numbers, and is current as of August 2022. For last month’s report, check out our previous infographic!
Or follow this link for all our FVREB Infographics!
These infographics cover current trends in Fraser Valley neighbourhoods that are within the FVREB. Click on the images for a larger view!
Download Printable Version – FVREB July 2022 Market Report 1
Download Printable Version – FVREB July 2022 Market Report 2
Download Printable Version – FVREB July 2022 Market Report 3
Download Printable Version – FVREB July 2022 Market Report 4

Last Updated on August 8, 2022 by myRealPage
