INFOGRAPHICS: June 2022 CREB City And Region Market Reports

Market starts to shift as sales slow
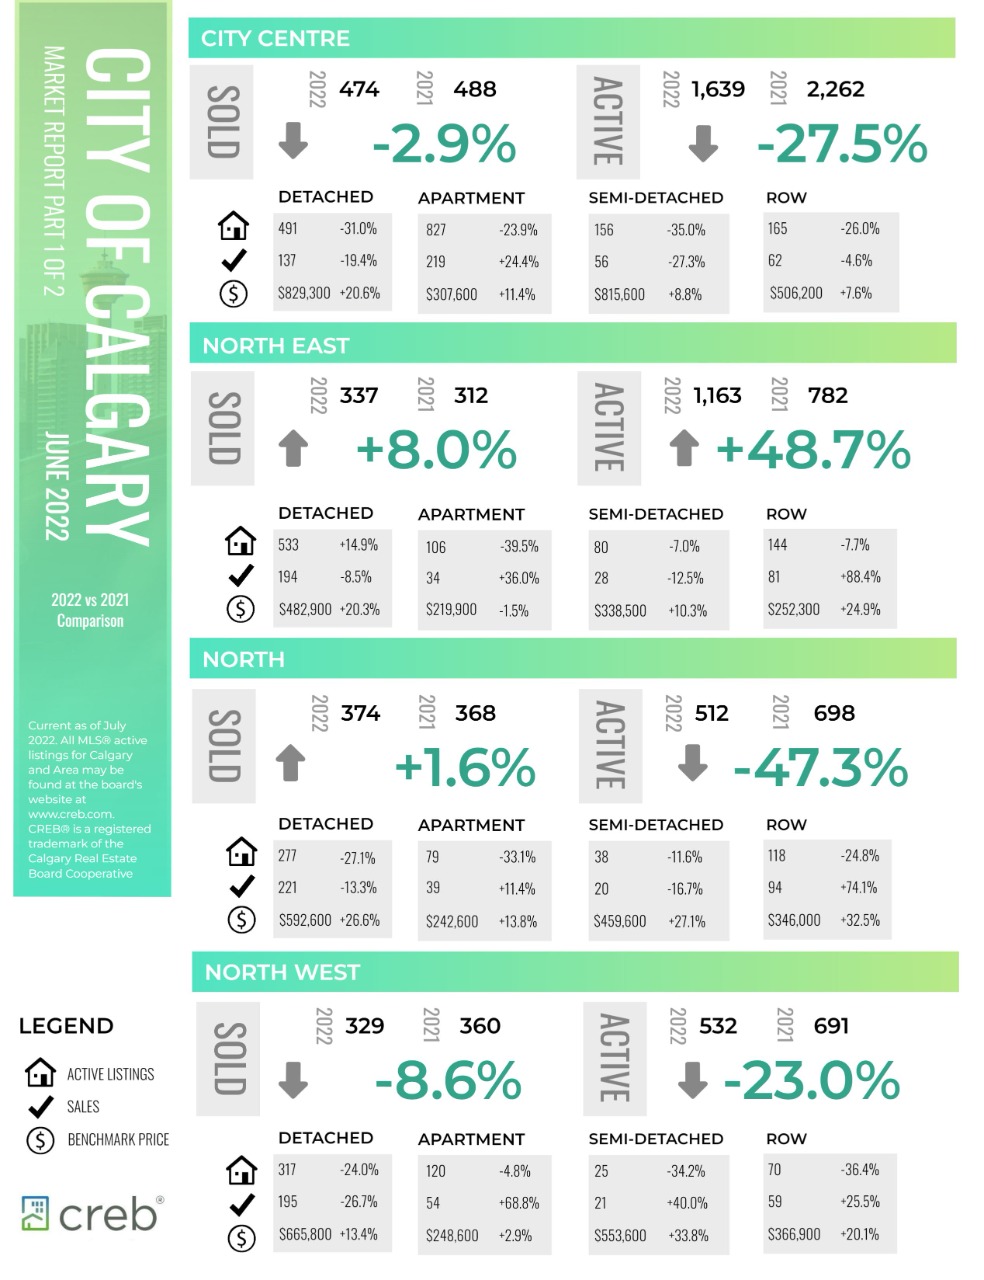
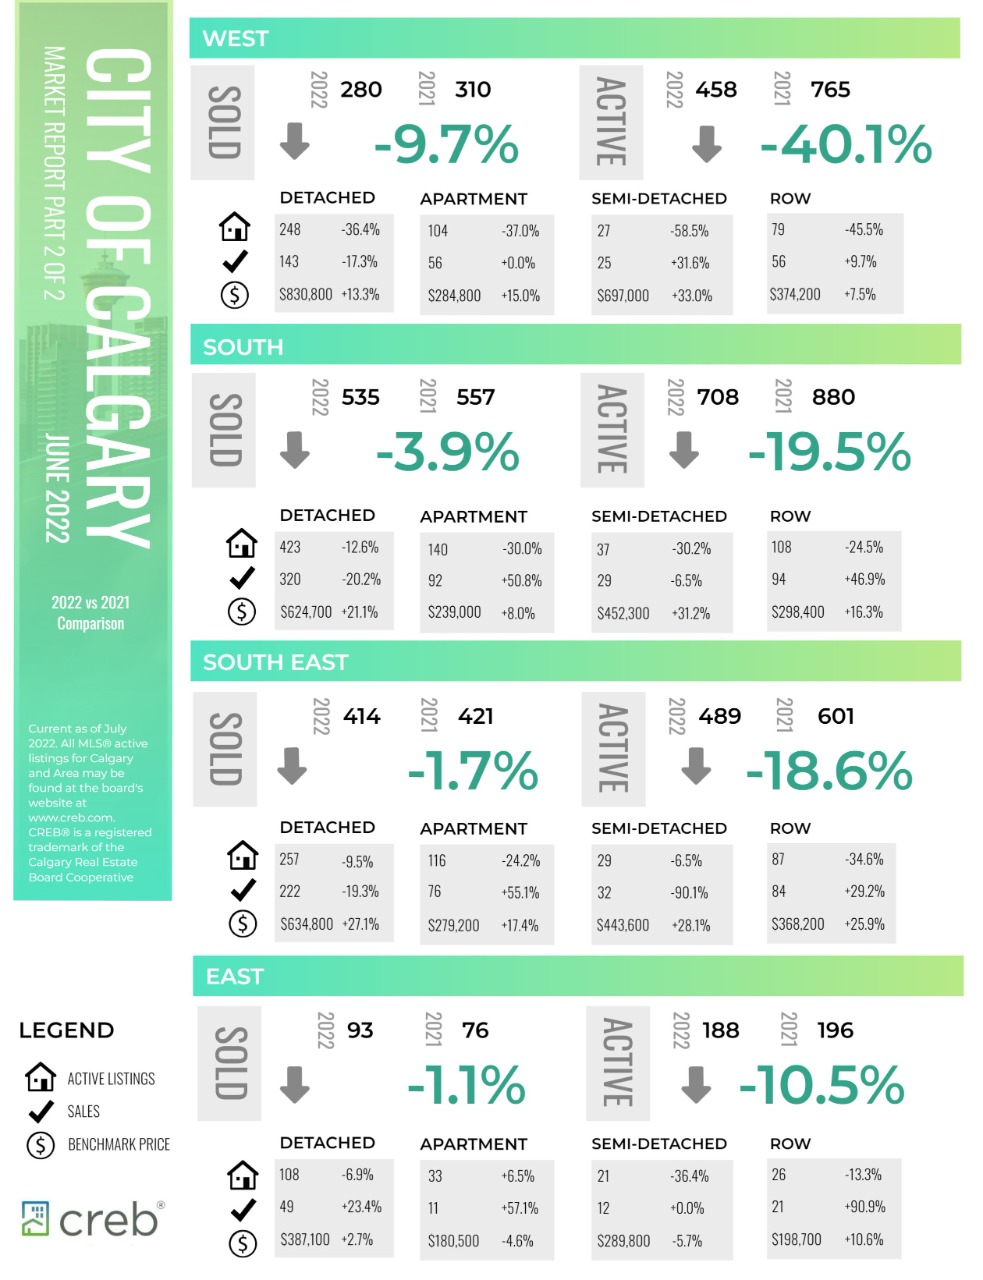
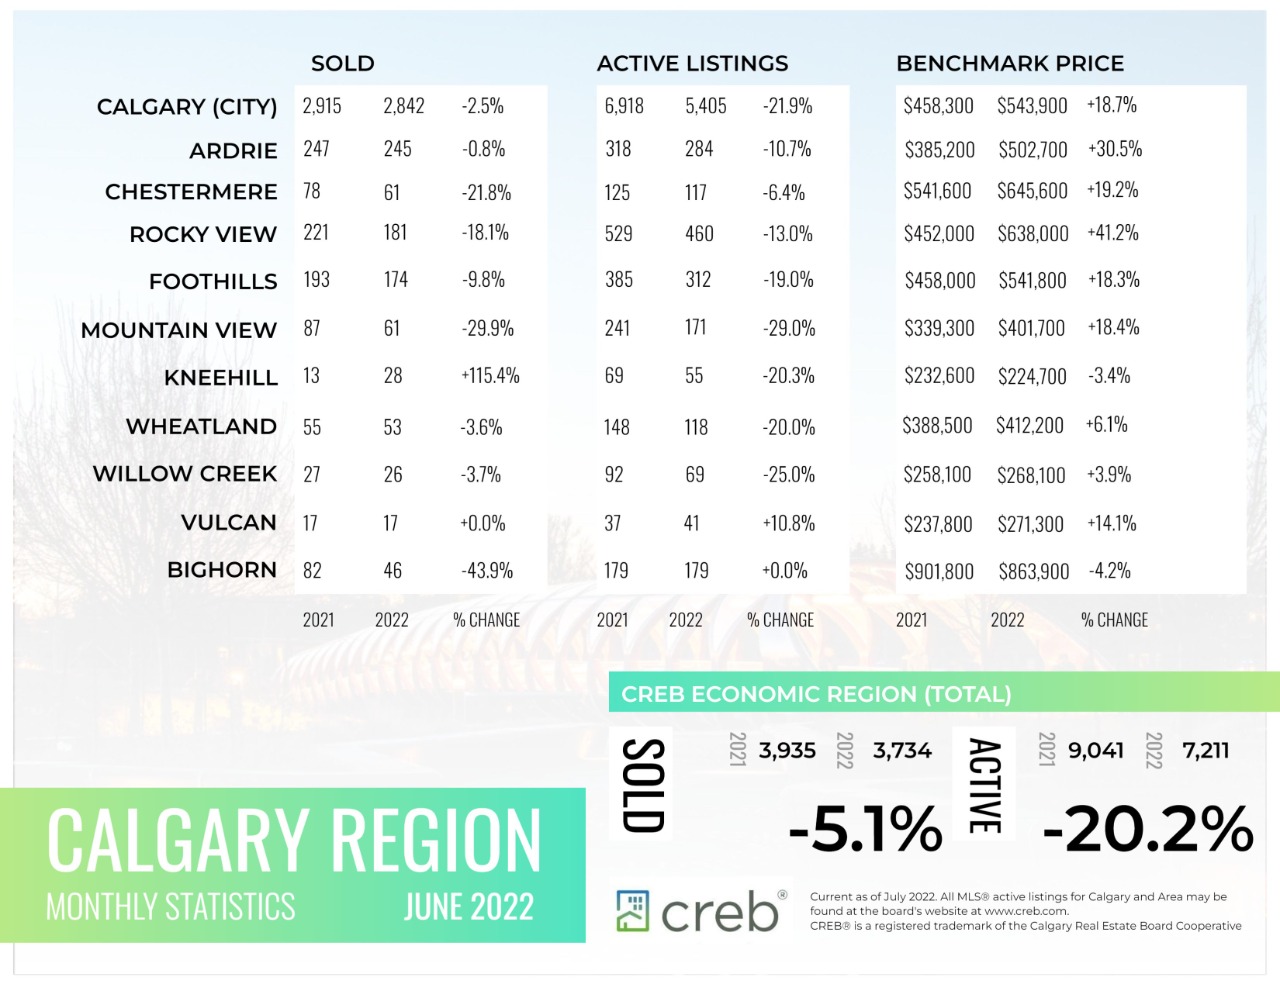
Sales activity in June eased relative to the past several months and with 2,842 sales, levels declined by two per cent over last year’s record high. While sales activity has remained relatively strong for June levels, the decline was driven by a pullback in detached and semi-detached home sales.
“As expected, higher interest rates are starting to have an impact on home sales. This is
helping shift the market toward more balanced conditions and taking some of the pressure off prices,” said CREB® Chief Economist Ann-Marie Lurie.
“While we are starting to see some transition, it is important to note that in Calgary year-todate sales are still at record levels and prices are still far above expectations for the year.”
This pullback in sales was not met with the same level of pullback in new listings. This
caused inventories to trend up over previous months. These shifts are supporting some easing from the exceptionally tight conditions as the months of supply remained just shy of two months. While two months is still considered low for our market, it is a significant change over the one month of supply recorded earlier in the year.
Read the full report on the CREB website!
The following data is a comparison between June 2022 and June 2021 numbers, and is current as of July 2022. For last month’s numbers, check out our previous infographic.
Or follow this link for all our CREB Infographics!
Click on the images for a larger view!
Download Printable Version – June 2022 CREB, City of Calgary Report Part 1
Download Printable Version – June 2022 CREB, City of Calgary Report Part 2
Download Printable Version – June 2022 CREB, Calgary Region Report
Last Updated on November 28, 2023 by myRealPage
