INFOGRAPHICS: September 2018 TREB Toronto Market Reports

Here are the latest market updates for areas covered by the Toronto Real Estate Board (TREB)!
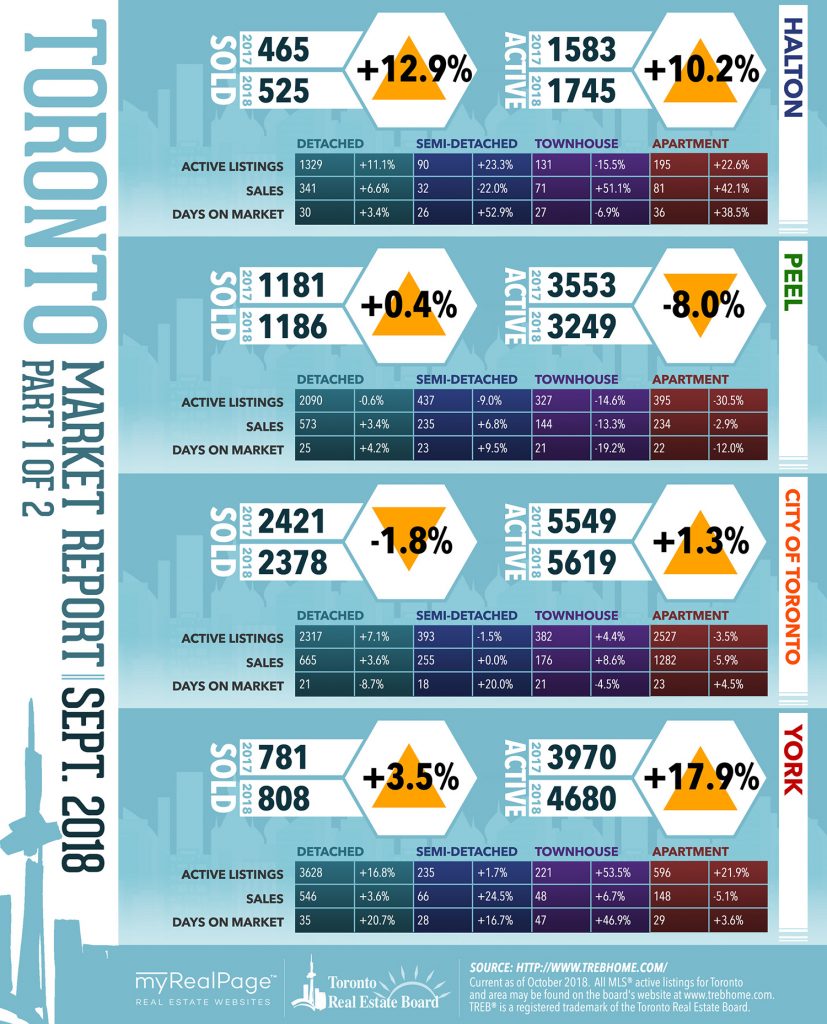
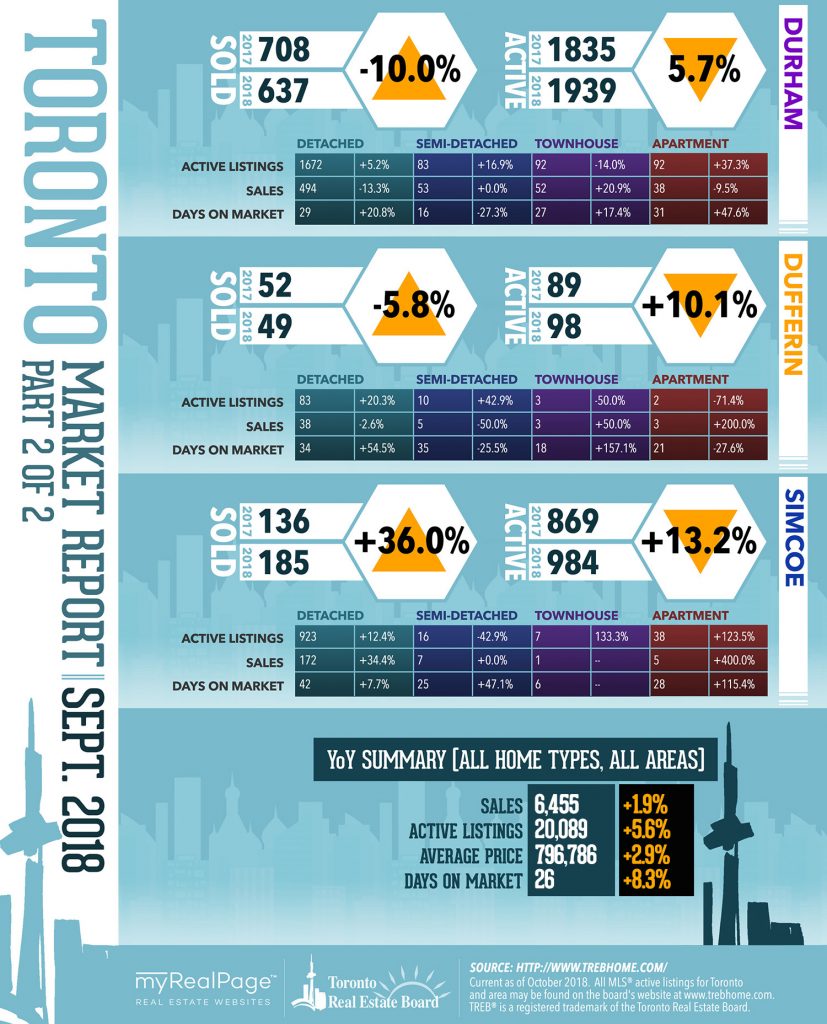
According to TREB’s most recent press release, we’re seeing a bit of upward movement within the market for the month of September. Sales were reported to have increased by 1.9% versus September 2017, while the average selling price was up by 2.9%, and the HPI composite benchmark price was up by 2% for the same period.
Toronto Real Estate Board President Garry Bhaura adds,
“It is healthy to see sales and prices in many areas across the Greater Toronto Area up a bit, compared to last year’s lows. At the same, however, it is important to remember that TREB’s market area is made up of over 500 communities. Market conditions have obviously unfolded differently across these communities. This is why it’s important to work with a REALTOR® who is familiar with local market conditions in your areas of interest.
While higher borrowing costs and tougher mortgage qualification rules have kept sales levels off the record pace set in 2016, many households remain positive about home ownership as a quality long-term investment. As the GTA population continues to grow, the real challenge in the housing market will be supply rather than demand. The Toronto Real Estate Board is especially concerned with issues affecting housing supply as we move towards municipal elections across the region.”
Jason Mercer, TREB’s Director of Market Analysis also notes,
“Generally speaking, annual rates of price growth have been stronger for higher density home types in 2018, including condominium apartments, townhouses and semi-detached houses. In many neighbourhoods, these home types provide more affordable home ownership options. This is why a policy focus on increasing mid-density housing options throughout the GTA is important.”
UPDATE: In January 2020, TREB has since rebranded to TRREB, the Toronto Regional Real Estate Board.
The following data is a comparison between September 2017 and September 2018 numbers, and is current as of October 2018. For last month’s numbers, check out our previous infographic! Or follow this link for all our TREB Infographics!
Click on the images for a larger view!
(Protip: Make sure to grab the printable PDF versions, too! It fits best when printed on A4-sized sheets, AND we’ve added an area on the sheet where you can attach your business card! 🙂 )
Download Printable Version – September 2018 TREB, Toronto Market Report
(Image Source: http://www.trebhome.com)
Last Updated on July 25, 2022 by myRealPage
