INFOGRAPHICS: August 2025 FVREB Fraser Valley Market Reports
Declining prices and high inventory strengthen buyer’s market heading into fall
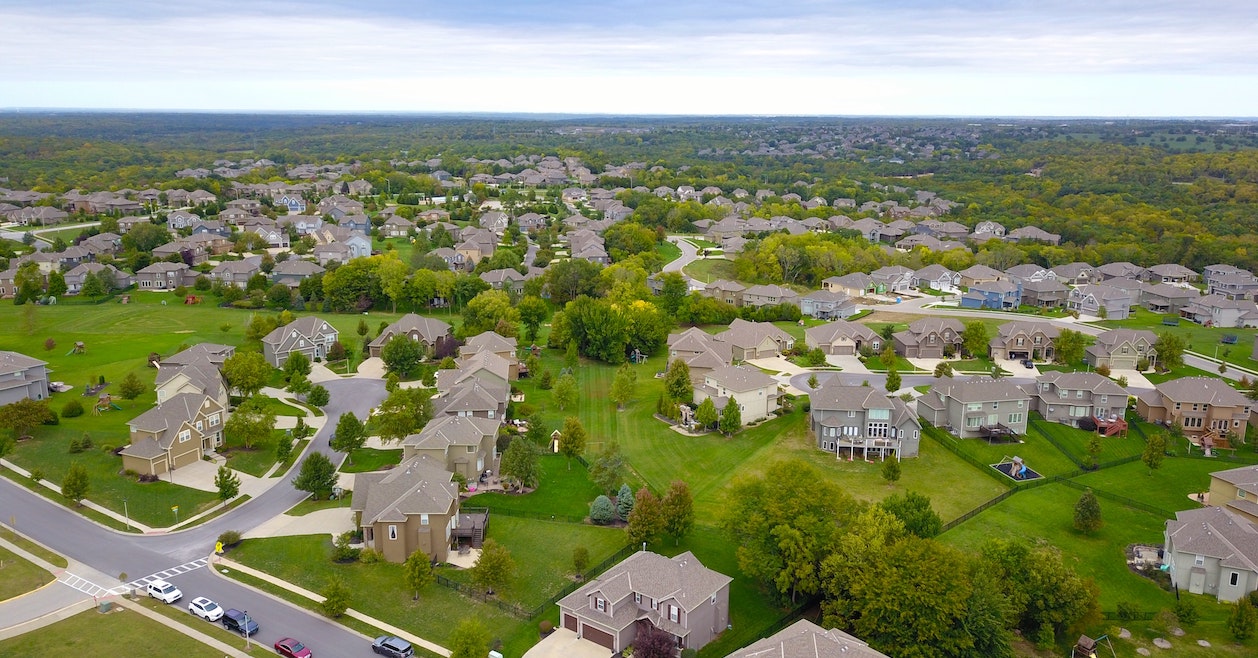
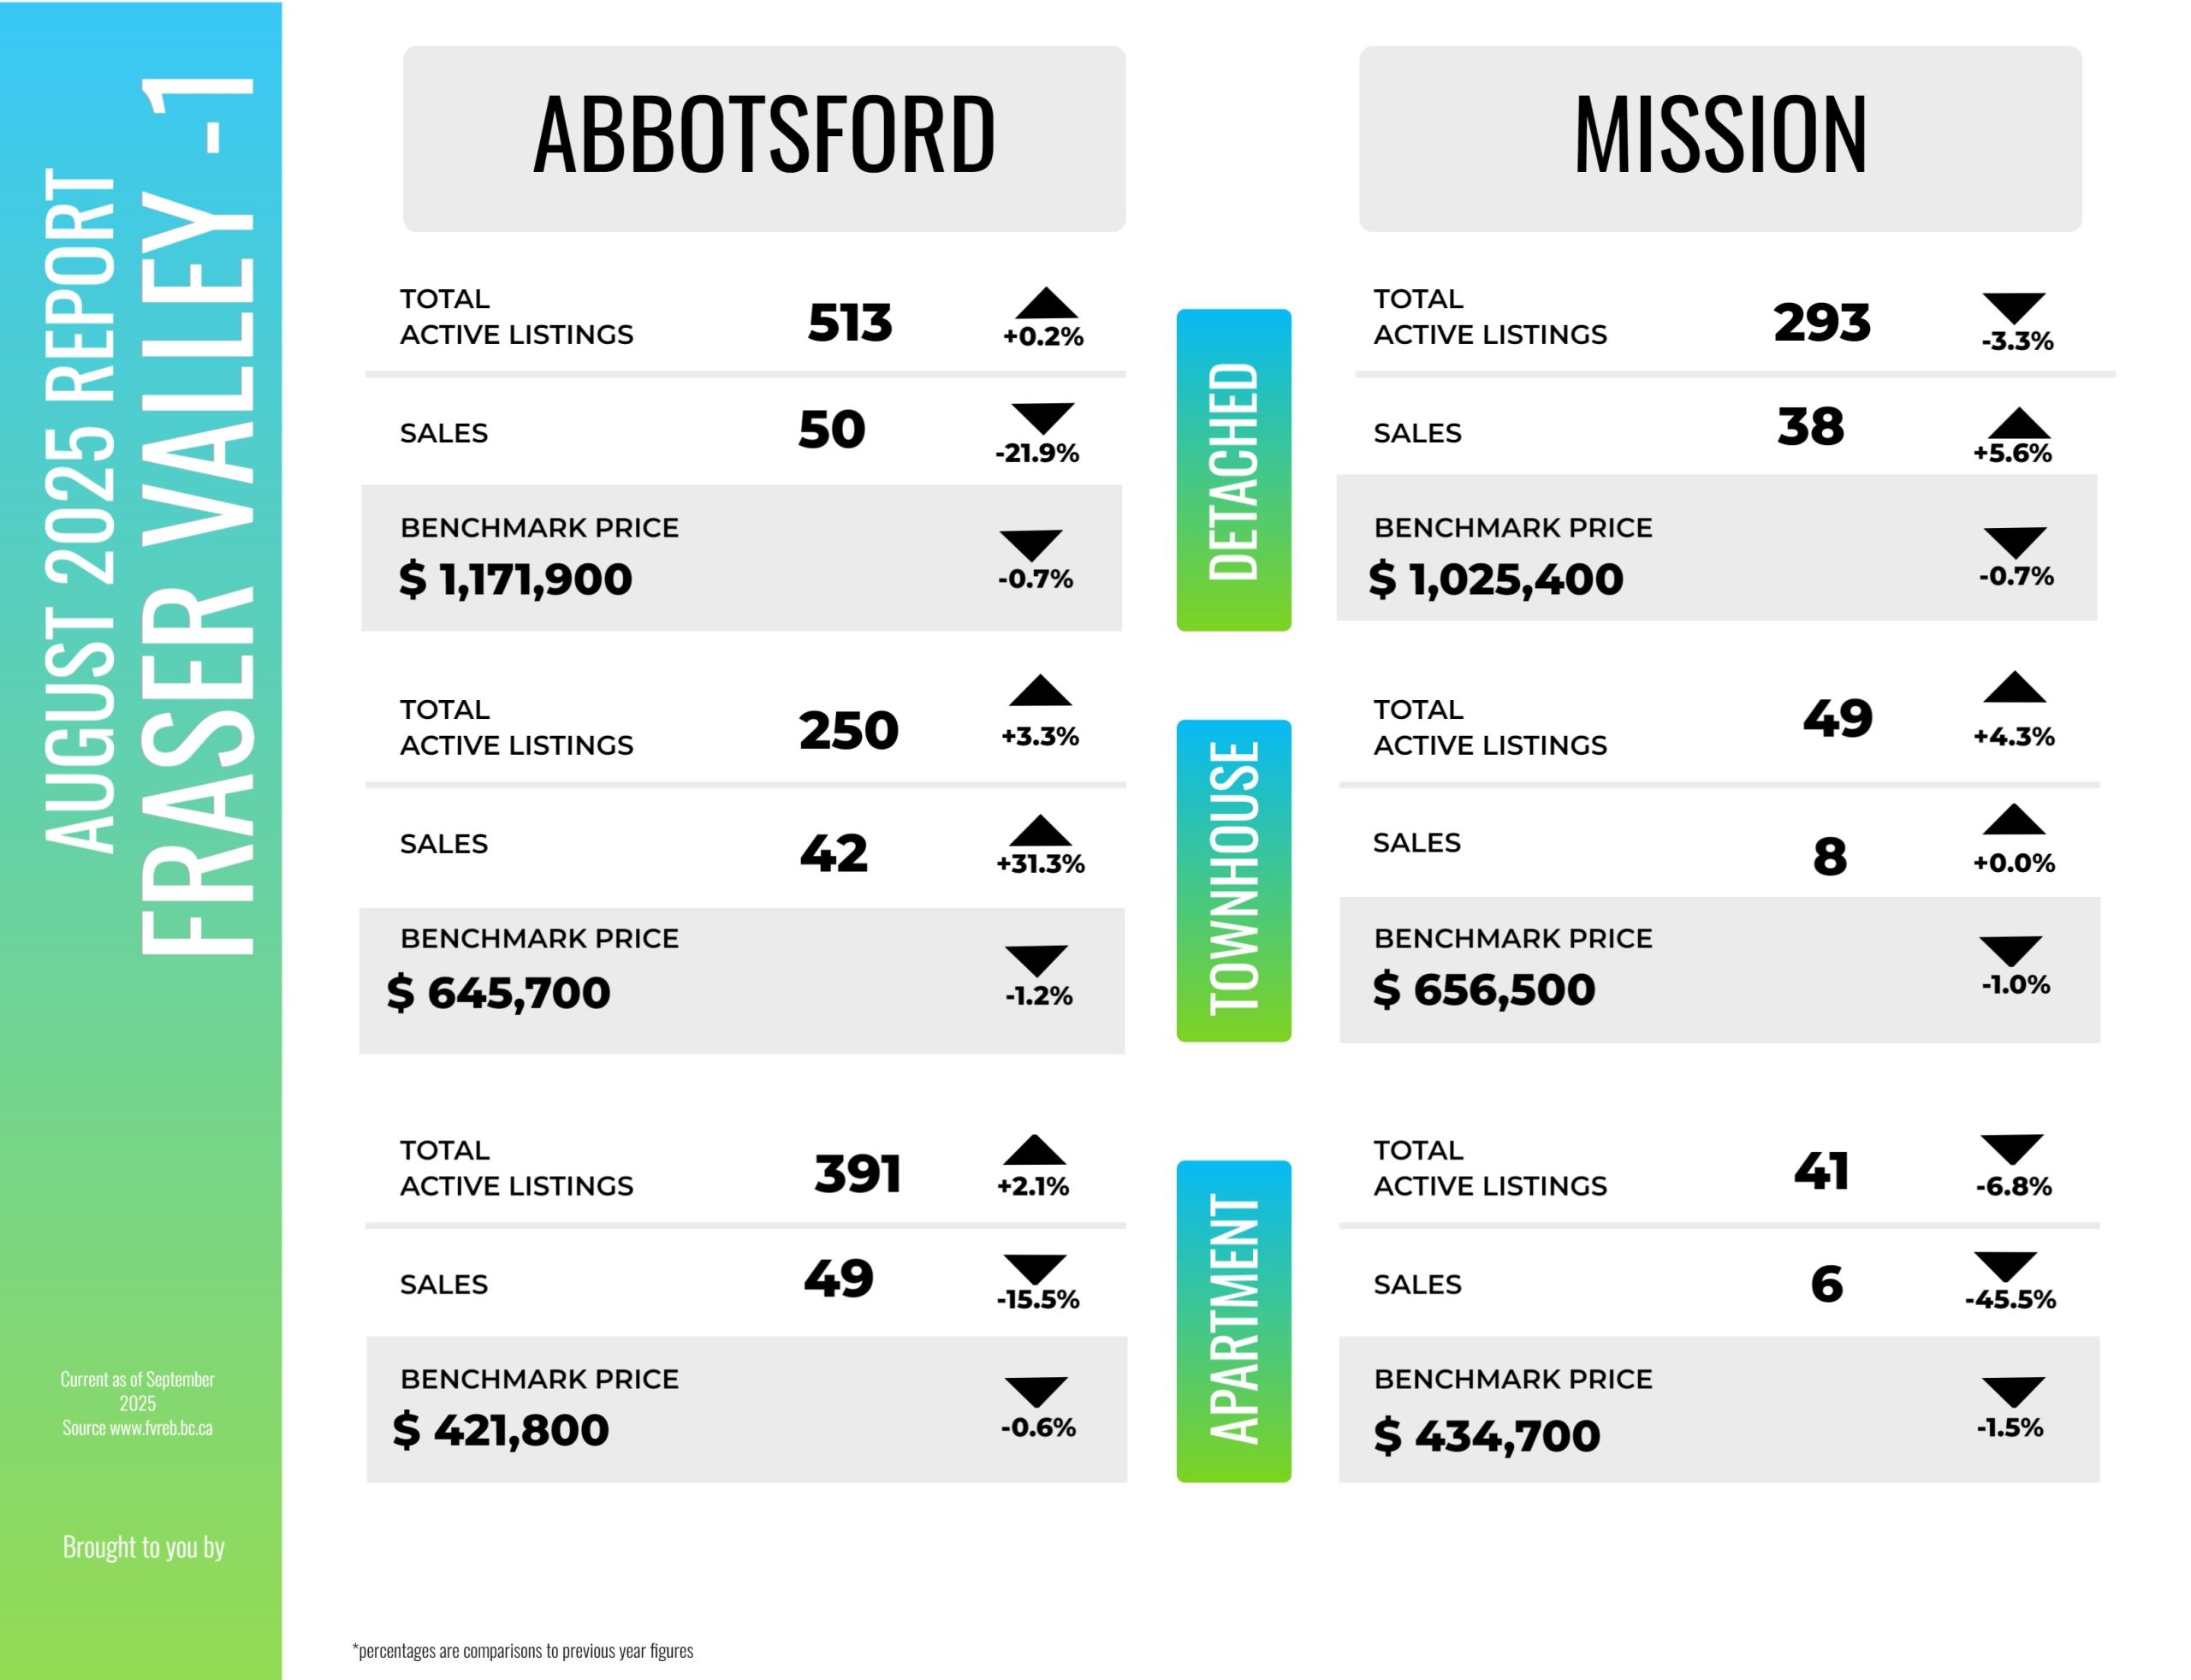
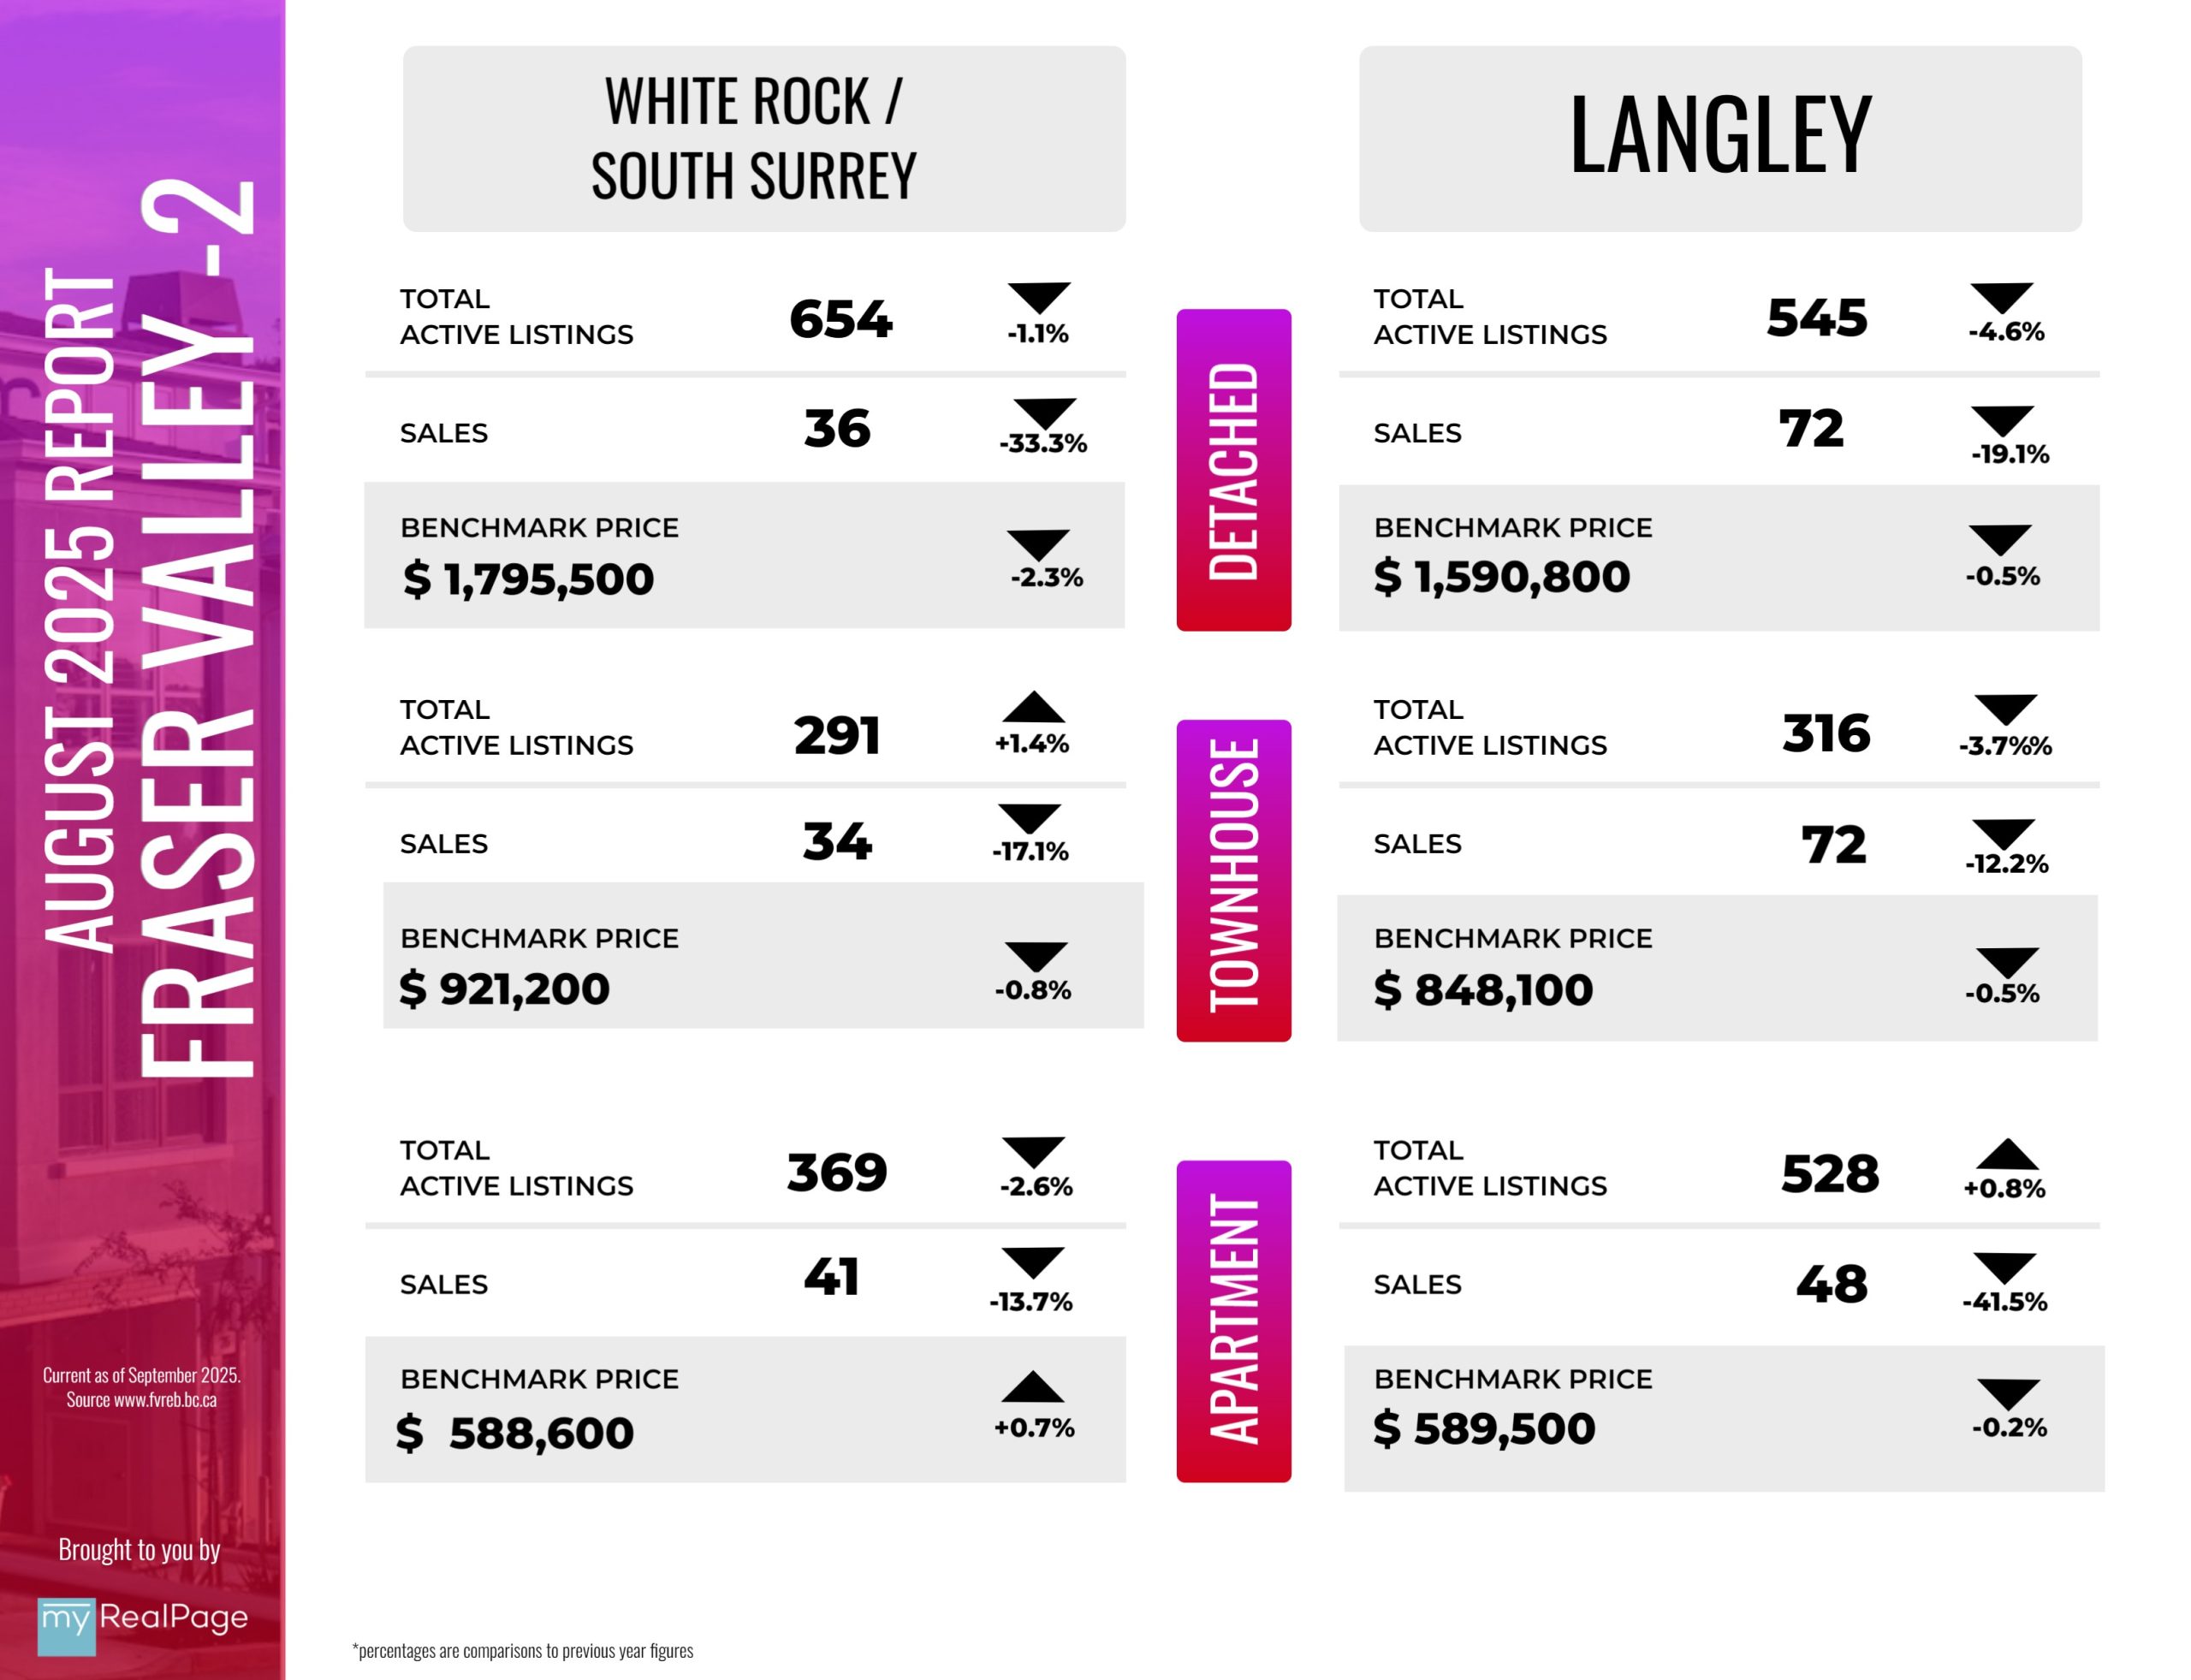
Fraser Valley home sales fell more than 20 per cent in August, but buyers who did get into the market were able to take advantage of favourable conditions including abundant choice, softer prices and more time to make decisions.
The Fraser Valley Real Estate Board recorded 931 sales on its Multiple Listing Service® (MLS®) in August, down 22 per cent from July and down 13 per cent year-over-year. August sales were 36 per cent below the 10-year average.
The Fraser Valley buyer’s market remains strong with inventory levels holding relatively stable, down just two per cent to 10,445 active listings. Newly listed homes declined 19 per cent month-over-month to 2,793; up half a per cent year-over-year. The overall sales-to-active listings ratio for August dropped to nine per cent, down two per cent from July. The market is considered balanced when the ratio is between 12 per cent and 20 per cent.
Read the full report on the FVREB website!
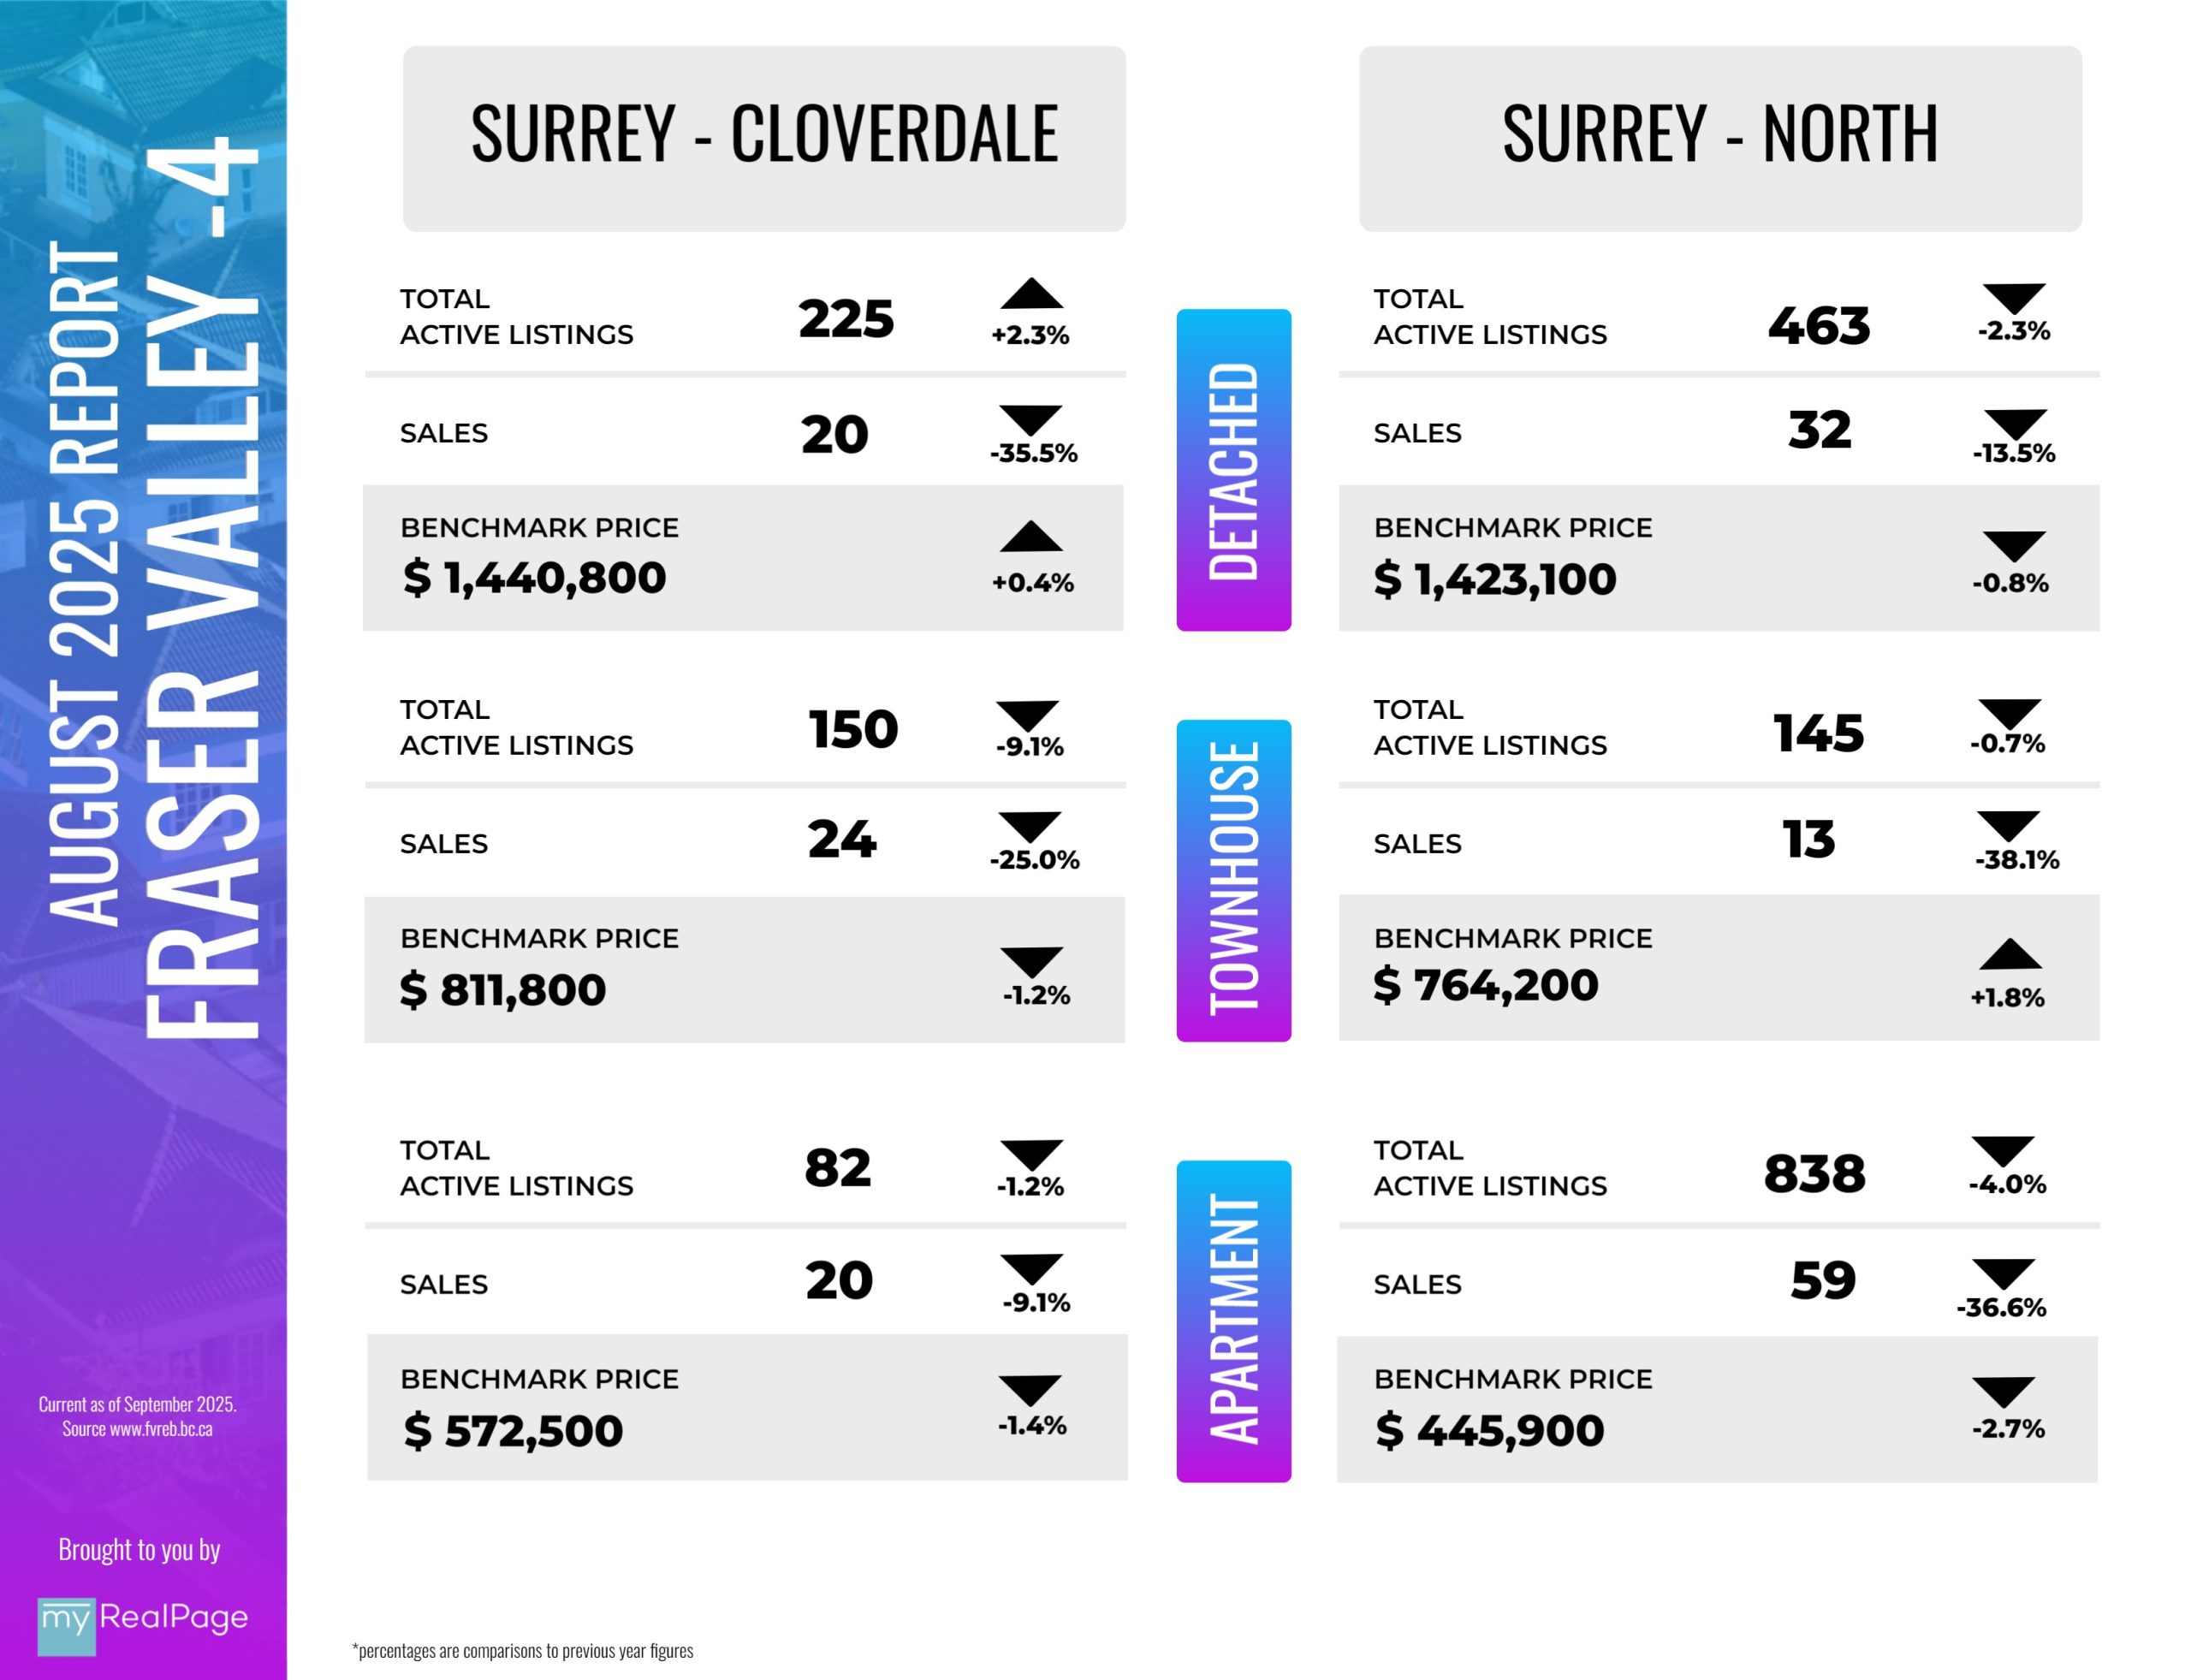
The following data is a comparison between August 2025 and August 2024 numbers, and is current as of September of 2025. For last month’s report, check out our previous infographic!
Or follow this link for all our FVREB Infographics!
These infographics cover current trends in Fraser Valley neighbourhoods that are within the FVREB. Click on the images for a larger view!
Download Printable Version – FVREB August 2025 Market Report
Last Updated on September 8, 2025 by myRealPage
