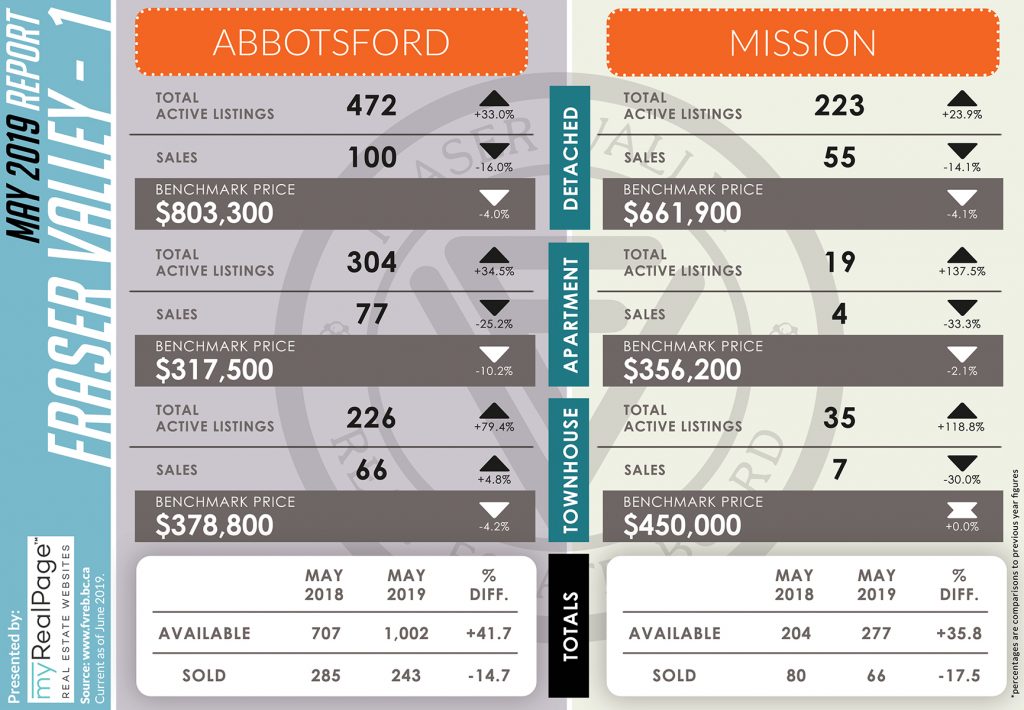
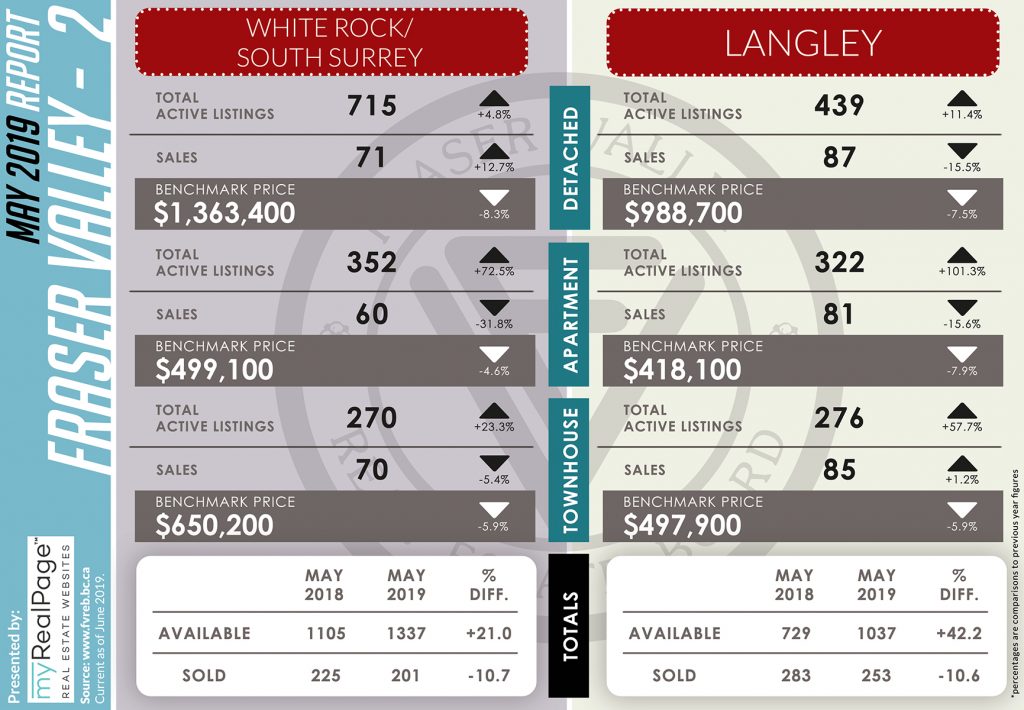
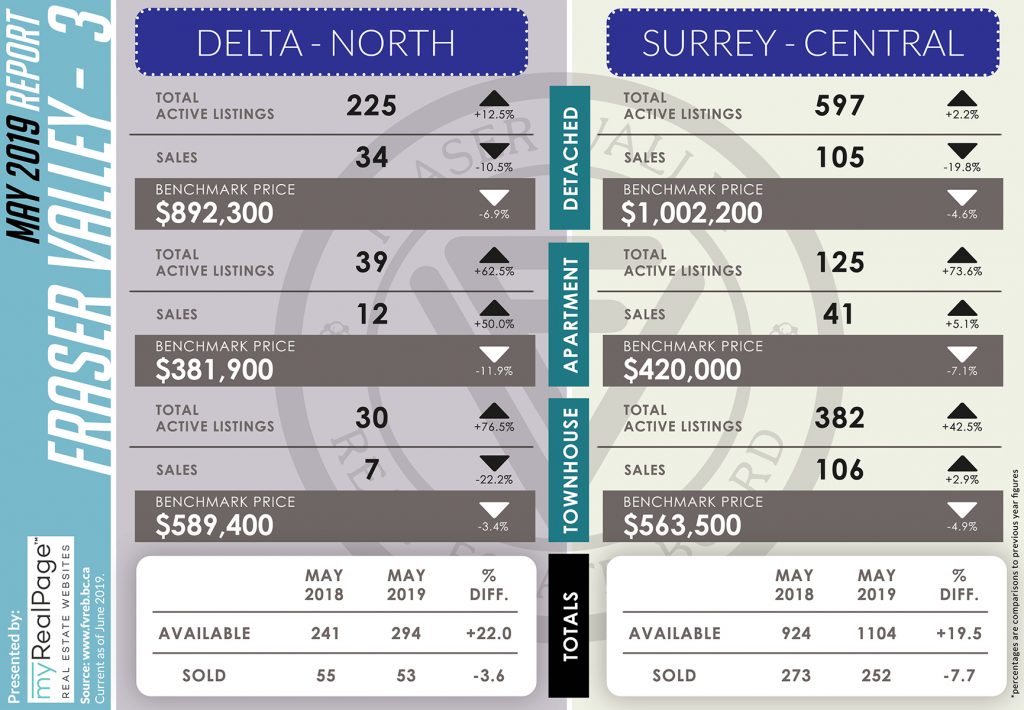
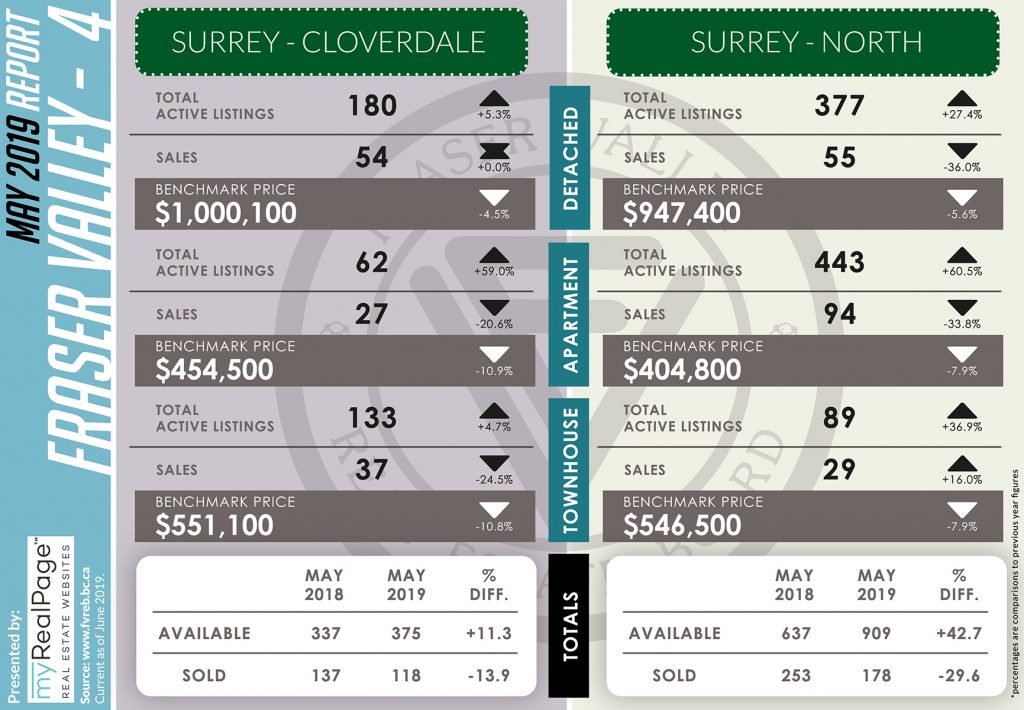
INFOGRAPHICS: May 2019 FVREB Fraser Valley, South Surrey, Etc. Market Reports
In the blink of an eye, it’s already June! Meanwhile, here are this month’s market updates for the Fraser Valley Real Estate Board (FVREB).
According to this month’s market report, the Fraser Valley Real Estate Board processed 1,517 sales of all property types on its Multiple Listing Service® (MLS®) in May, a 13.7% decrease compared to the 1,758 sales in May of last year. There were also 8,506 active listings available in the Fraser Valley at the end of May, an increase of 26.3% compared to May of last year.
Darin Germyn, President of the Board, notes:
“Buyers are recognizing that in the last three months, home prices have stopped declining and that in order to take advantage of the improvement in prices over the past year, now is a great time to consider making the purchase they held off on in the previous months.
We’re seeing buyers who have been waiting on the sidelines, act, because of better price opportunities and more selection. It’s been four years since buyers had this much choice in the Fraser Valley.
Key to this market is pricing. We empathize with our clients on the challenges they face today to qualify to buy a home and we work with them to find the right property at a realistic price they can afford.”
The following data is a comparison between May 2018 and May 2019 numbers, and is current as of June 2019. For last month’s report, check out our previous infographic!
Or follow this link for all our FVREB Infographics!
These infographics cover current trends in Fraser Valley neighbourhoods that are within the FVREB.
Click on the images for a larger view!
(Protip: Make sure to grab the printable PDF version, too! It fits best when printed on A4-sized sheets, AND we’ve added an area on the sheet where you can attach your business card! 🙂 )
Download Printable Version – FVREB May 2019 Market Report
Last Updated on July 25, 2022 by myRealPage


