INFOGRAPHICS: March 2026 VREB Victoria Market Reports

Victoria Real Estate Market Report for March 2026
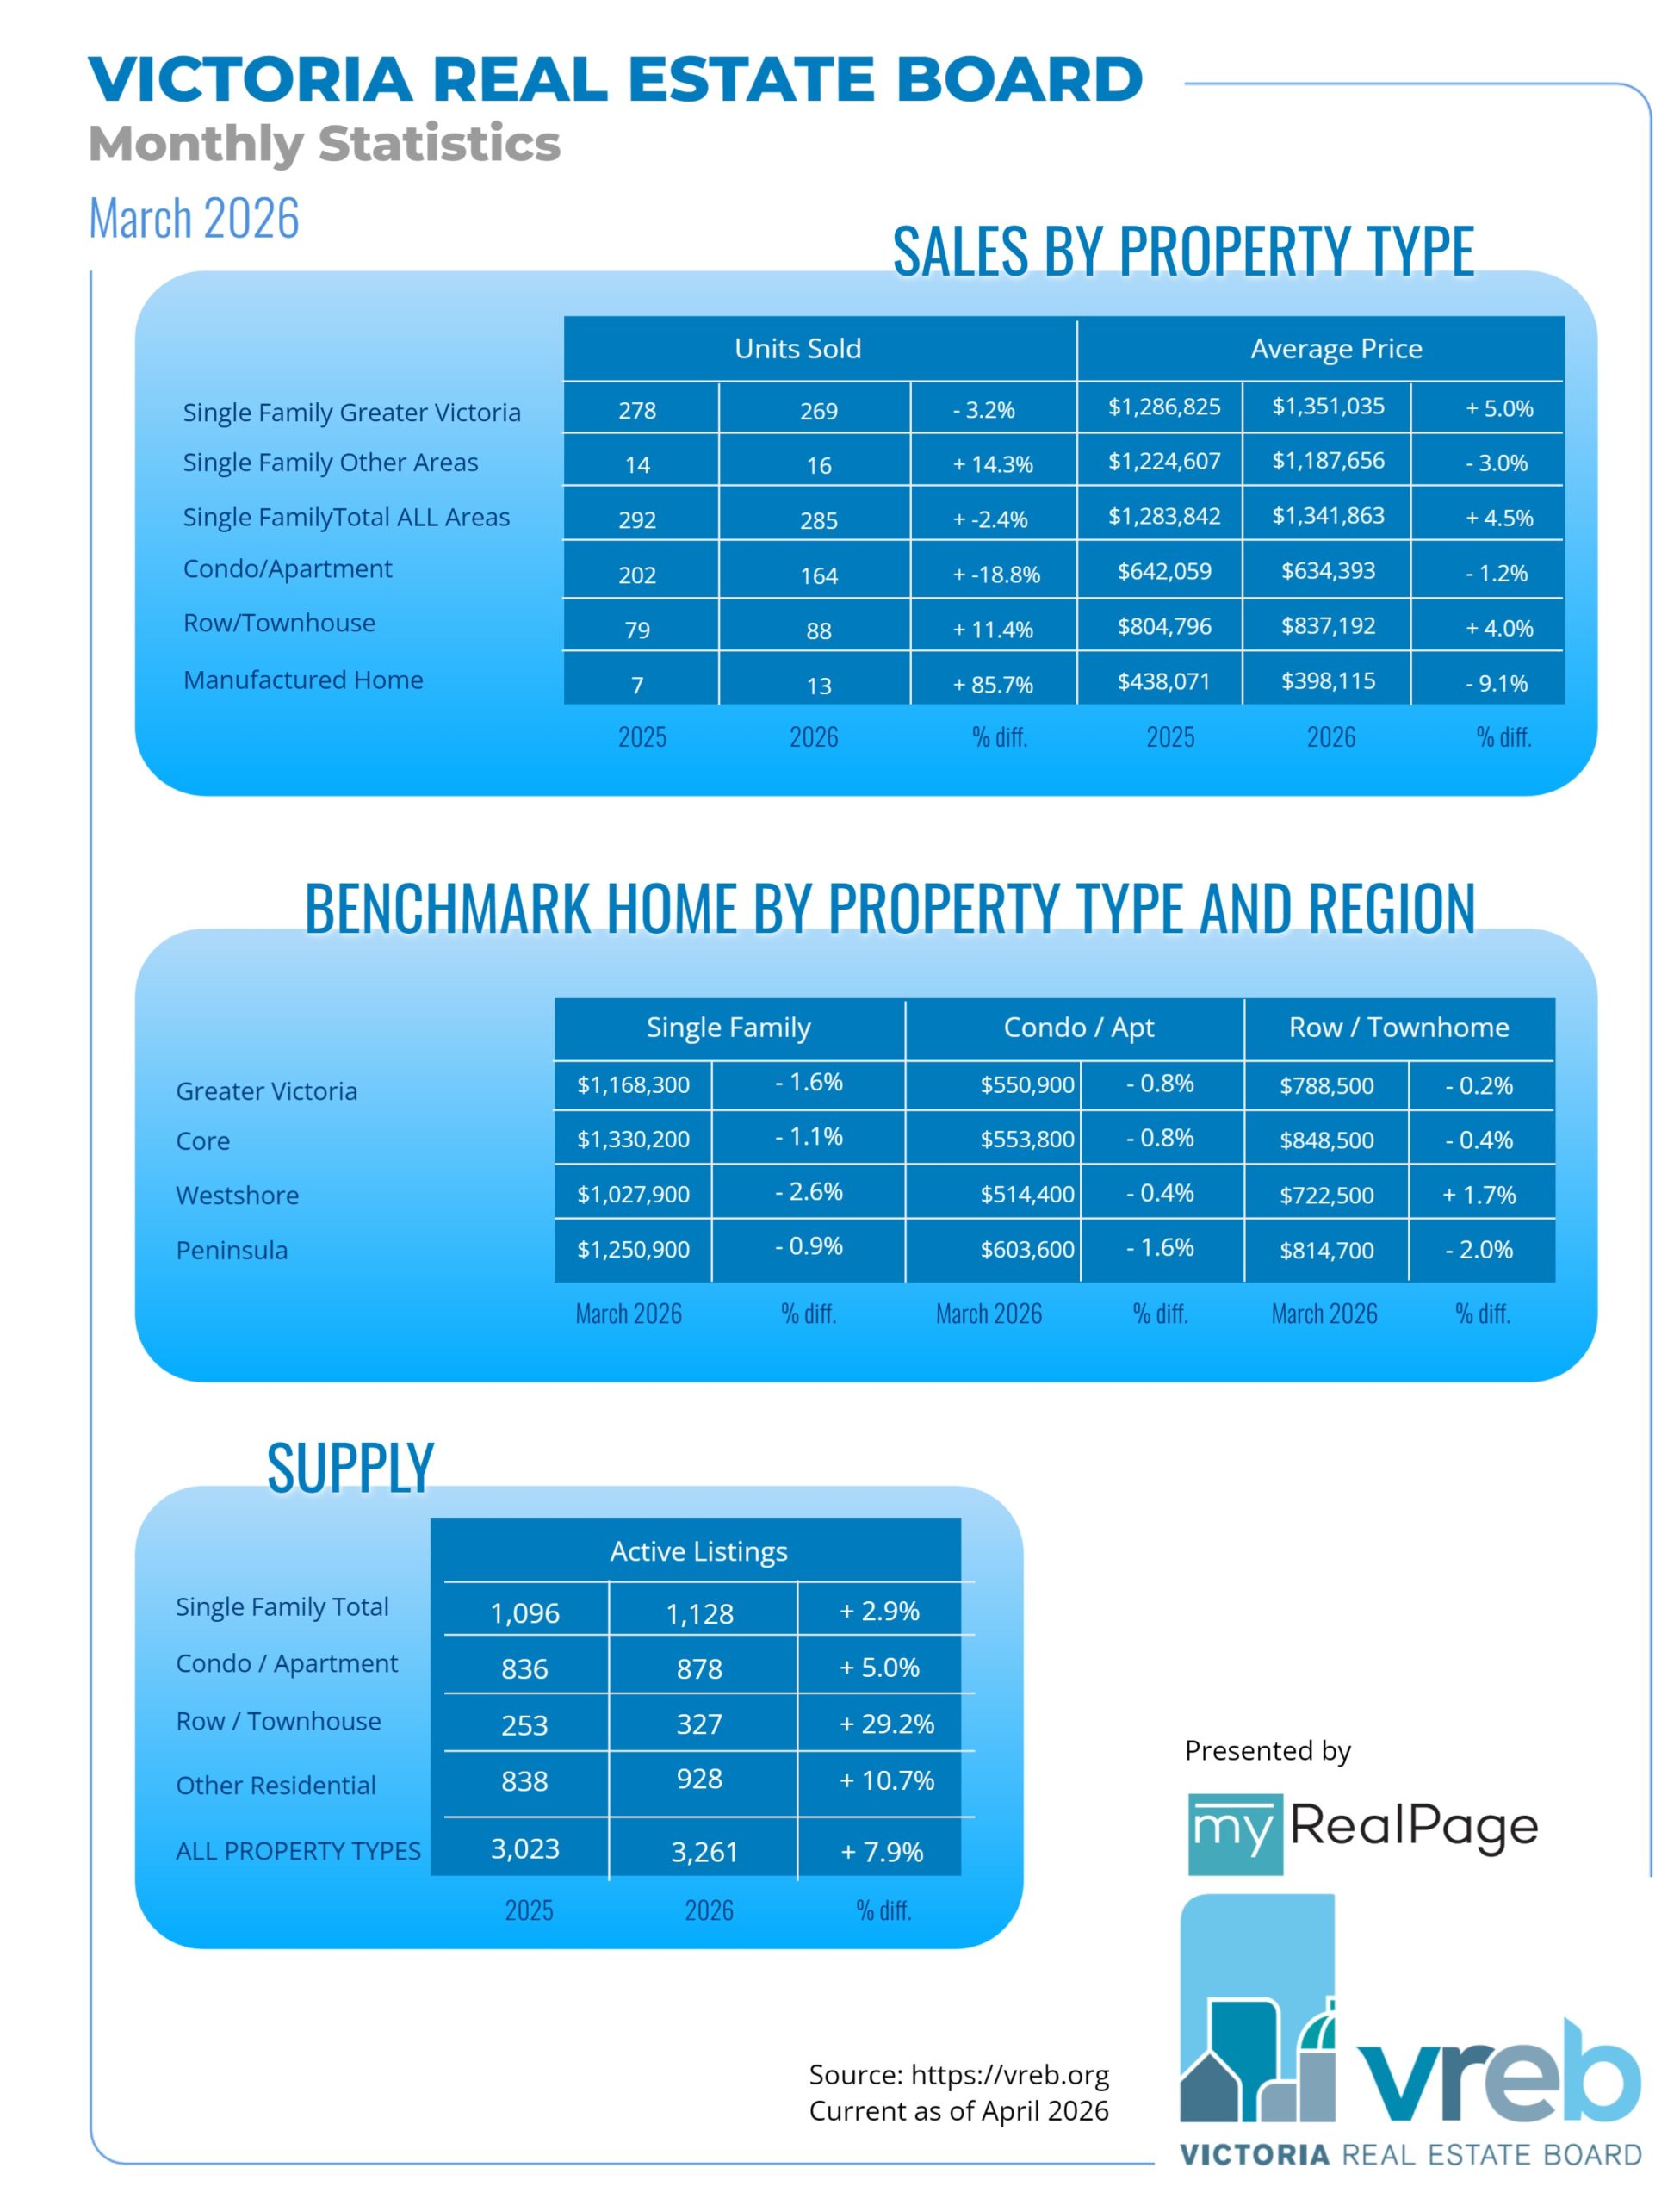
A total of 579 properties sold in the Victoria Real Estate Board region this March, 5.5 per cent fewer than the 613 properties sold in March 2025 and 24.5 per cent more than in February 2026. Sales of condominiums decreased by 18.8 per cent from March 2025 with 164 units sold. Sales of single family homes decreased by 2.4 per cent from March 2025 with 285 sold.
“Our market is following a fairly typical spring market trend,” said Victoria Real Estate Board Chair Fergus Kyne. “With sales and listings both increasing from the previous month, we’re tracking a seasonal pattern that generally builds to the peak of the market in May or June.”
There were 3,261 active listings for sale on the Victoria Real Estate Board Multiple Listing Service® at the end of March 2026, an increase of 12.3 per cent compared to the previous month of February and a 7.9 per cent increase from the 3,023 active listings for sale at the end of March 2025.
Read the full report on VREB website!
The following data is a comparison between March 2026 and March 2025 numbers, and is current as of April 2026. Click here to check out last month’s figures!
You can also follow this link for all our Victoria Board monthly infographics!
Click on the images for a larger view!
Download Printable Version – February 2026 VREB, Victoria Market Report
Last Updated on April 6, 2026 by myRealPage
