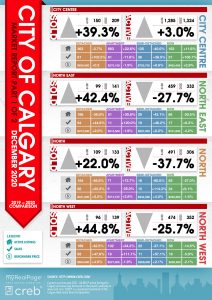
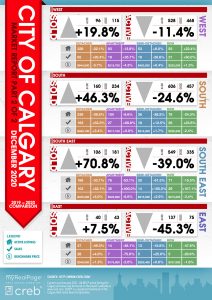
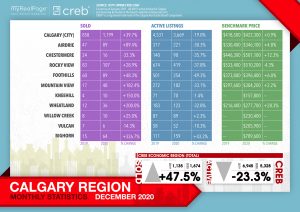
INFOGRAPHICS: December 2020 CREB City And Region Market Reports

December 2020: Amidst economic challenges, housing market ends 2020 on a high note
With December sales of 1,199, this is the highest December total since 2007.
“Housing demand over the second half of 2020 was far stronger than anticipated and nearly offset the initial impact caused by the shutdowns in spring,” said CREB® chief economist Ann-Marie Lurie.
“Even with the further restrictions imposed in December, it did not have the same negative impact on housing activity like we saw in the earlier part of the year.”
Attractive interest rates, along with prices that remain lower than several years ago, have likely supported some of the recovery in the second half of the year. However, it is important to note that annual sales activity declined by one per cent compared to last year and remains well below long-term averages.
Read the full report on the CREB website.
The following data is a comparison between December 2019 and December 2020 numbers, and is current as of January 2021. For last month’s numbers, check out our previous infographic.
Or follow this link for all our CREB Infographics!
Click on the images for a larger view! (Protip: Make sure to grab the printable PDF versions, too! It fits best when printed on A4-sized sheets, AND we’ve added an area on the sheet where you can attach your business card! 🙂 )
Download Printable Version – December 2020 CREB, City of Calgary Report
Download Printable Version – December 2020 CREB, Calgary Region Report
Last Updated on July 25, 2022 by myRealPage


