INFOGRAPHICS: November 2020 CREB City And Region Market Reports
Sales activity remains strong in November.
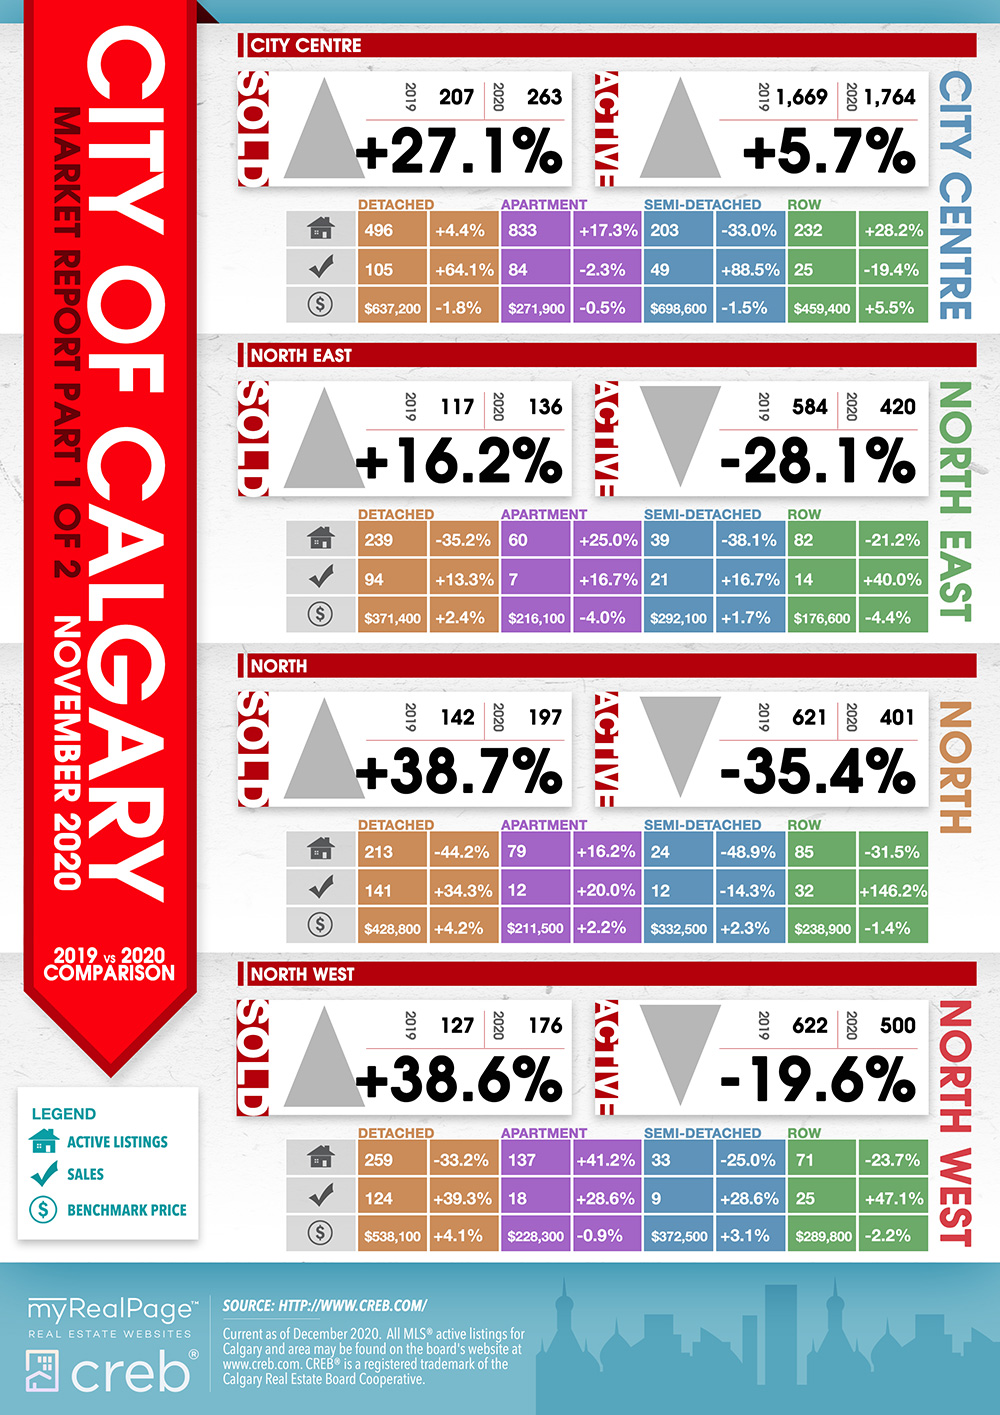
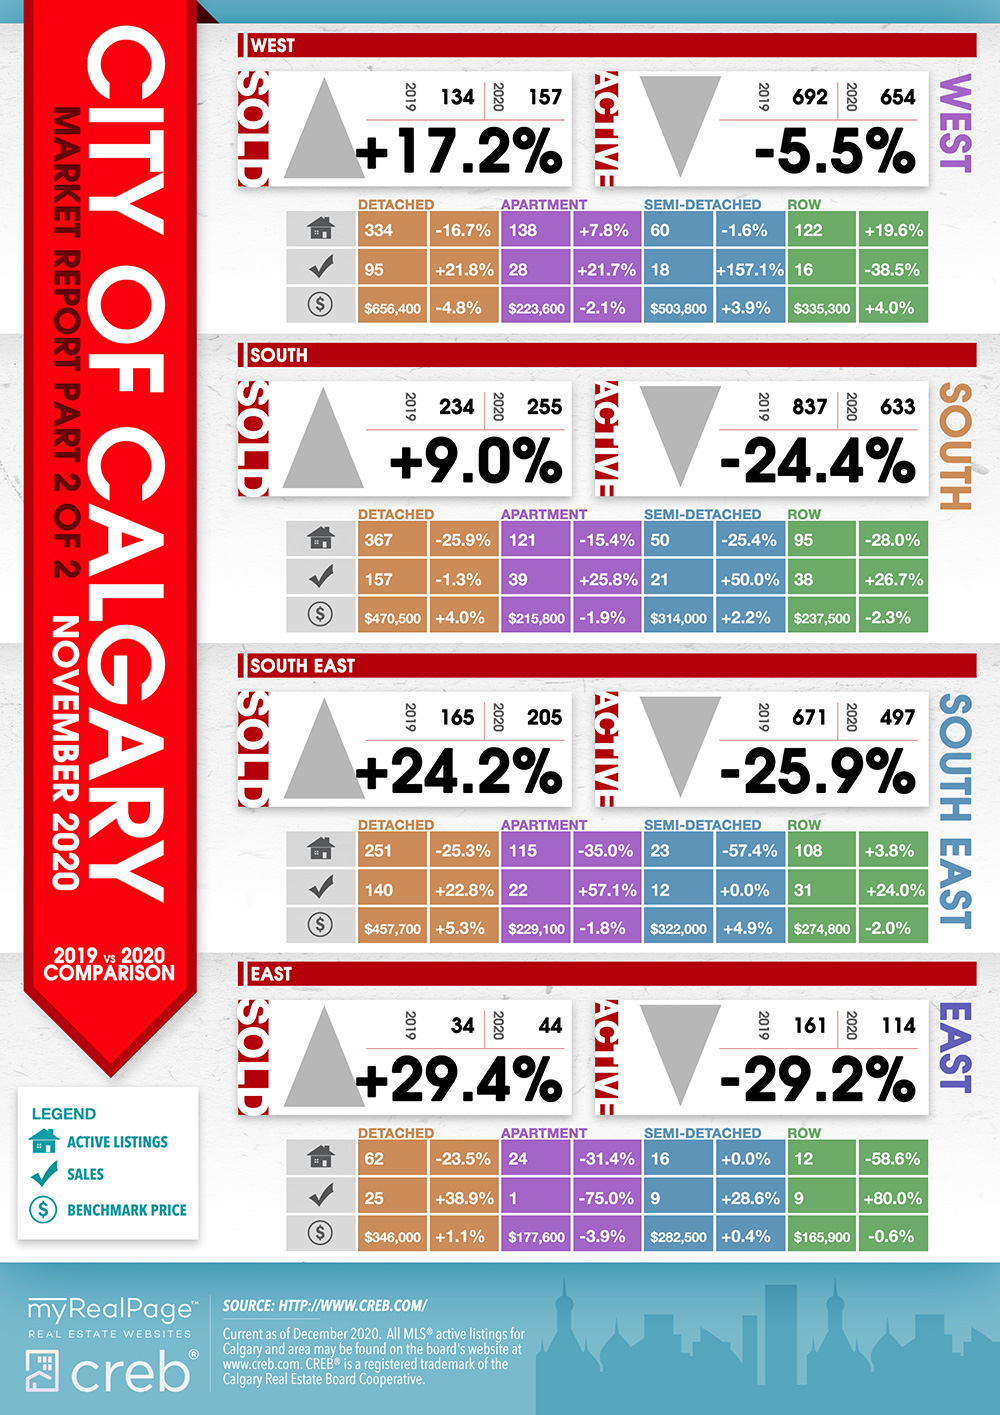
For the sixth month in a row, sales in the Calgary market recorded a year-over-year gain.
Sales growth over the past several months has been the strongest seen in the past five years, but the activity has not been strong enough to offset the pullbacks from the spring. Year-to-date sales remain over 3% lower than last year’s levels.
New listings continue to slow, reducing inventory in the market. On a year-to-date basis, new listings have eased by nearly 10% and are at the lowest level recorded since 2001. This has reduced the oversupply that has been impacting the market for nearly five years.
Read the full report on the CREB website!
The following data is a comparison between November 2019 and November 2020 numbers, and is current as of December 2020. For last month’s numbers, check out our previous infographic.
Or follow this link for all our CREB Infographics!
Click on the images for a larger view! (Protip: Make sure to grab the printable PDF versions, too! It fits best when printed on A4-sized sheets, AND we’ve added an area on the sheet where you can attach your business card! 🙂 )
Download Printable Version – November 2020 CREB, City of Calgary Report
Download Printable Version – November 2020 CREB, Calgary Region Report

Last Updated on July 25, 2022 by myRealPage
