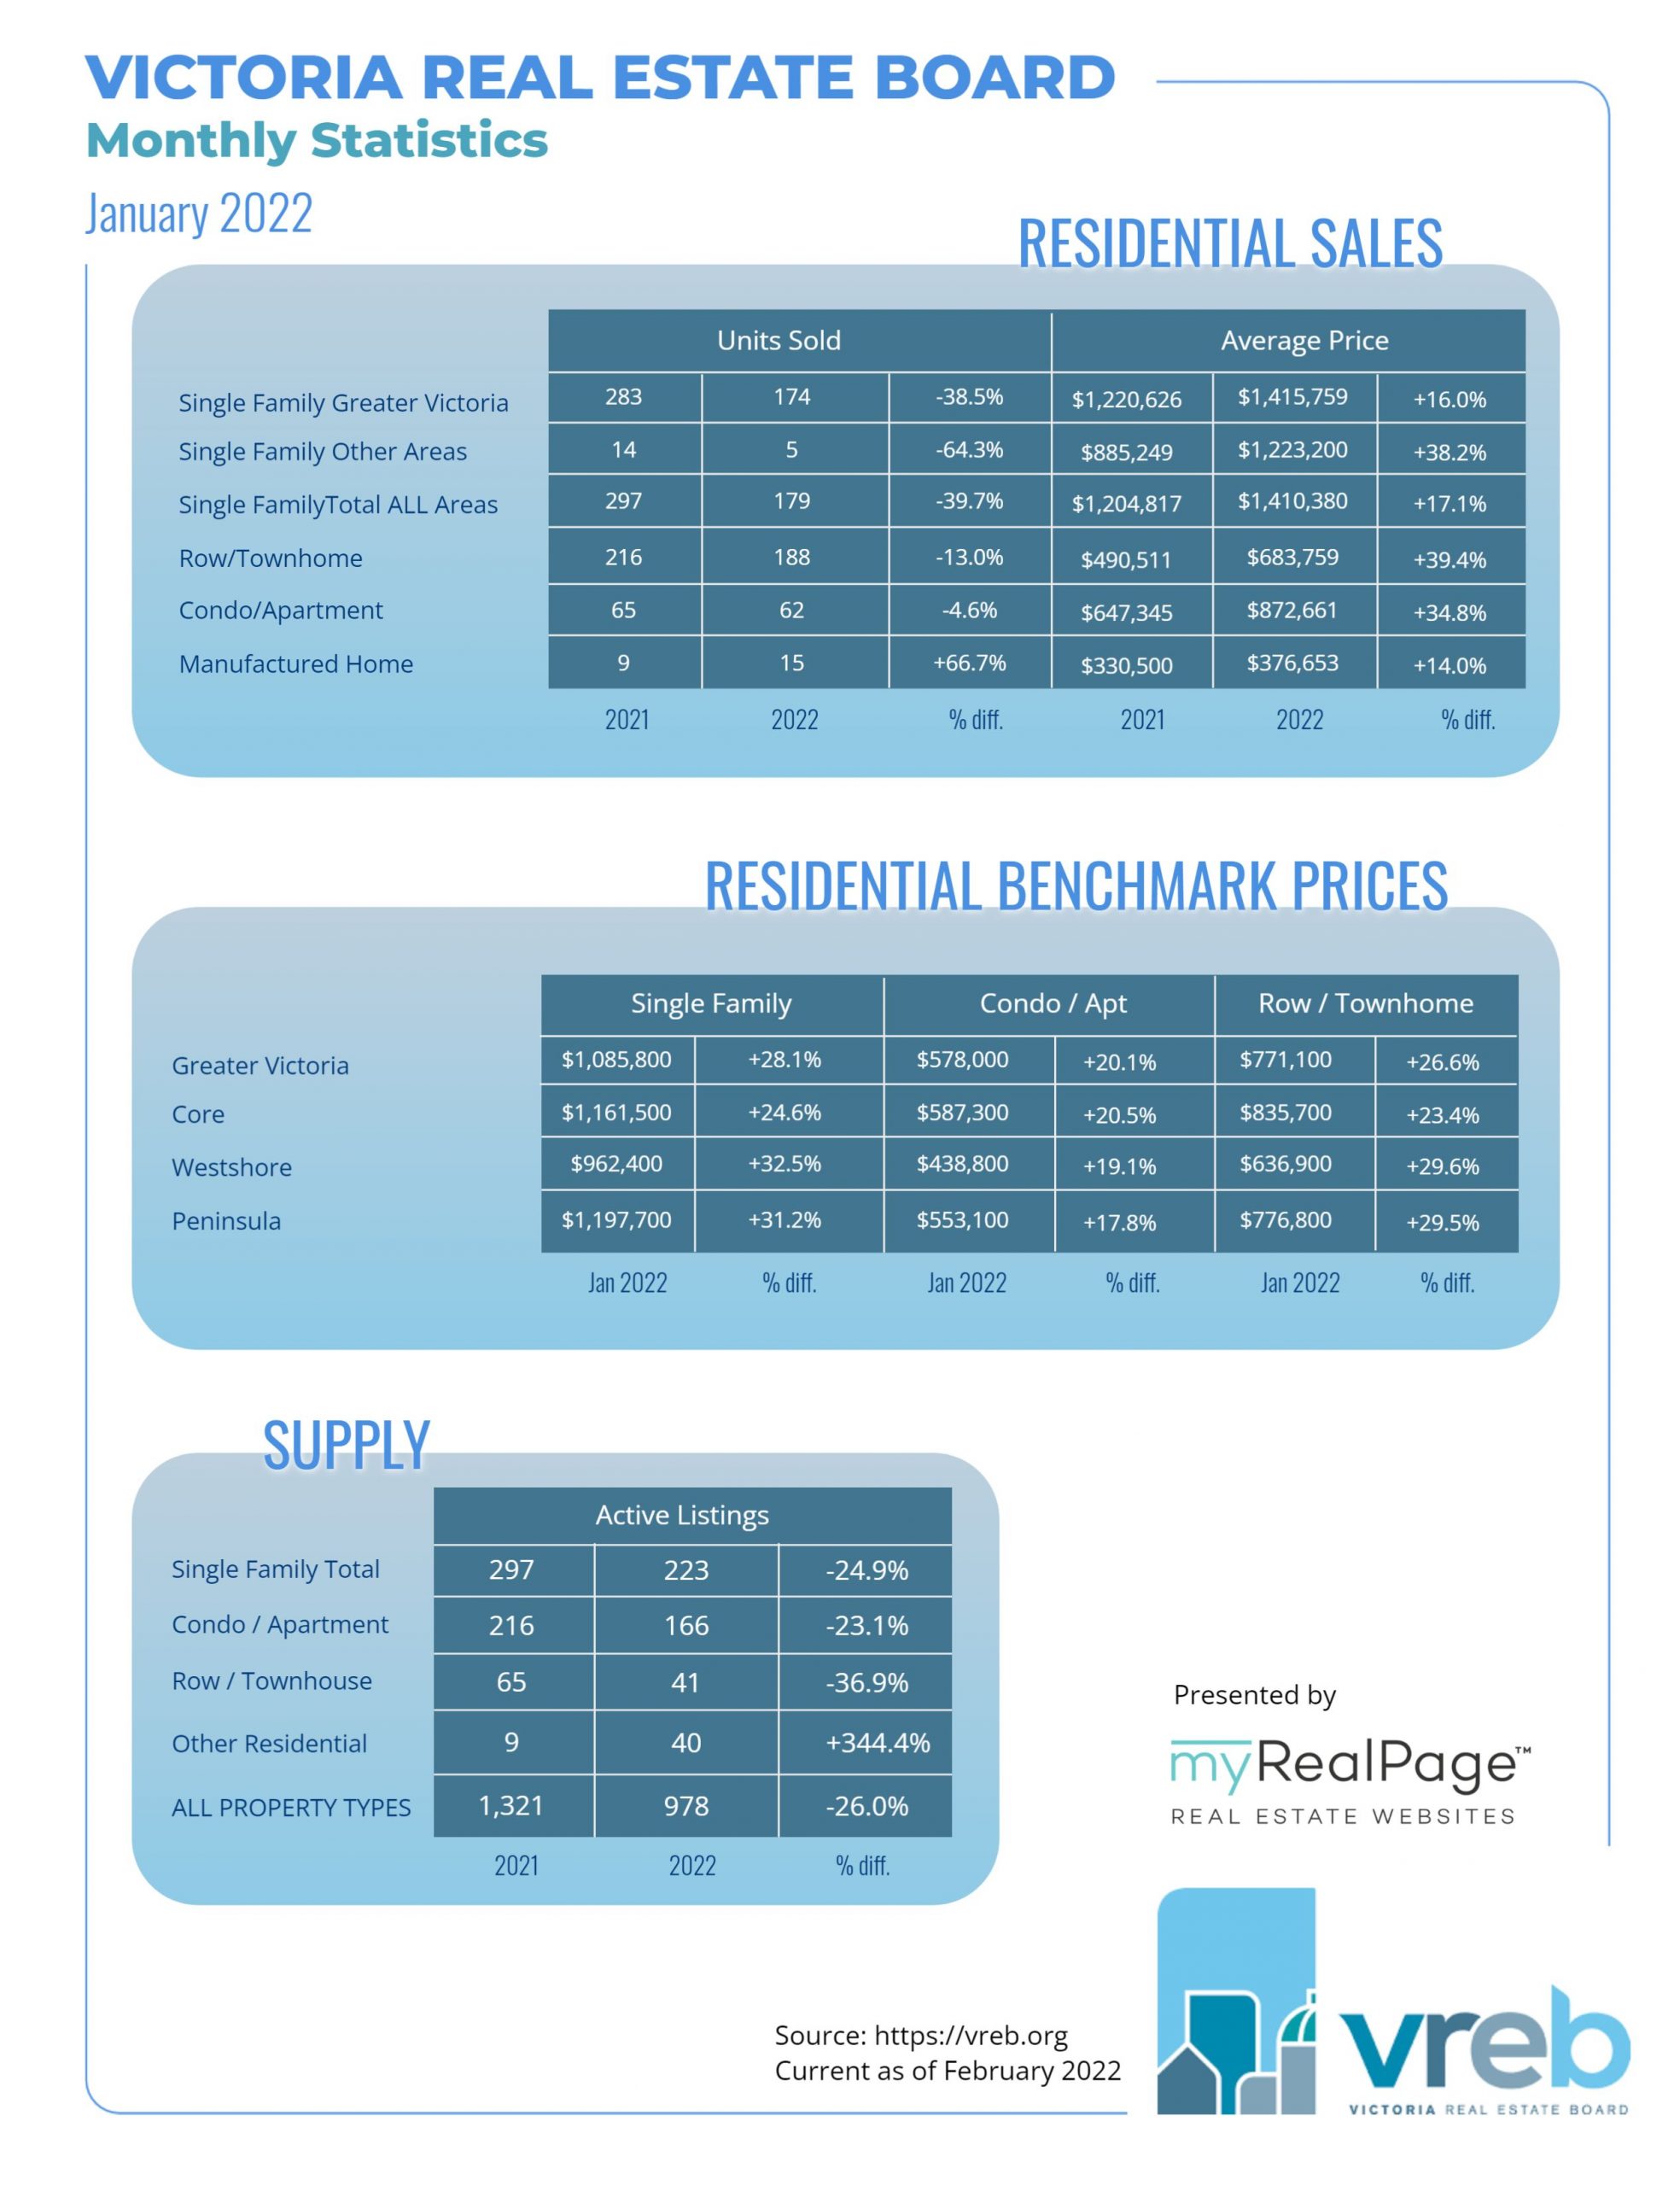
INFOGRAPHICS: January 2022 VREB Victoria Market Reports

Limited inventory continues to be key in Victoria real estate market
A total of 474 properties sold in the Victoria Real Estate Board region this January, 26.6 per cent fewer than the 646 properties sold in January 2021 but an 8.2 per cent increase from December 2021. Sales of condominiums were down 13 per cent from January 2021 with 188 units sold. Sales of single family homes decreased 39.7 per cent from January 2021 with 179 sold.
“A cursory glance at our sales numbers could lead to the quick conclusion that our market is slowing down,” says 2022 Victoria Real Estate Board President Karen Dinnie-Smyth. “But what we must consider is not only the number of homes that have sold, but also the number of homes which were for available for sale within the month. To put our inventory into context, last year broke the record for lowest inventory for the month of January. This January broke that record nearly in half and that lack of supply in the market really impacts what our end sales numbers are. Had we seen more homes for sale, it’s likely our result would have been many more sales.”
There were 744 active listings for sale on the Victoria Real Estate Board Multiple Listing Service® at the end of January 2022, an increase of 14.1 per cent compared to the previous month of December and a 43.7 per cent decrease from the 1,321 active listings for sale at the end of January 2021.
Read the full report on VREB website!
The following data is a comparison between January 2022 and January 2021 numbers, and is current as of February 2022. Click here to check out last month’s figures!
You can also follow this link for all our Victoria Board monthly infographics!
Click on the images for a larger view!
Download Printable Version – December 2021 VREB, Victoria Market Report

Last Updated on July 25, 2022 by myRealPage


