INFOGRAPHICS: May 2023 VREB Victoria Market Reports

Spring market begins to grow just in time for summer
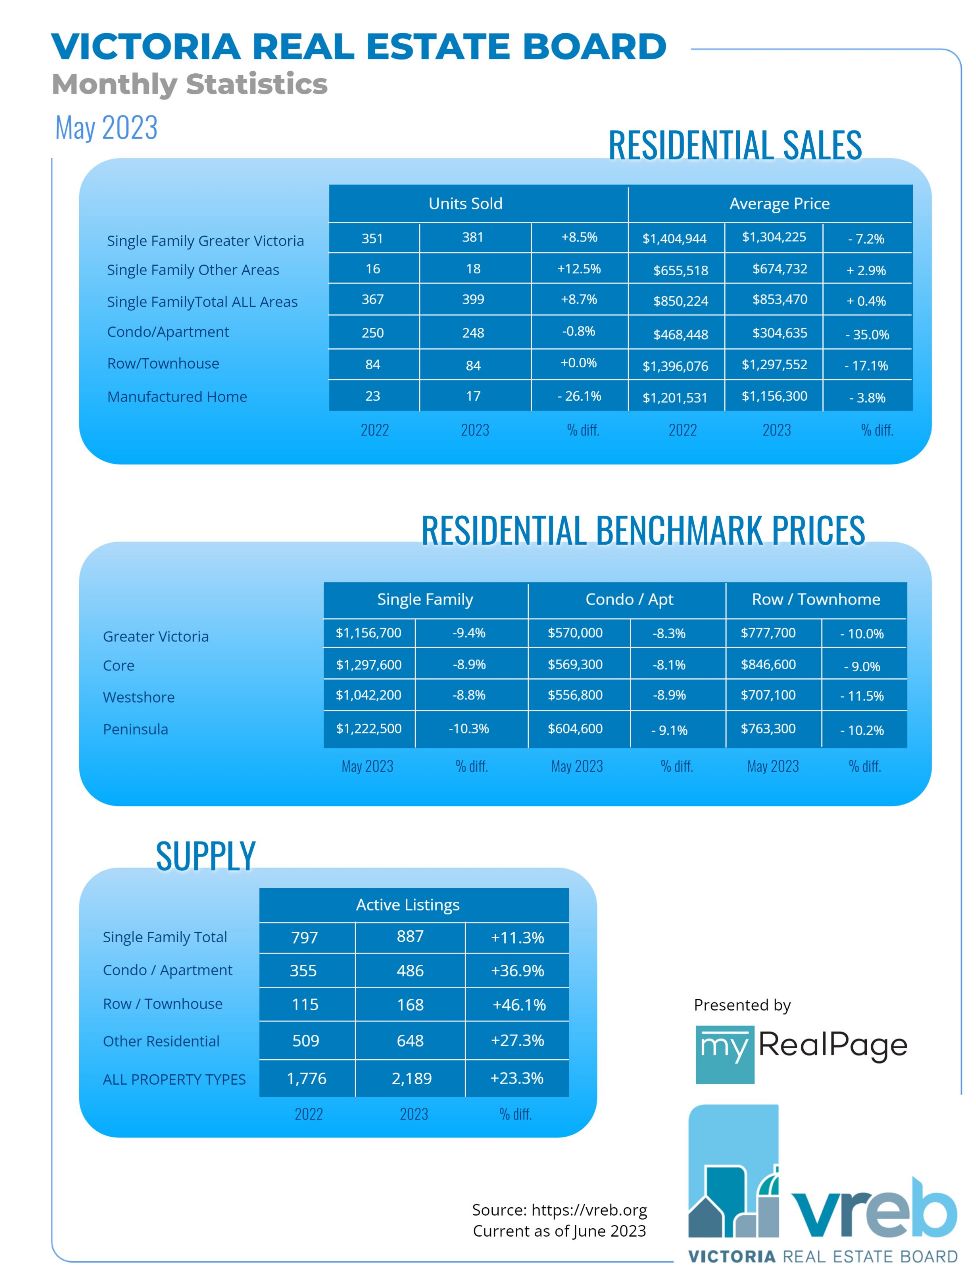
A total of 775 properties sold in the Victoria Real Estate Board region this May, 1.8 per cent more than the 761 properties sold in May 2022 and a 21.7 per cent increase from April 2023. Sales of condominiums were down 0.8 per cent from May 2022 with 248 units sold. Sales of single family homes increased 8.7 per cent from May 2022 with 399 sold.
“The month of May marks the highest number of sales we’ve seen since April of last year,” said Victoria Real Estate Board Chair Graden Sol. “While we haven’t seen the number of total sales we would expect in a spring market, the month of May marks the fourth consecutive month with sales higher than the month previous. With momentum building, there’s an indication of consumer optimism in the market heading into June. However, if the ongoing lack of homes for sale persists and inventory is not added, we risk a return to an overheated market with pressure on pricing.”
There were 2,189 active listings for sale on the Victoria Real Estate Board Multiple Listing Service® at the end of May 2023, an increase of 7.1 per cent compared to the previous month of April and a 23.3 per cent increase from the 1,776 active listings for sale at the end of May 2022.
Read the full report on VREB website!
The following data is a comparison between May 2023 and May 2022 numbers, and is current as of April 2023. Click here to check out last month’s figures!
You can also follow this link for all our Victoria Board monthly infographics!
Click on the images for a larger view!
Download Printable Version – May 2023 VREB, Victoria Market Report

Last Updated on November 28, 2023 by myRealPage


