INFOGRAPHICS: July 2024 TRREB Toronto Market Reports

GTA REALTORS® Release July Stats
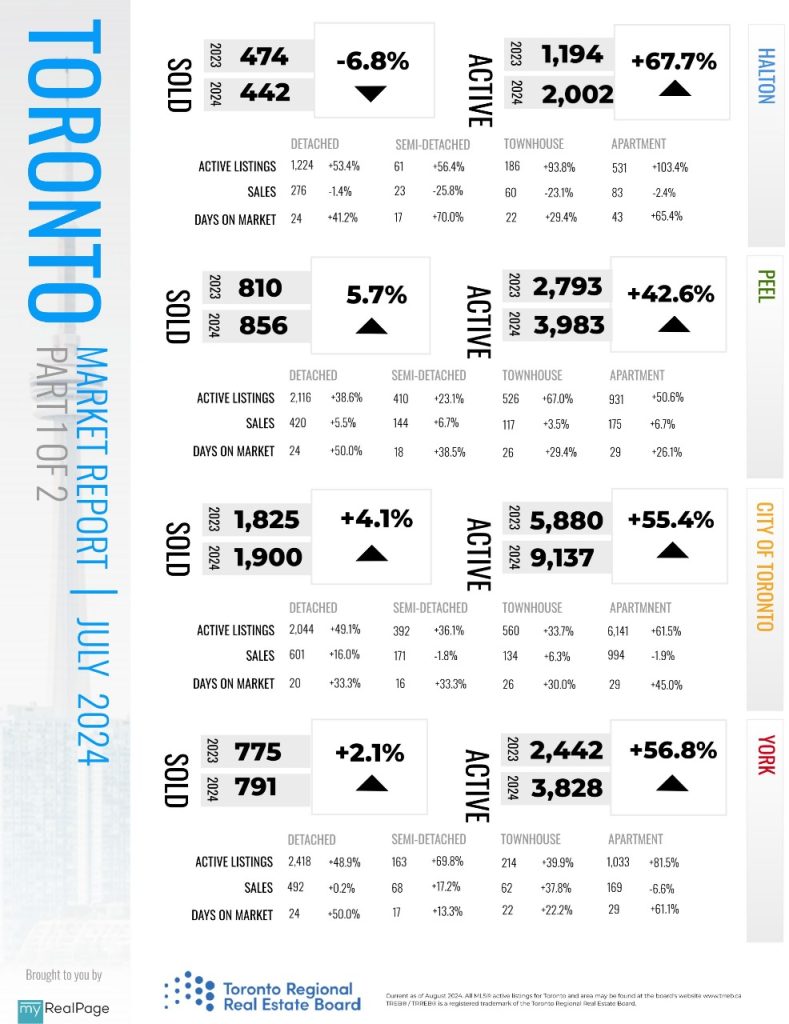
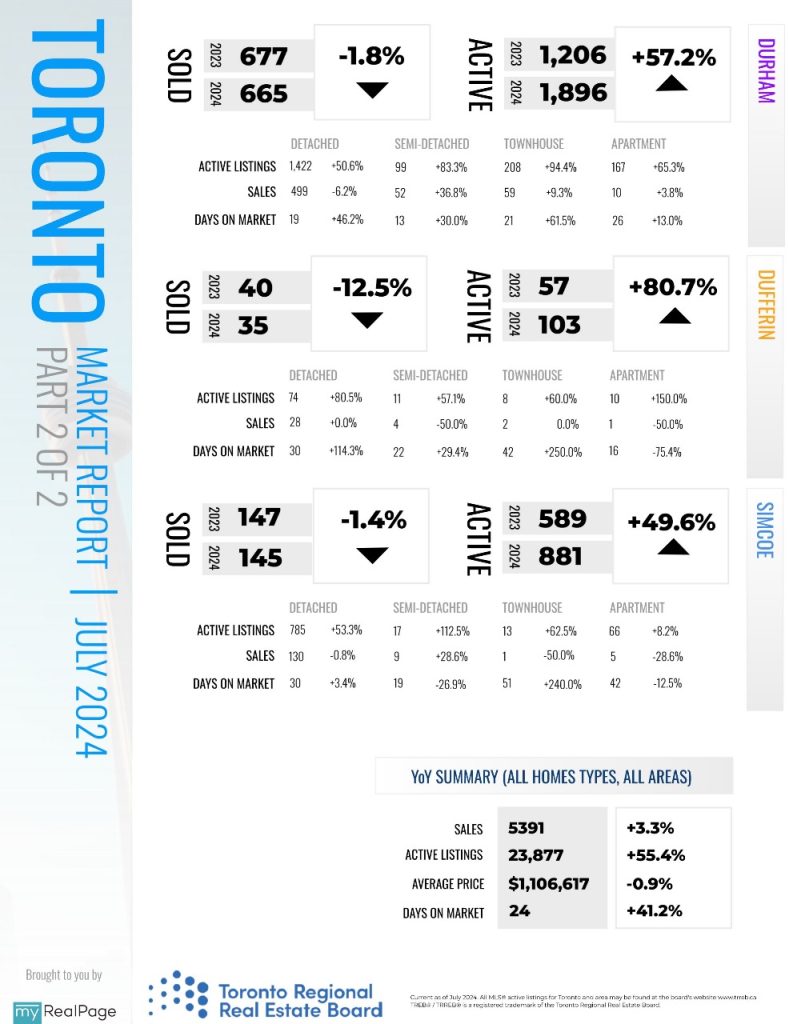
Greater Toronto Area (GTA) home sales in July 2024 were up compared to July 2023. While sales were up from last year, buyers continued to benefit from more choice in the GTA marketplace, with annual growth in new listings outstripping that of sales. The better-supplied market meant that buyers also benefitted from a slight relief in selling prices on average.
“It was encouraging to see an uptick in July sales relative to last year. We may be starting to see a positive impact from the two Bank of Canada rate cuts announced in June and July. Additionally, the cost of borrowing is anticipated to decline further in the coming months. Expect sales to accelerate as buyers benefit from lower monthly mortgage payments,” said TRREB President Jennifer Pearce.
GTA REALTORS® reported 5,391 home sales through TRREB’s MLS® System in July 2024 – a 3.3 per cent increase compared to 5,220 sales reported in July 2023. New listings entered into the MLS® System amounted to 16,296 – up by 18.5 per cent year-over-year. On a seasonally adjusted basis, July sales and new listings edged lower compared to June
Read the full report on TRREB website!
The following data is a comparison between July 2024 and July 2023 numbers, and is current as of August 2024. For last month’s numbers, check out our previous infographic!
Or follow this link for all our TREB / TRREB Infographics!
Download Printable Version – July 2024 TRREB, Toronto Market Report
Last Updated on August 9, 2024 by myRealPage


