INFOGRAPHICS: January 2025 CREB City And Region Market Reports

Supply levels improve in January
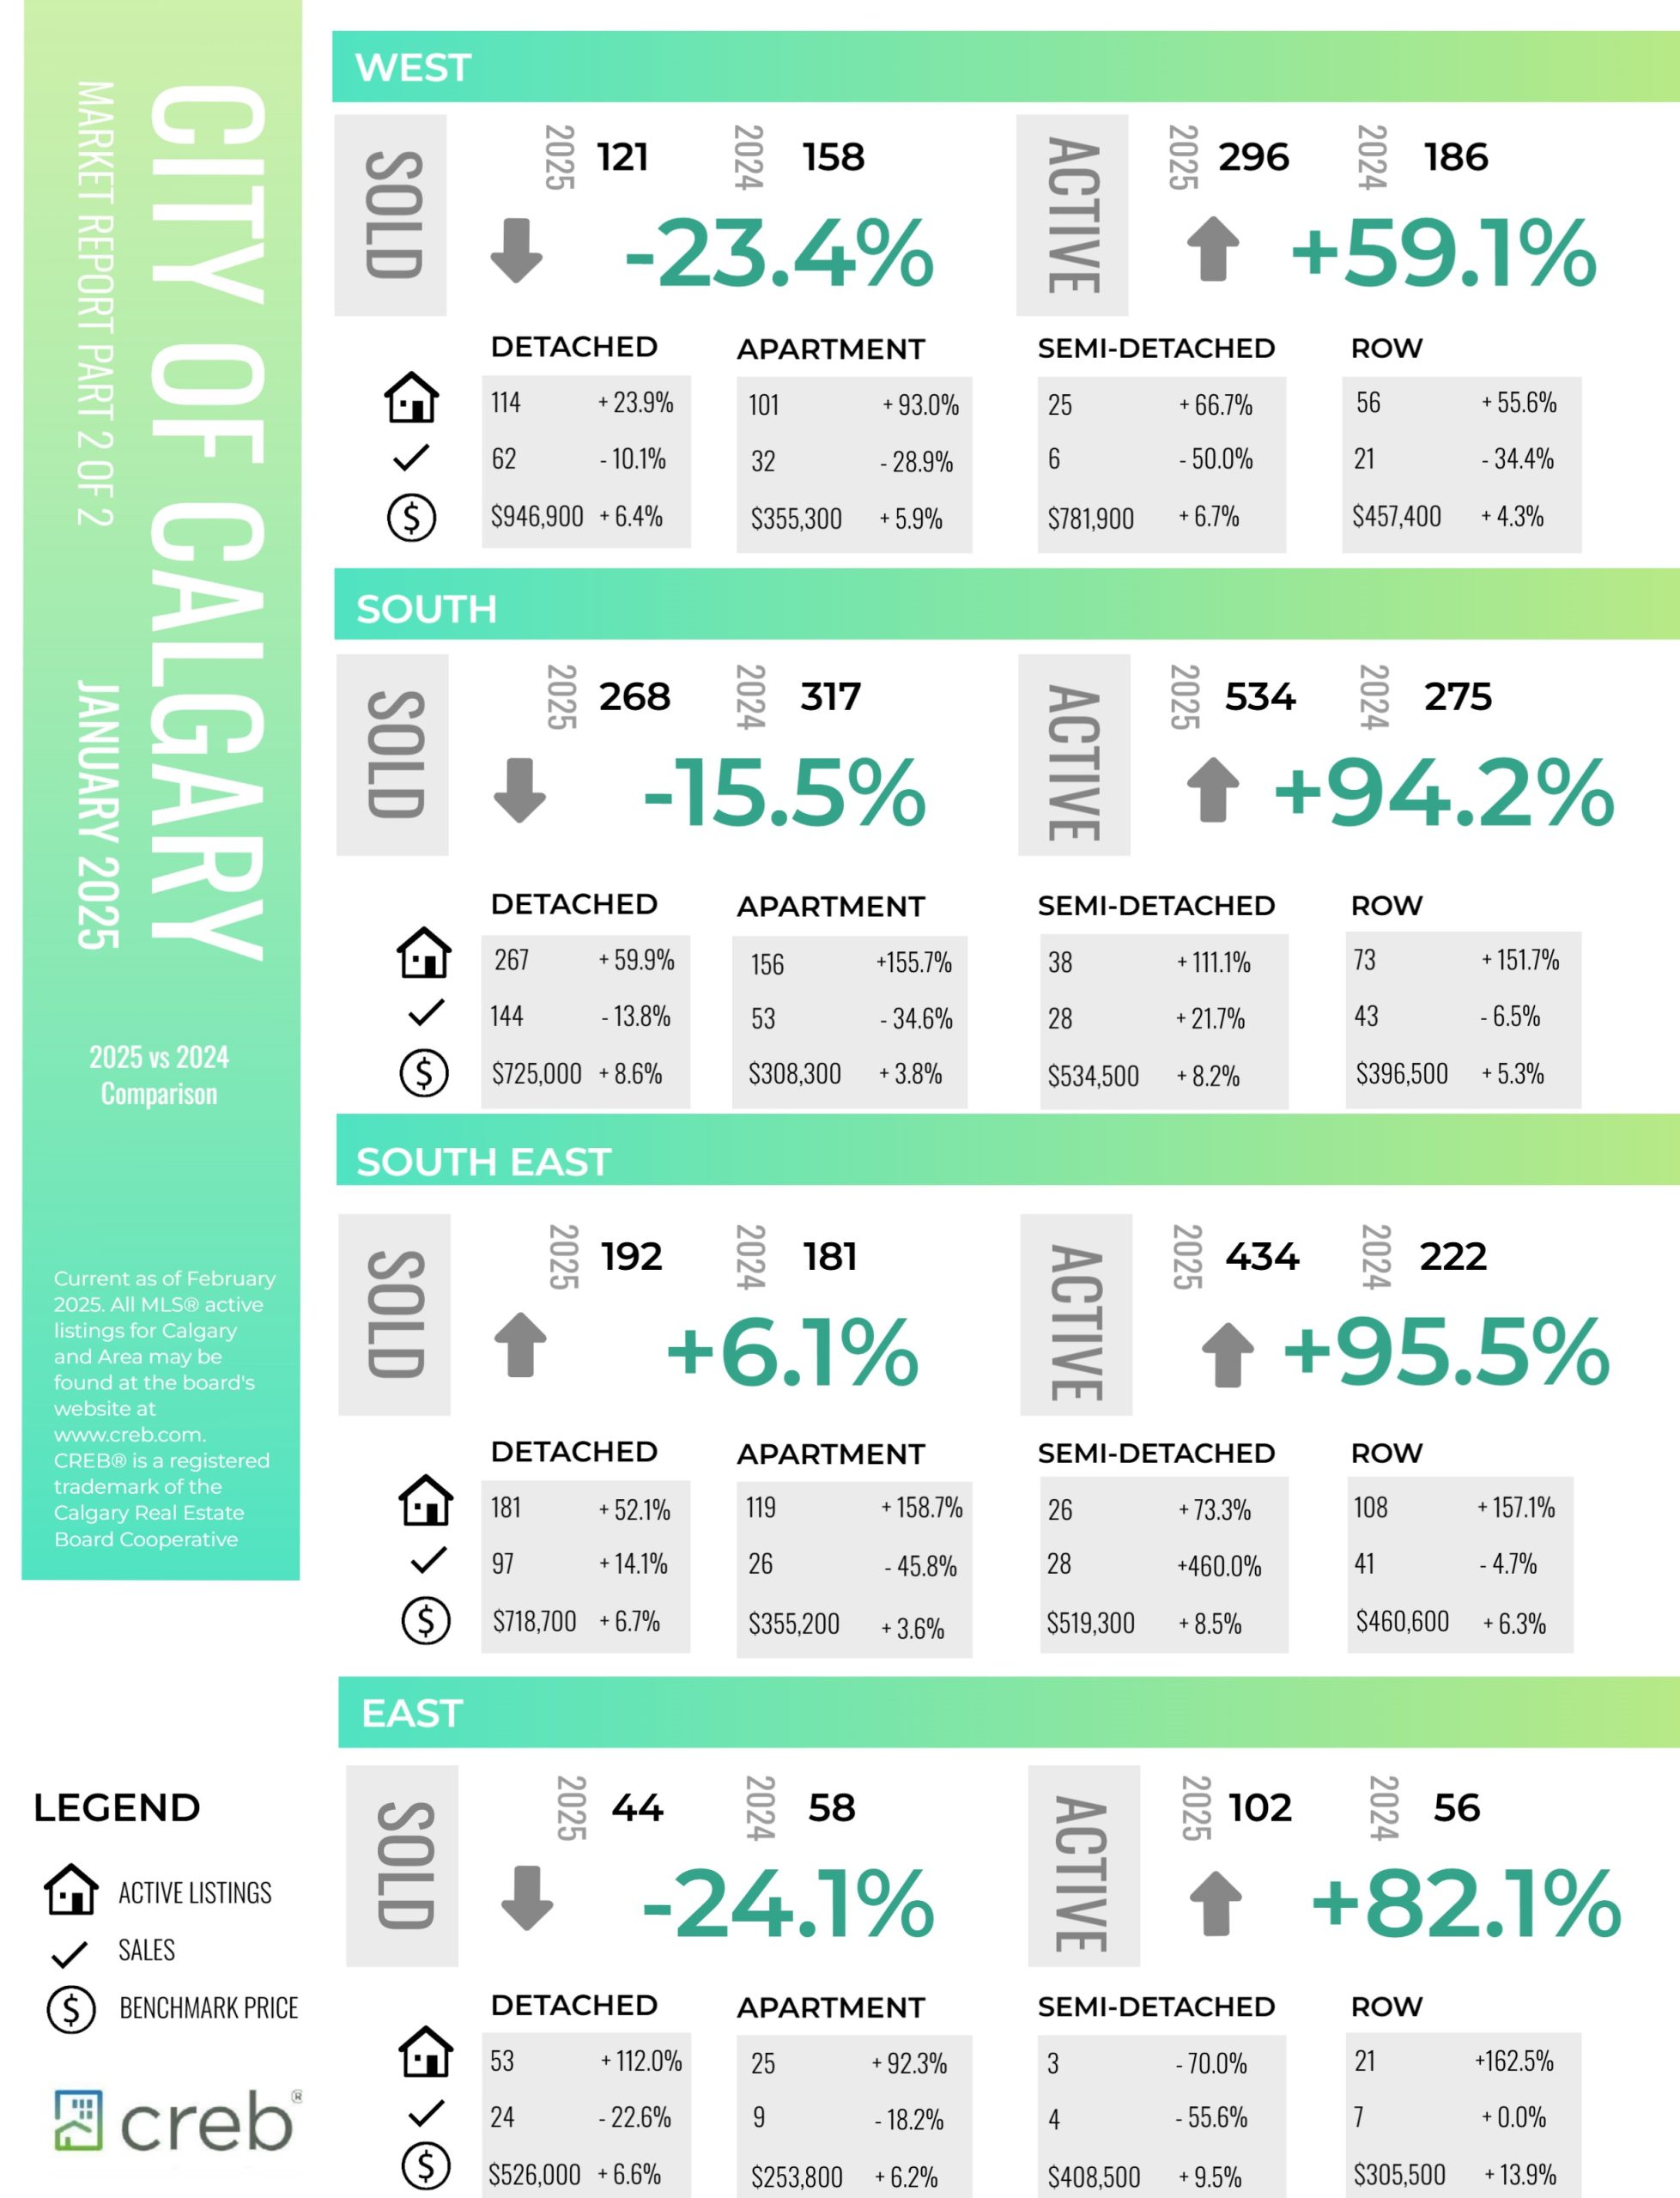
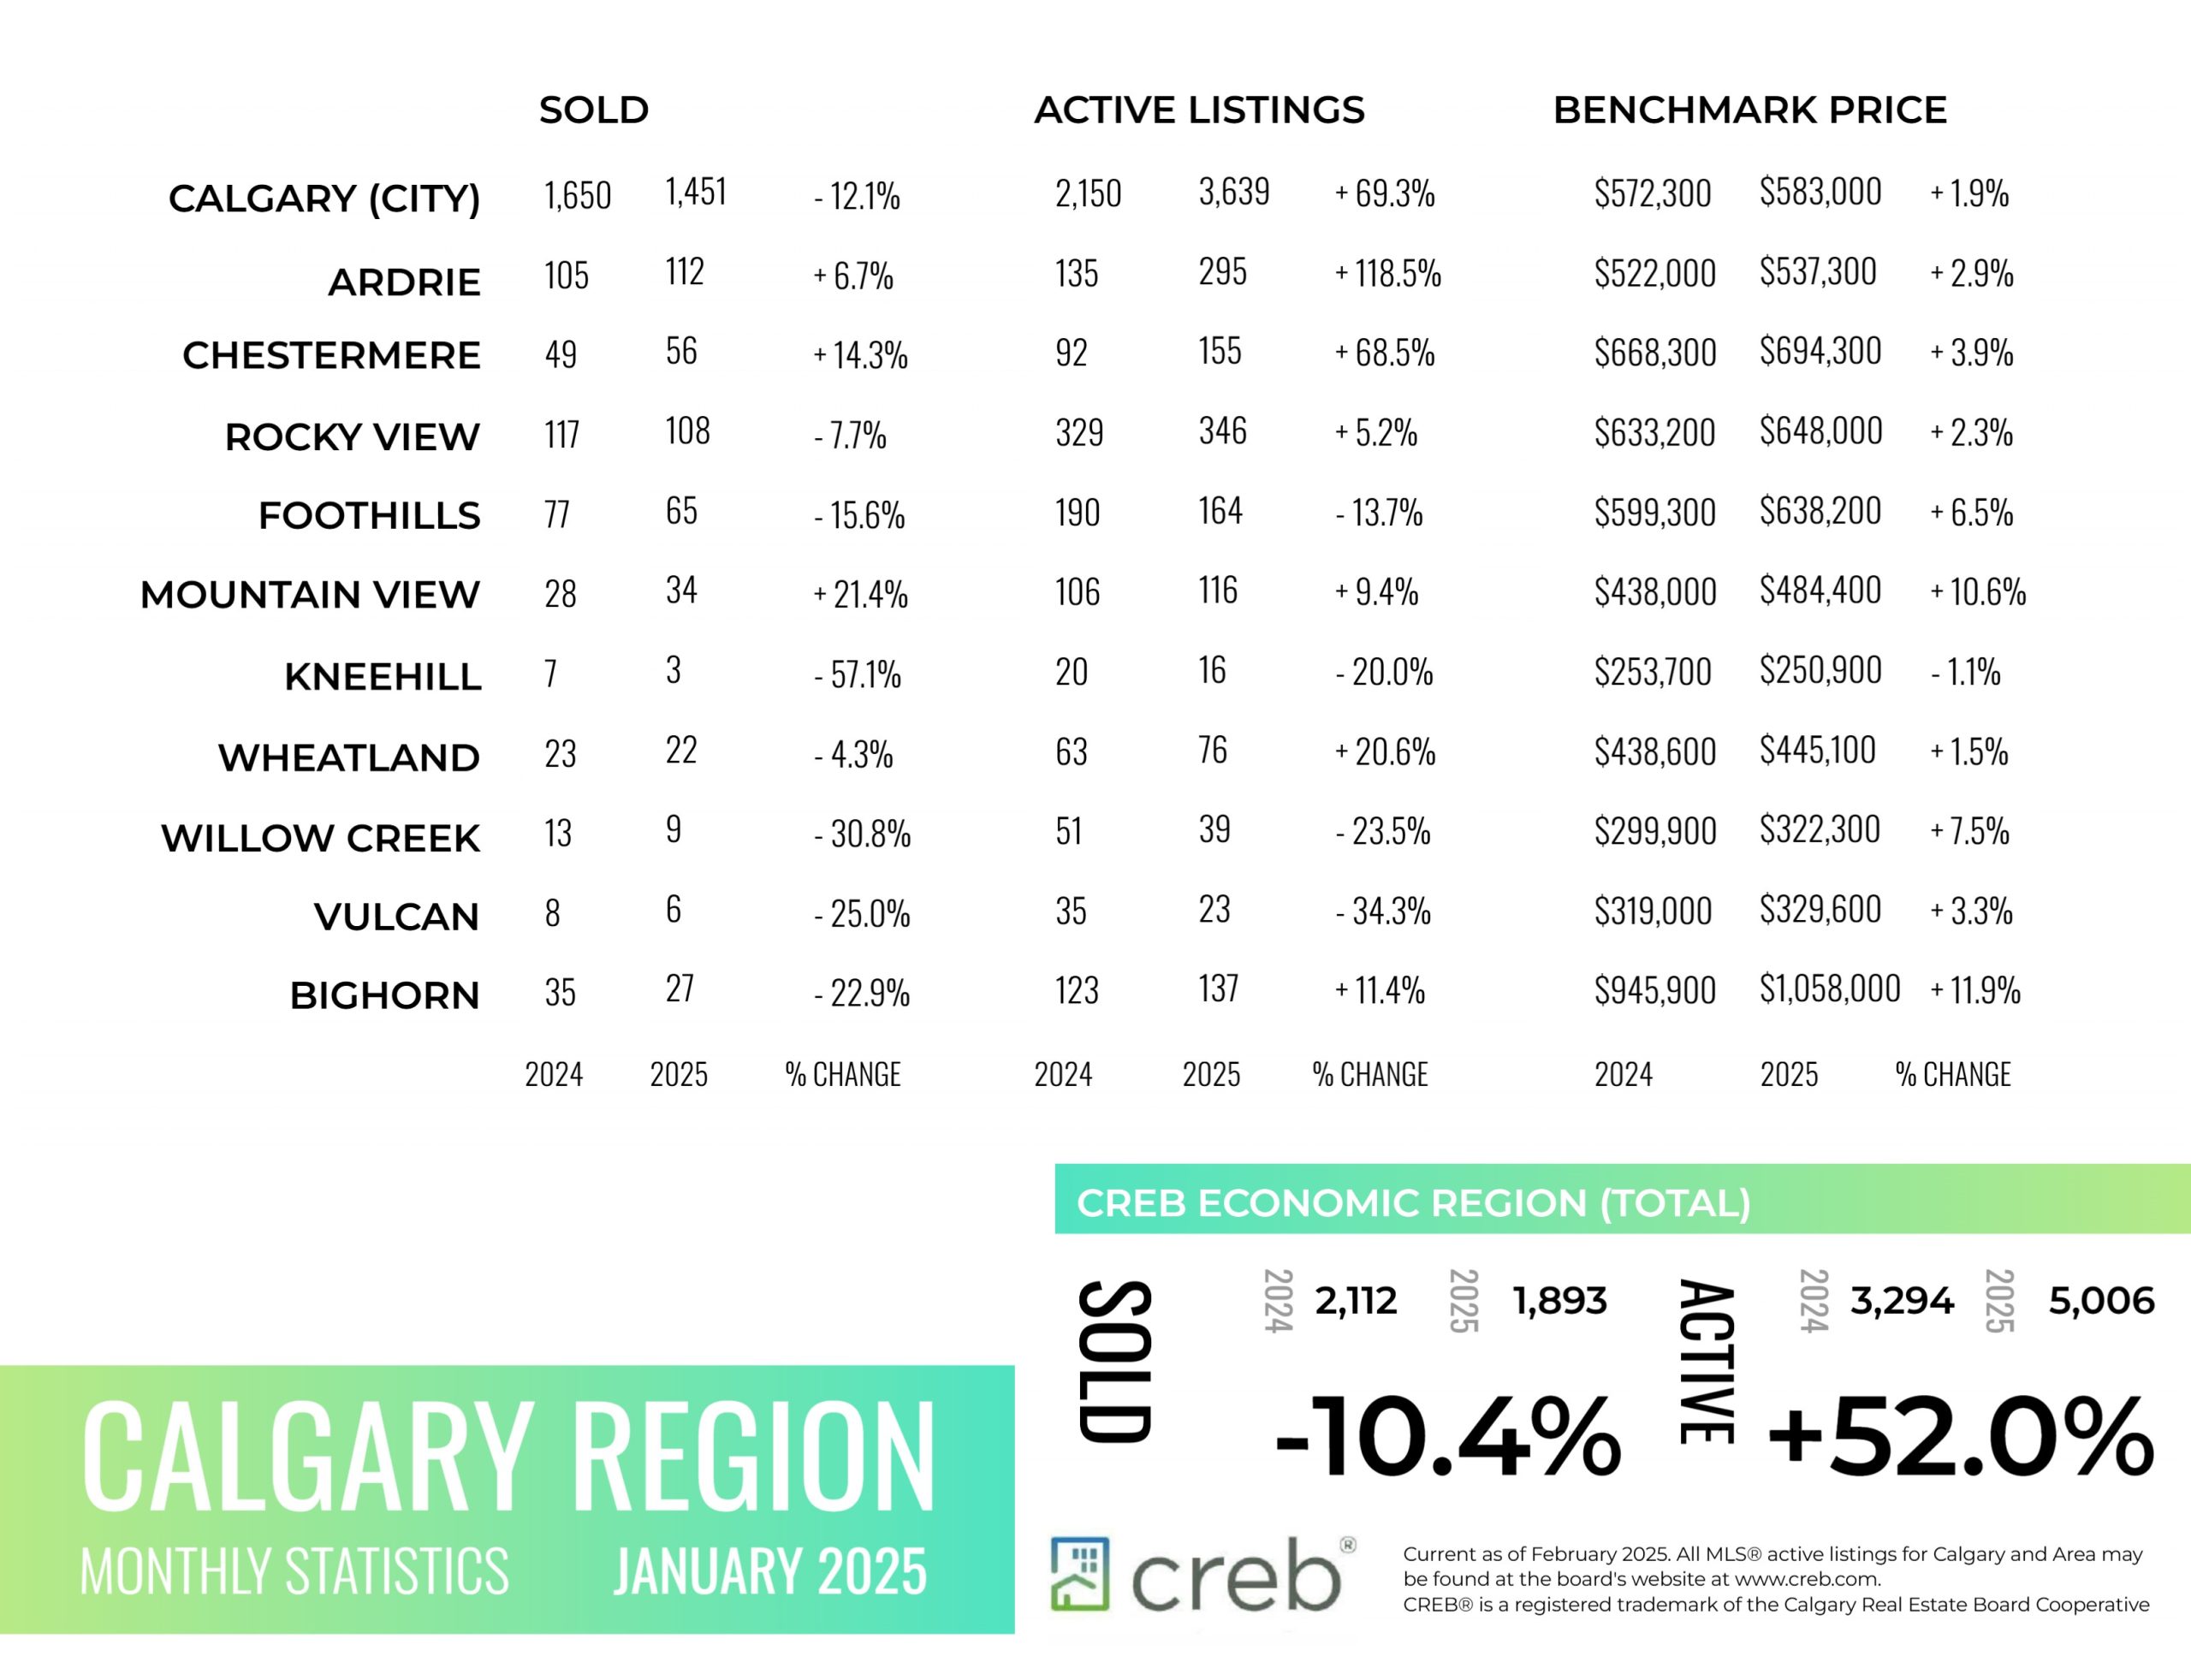
Following three consecutive years of limited supply choice, inventory levels in January rose to 3,639 units. While the 70 per cent year-over-year gain is significant, inventory levels remain lower than the over 4,000 units we would typically see in January. Inventories rose across all property types, with some of the largest gains driven by apartment-style condominiums.
“Supply levels are expected to improve this year, contributing to more balanced conditions and slower price growth,” said Ann-Marie Lurie, Chief Economist at CREB®. “However, the adjustment in supply is not equal amongst all property types. Compared with sales, we continue to see persistently tight conditions for detached, semi-detached and row properties while apartment condominiums show signs of excess supply for higher priced units.”
Read the full report on the CREB website!
The following data is a comparison between January 2025 and January 2024 numbers, and is current as of February of 2025. For last month’s numbers, check out our previous infographic.
Or follow this link for all our CREB Infographics!
Click on the images for a larger view!
Download Printable Version – January 2025 CREB, City of Calgary Report Pages 1 and 2
Download Printable Version – January 2025 CREB, Calgary Region Report

Last Updated on February 4, 2025 by myRealPage
