INFOGRAPHICS: April 2025 CREB City And Region Market Reports

Balanced conditions take pressure off prices
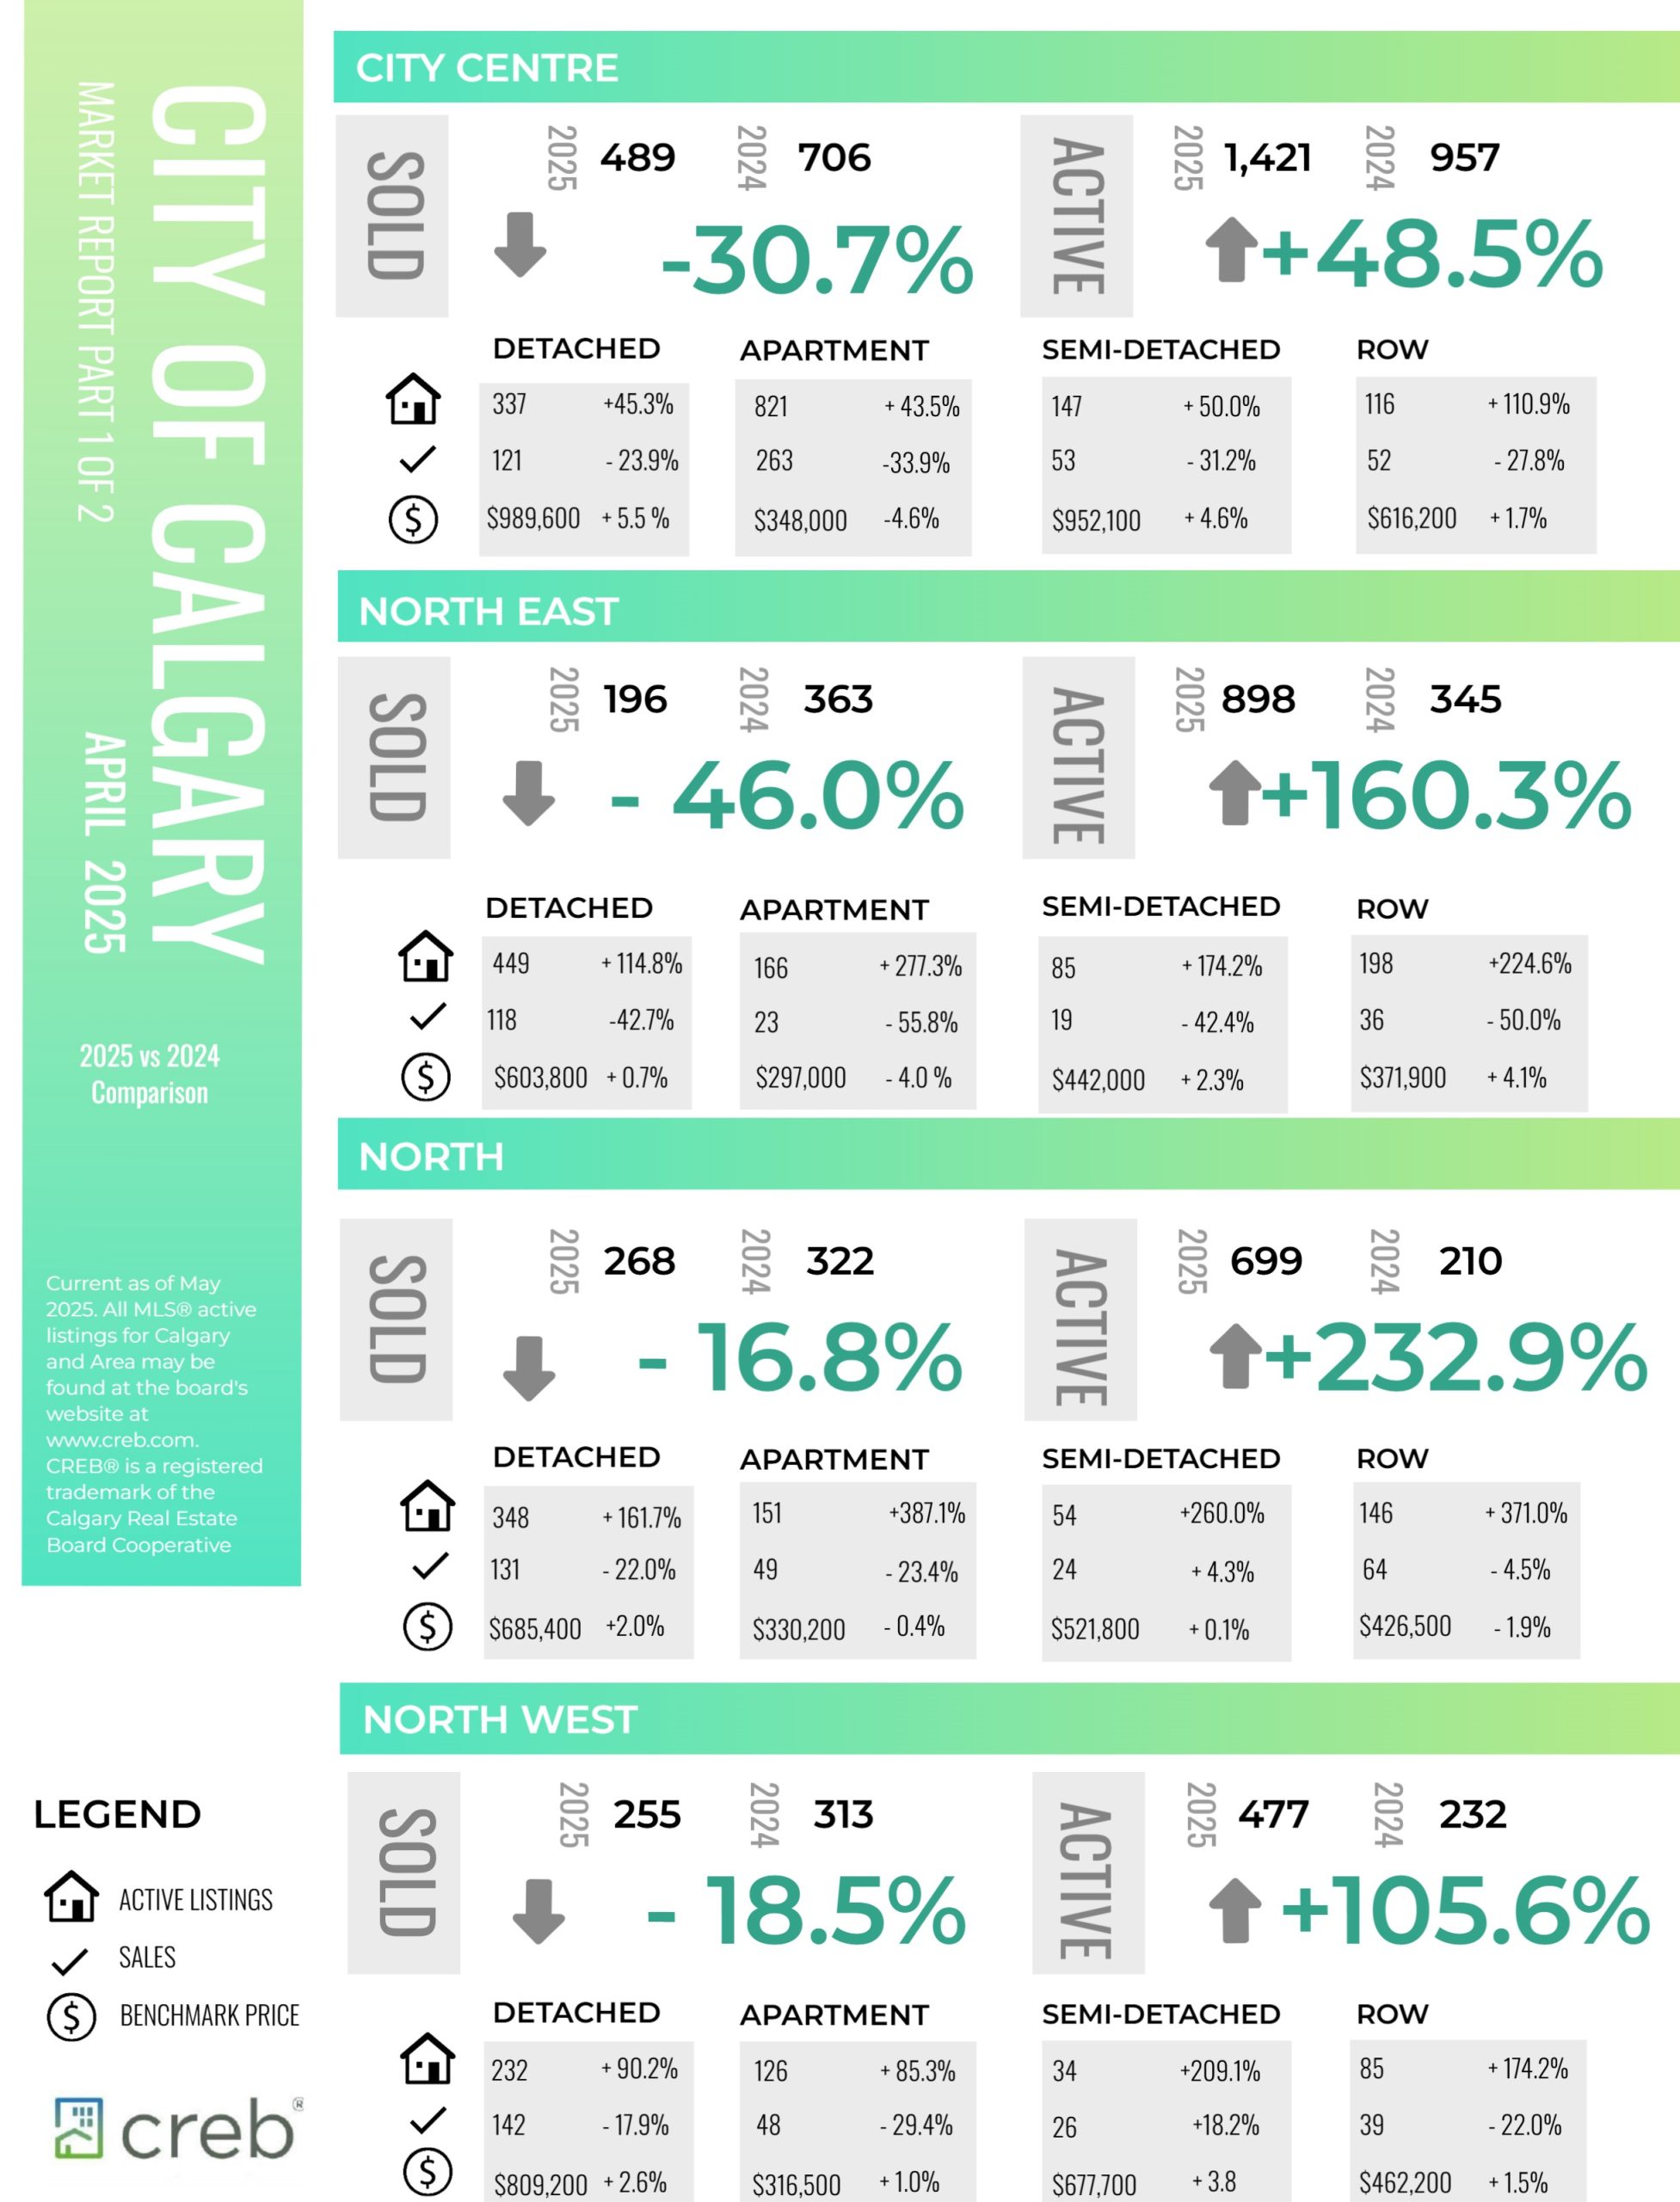
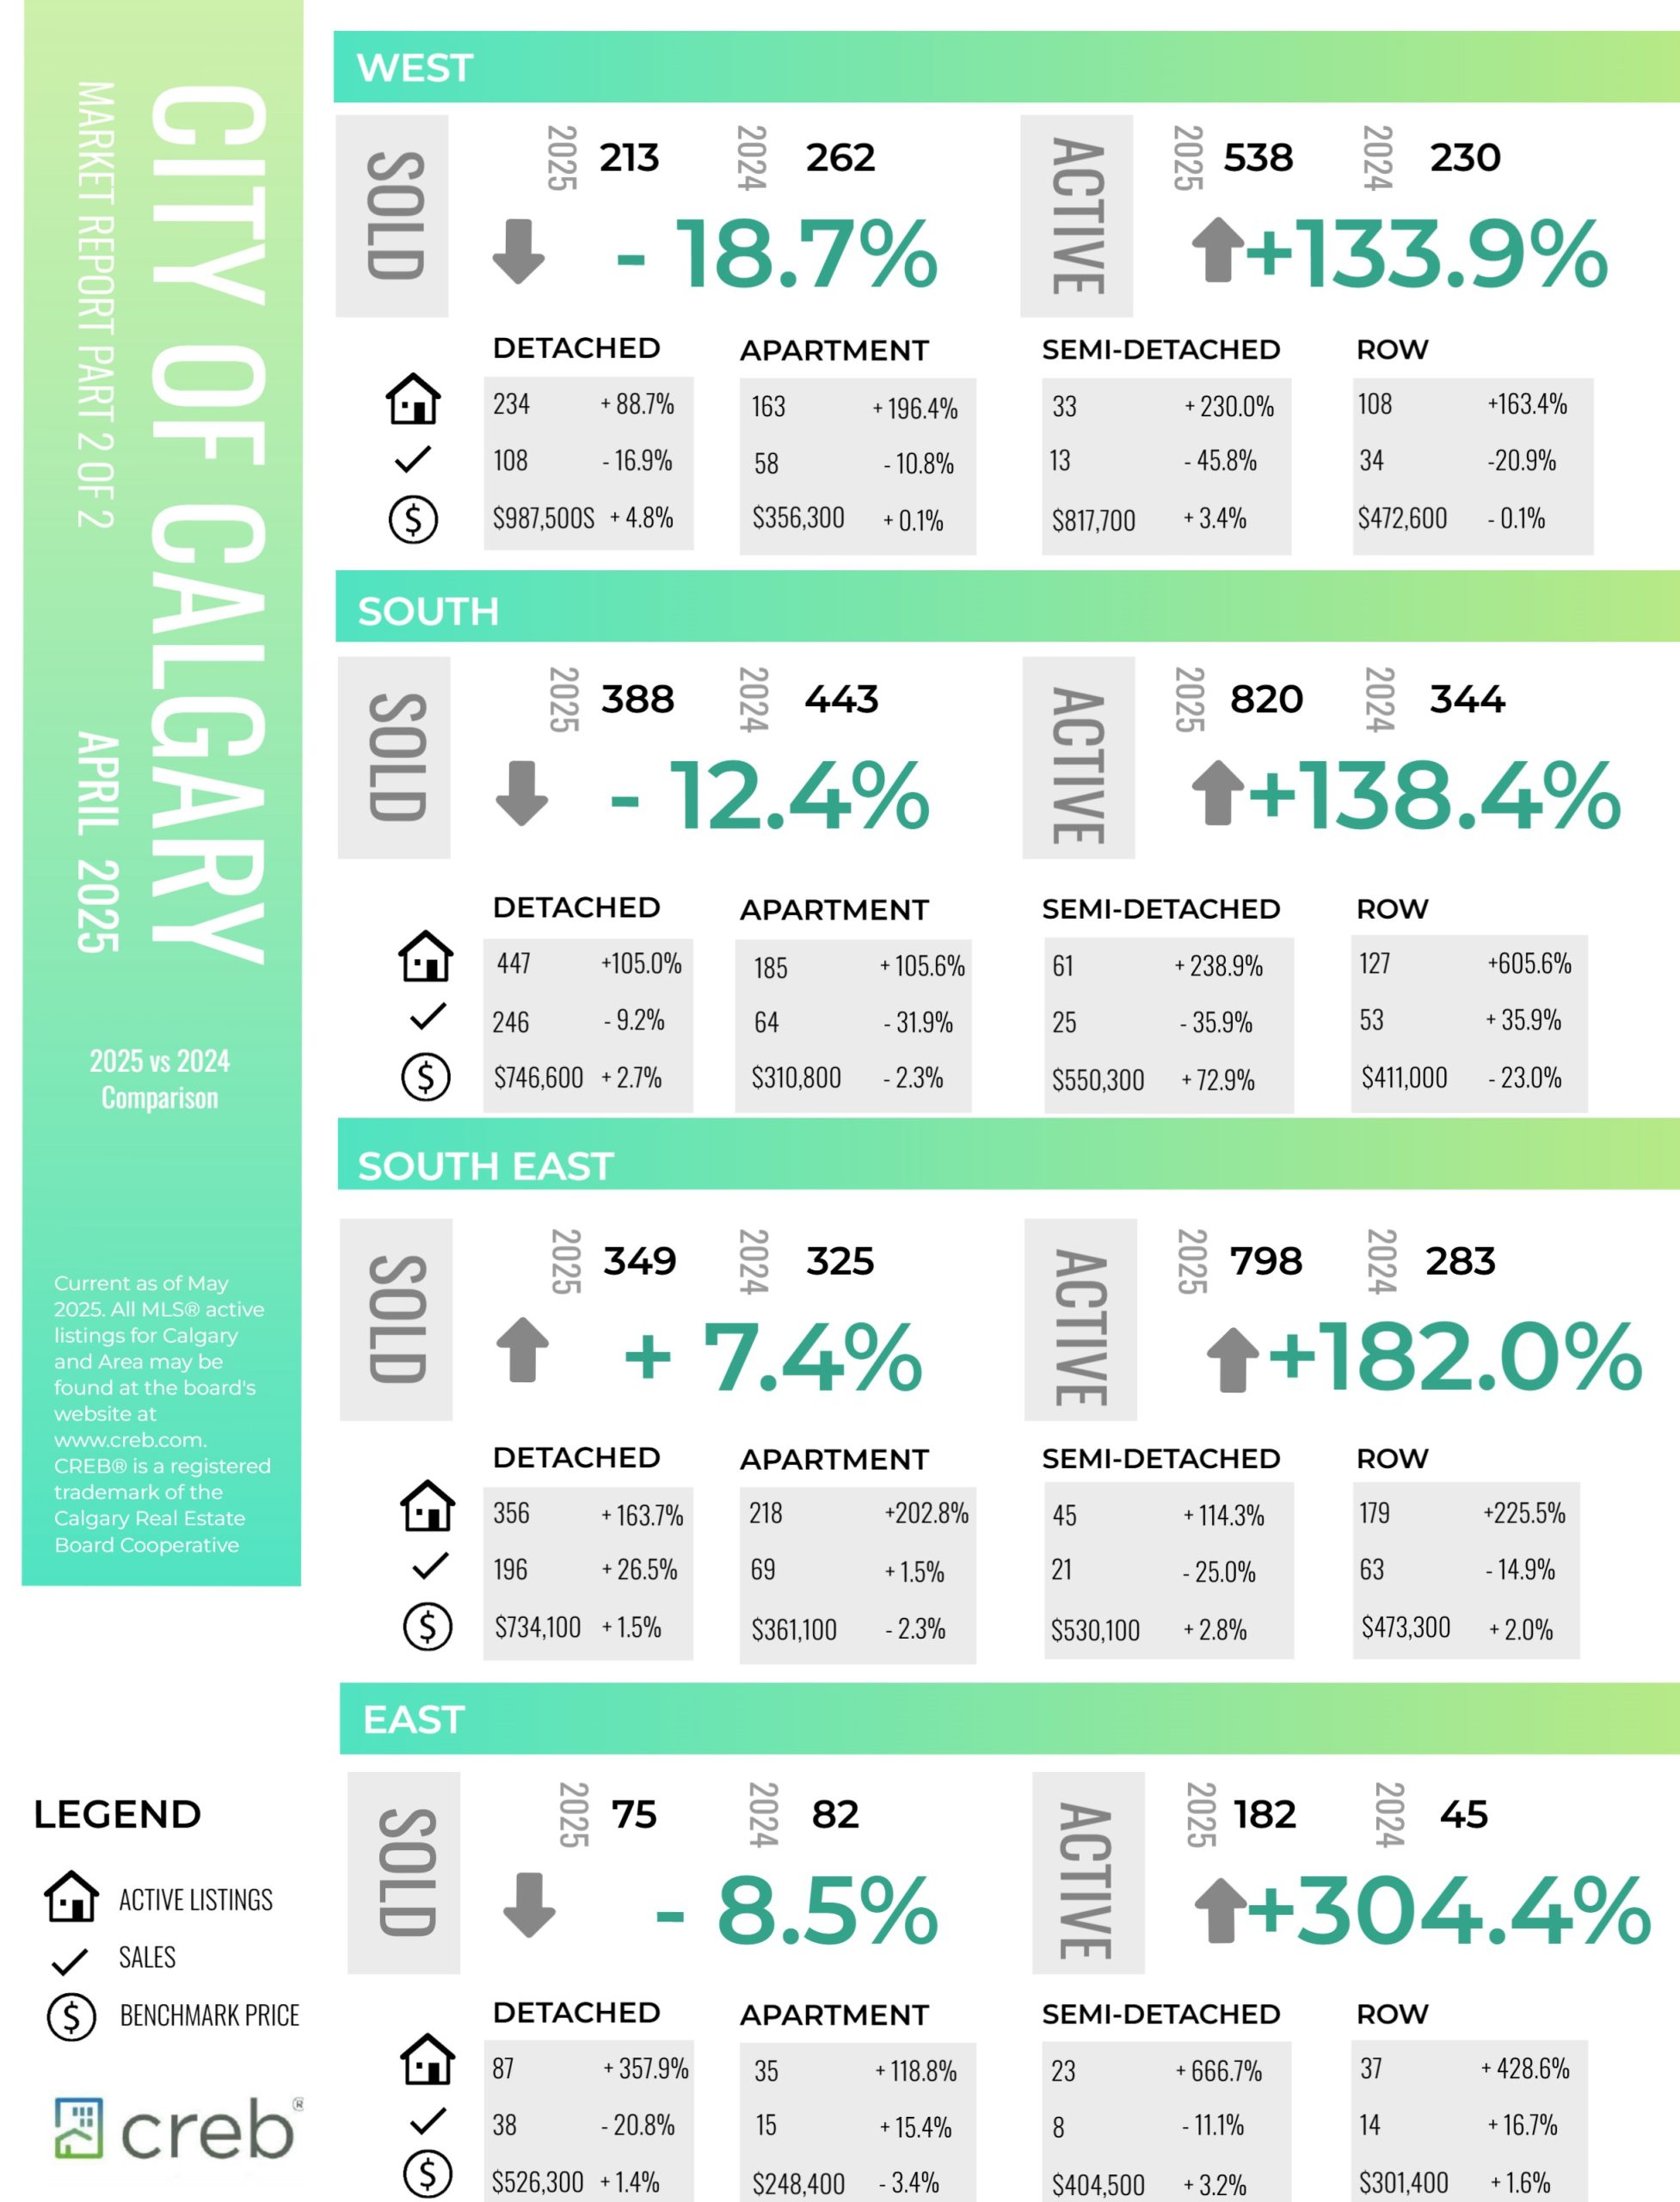
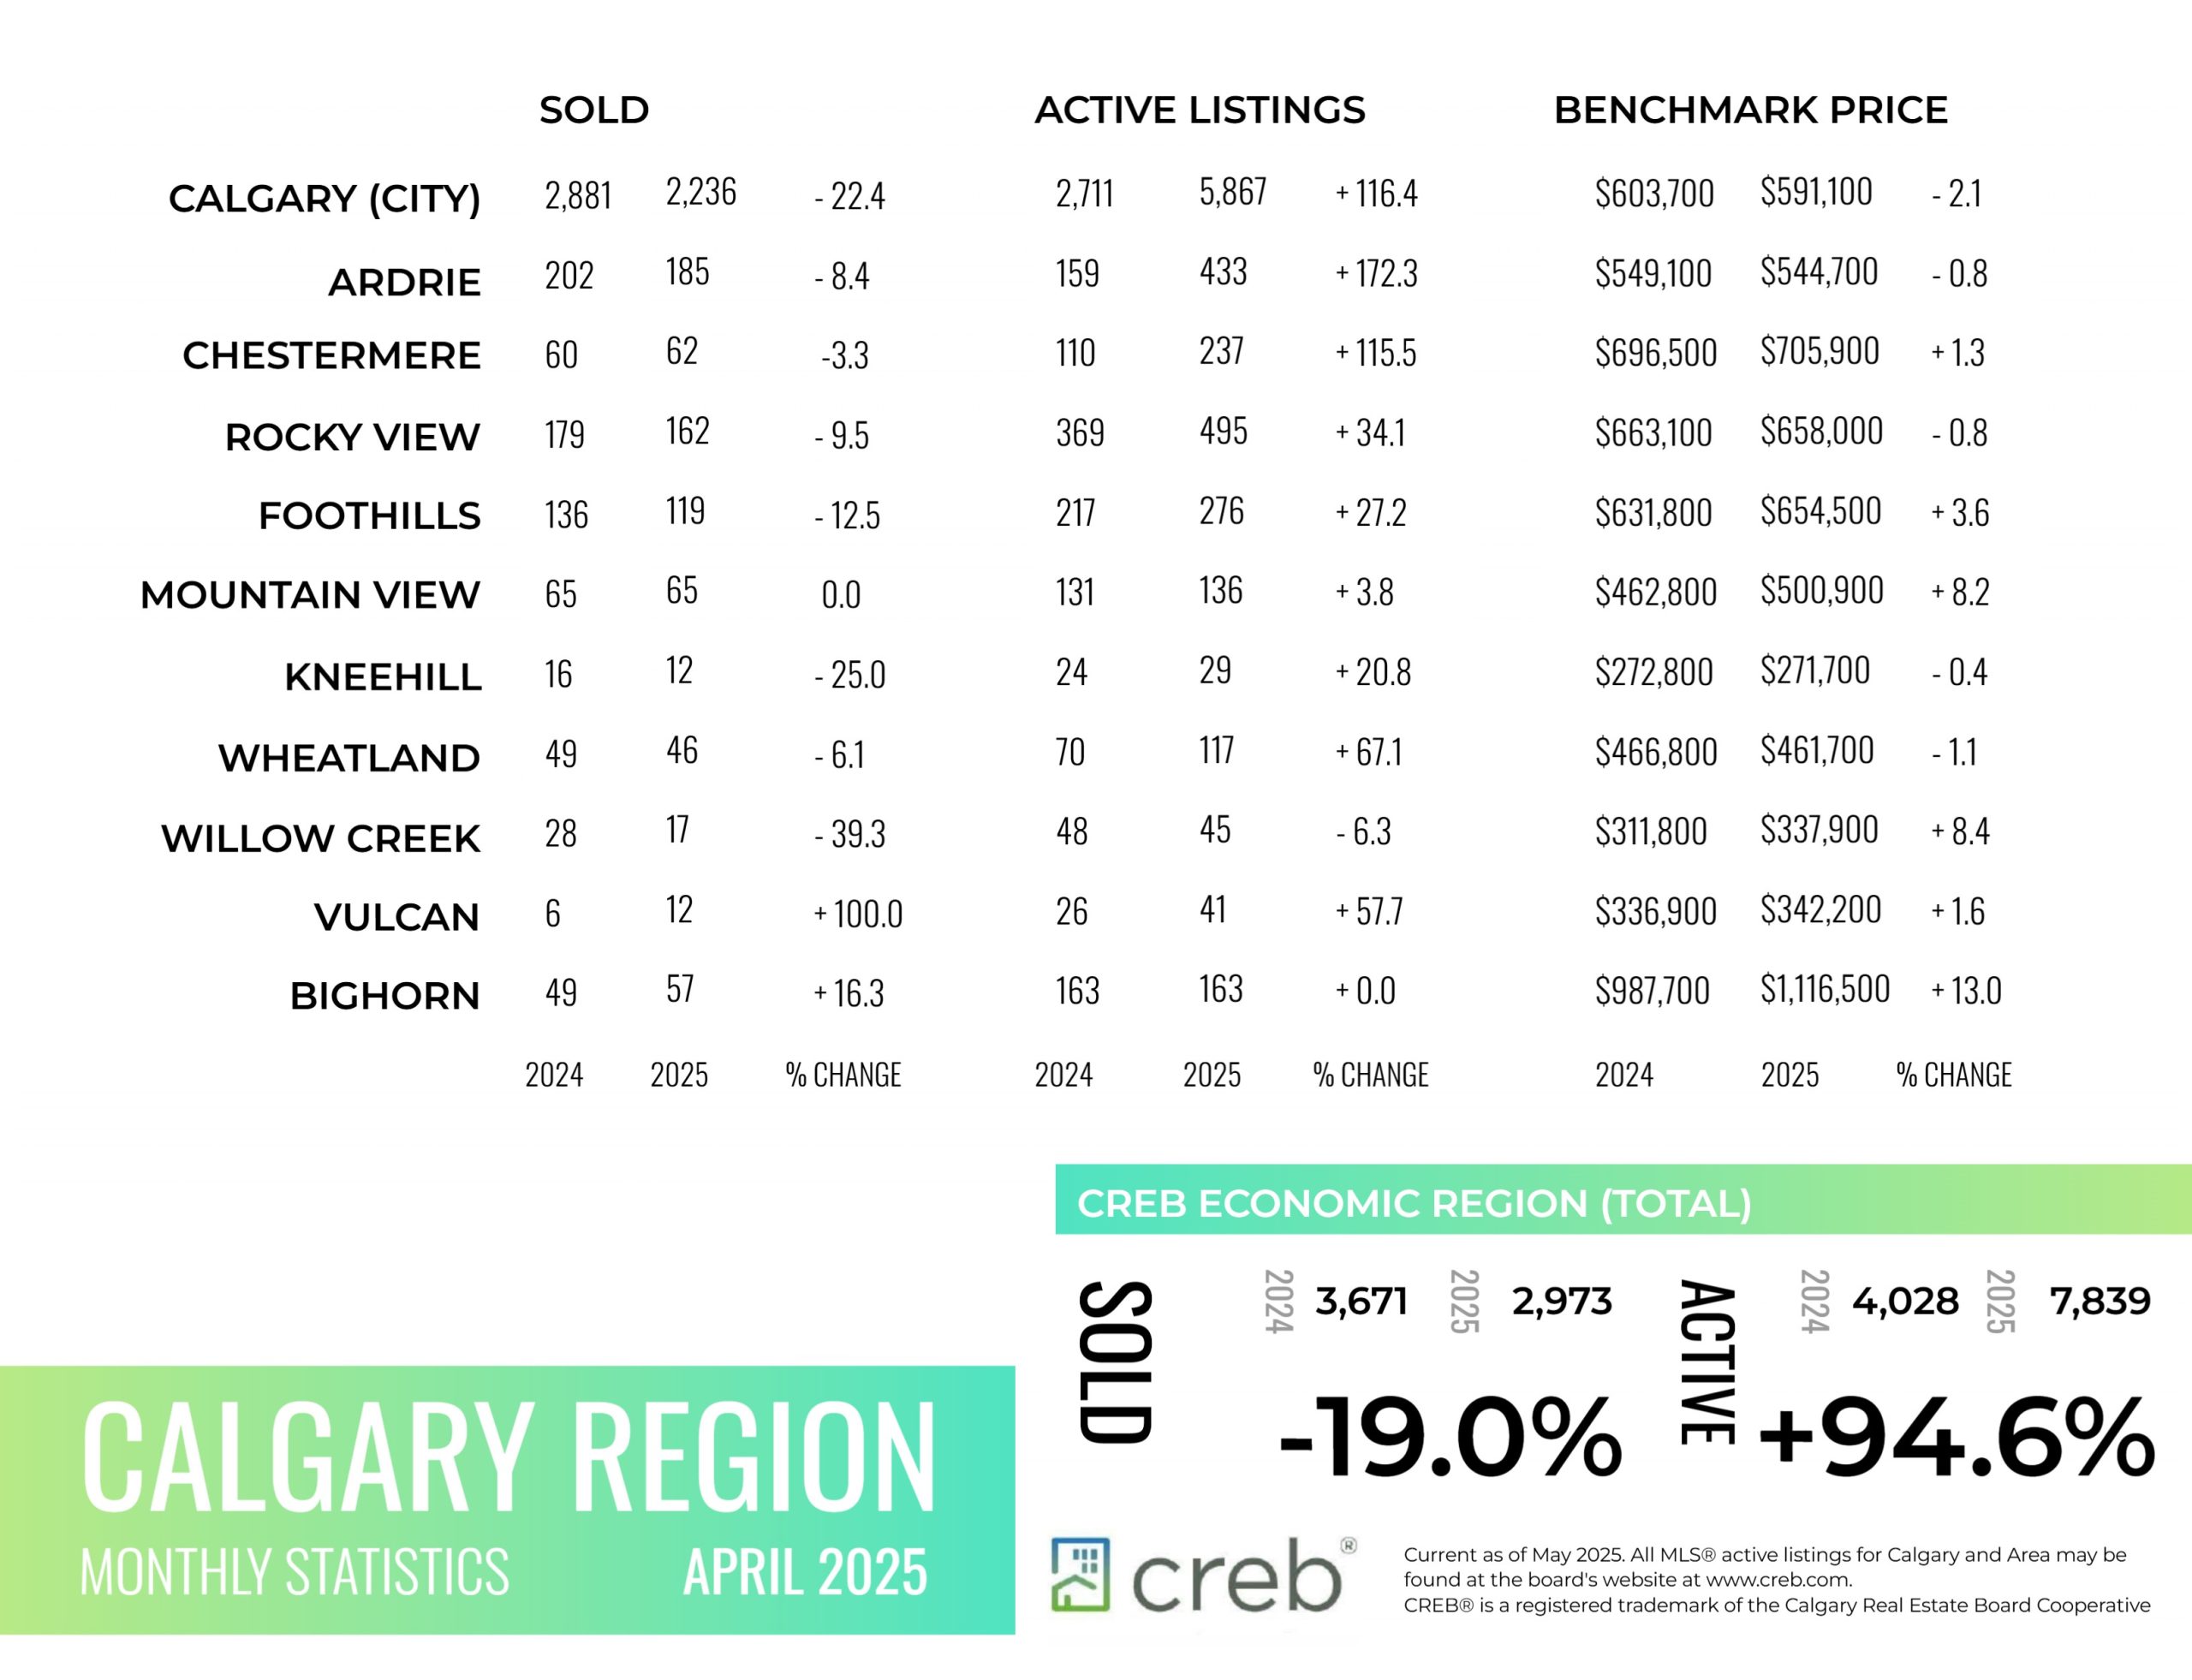
A boost in new listings this month relative to sales caused April inventories to rise to 5,876 units. While this is more than double the levels reported last year, supply last year was exceptionally low and current levels are consistent with levels we traditionally see in April. Sales in April reached 2,236 units, 22 per cent below last years levels but in line with long-term trends.
“Economic uncertainty has weighed on home sales in our market, but levels are still outpacing activity reported during the challenging economic climate experienced prior to the pandemic,” said Ann-Marie Lurie, Chief Economist at CREB®. “This, in part, is related to our market’s situation before the recent shocks. Previous gains in migration, relatively stable employment levels, lower lending rates, and better supply choice compared to last year’s ultra-low levels have likely prevented a more significant pullback in sales and have kept home prices relatively stable.”
Read the full report on the CREB website!
The following data is a comparison between April 2025 and April 2024 numbers, and is current as of May of 2025. For last month’s numbers, check out our previous infographic.
Or follow this link for all our CREB Infographics!
Click on the images for a larger view!
Download Printable Version – April 2025 CREB, City of Calgary Report Pages 1 and 2
Download Printable Version – April 2025 CREB, Calgary Region Report
Last Updated on May 5, 2025 by myRealPage
