

INFOGRAPHICS: September 2026 CREB City And Region Market Reports

Detached home sales improve in September
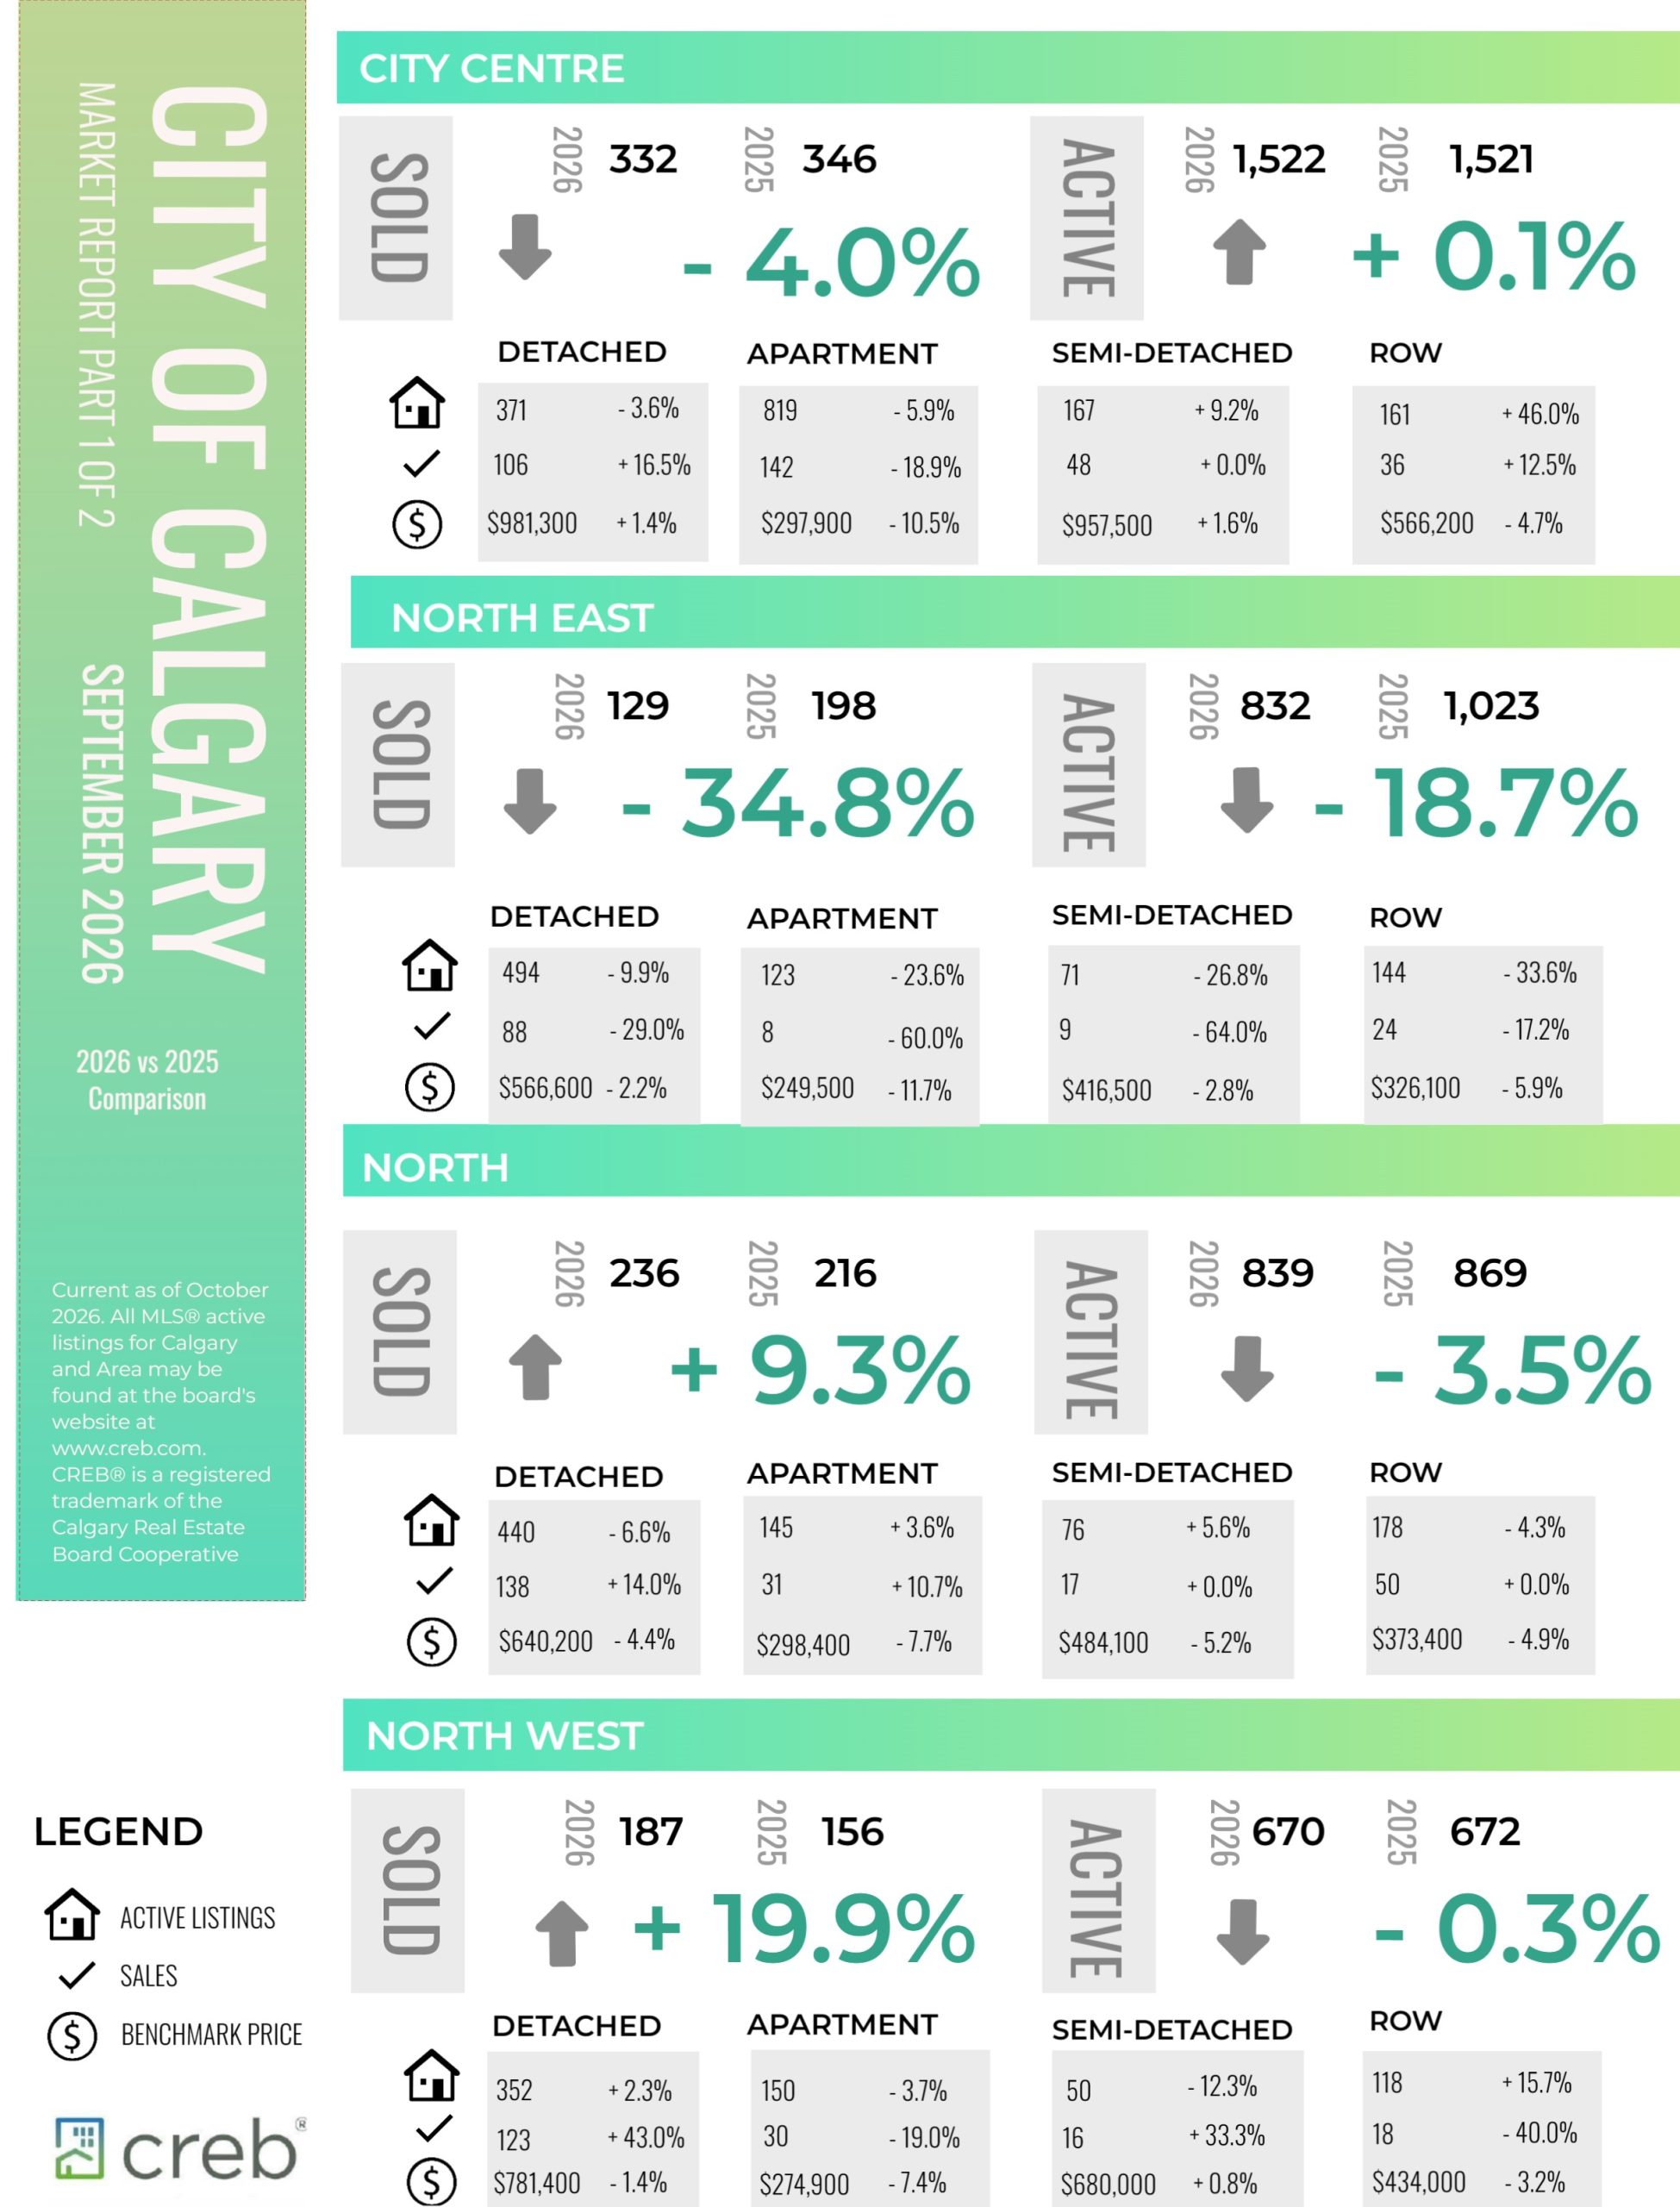
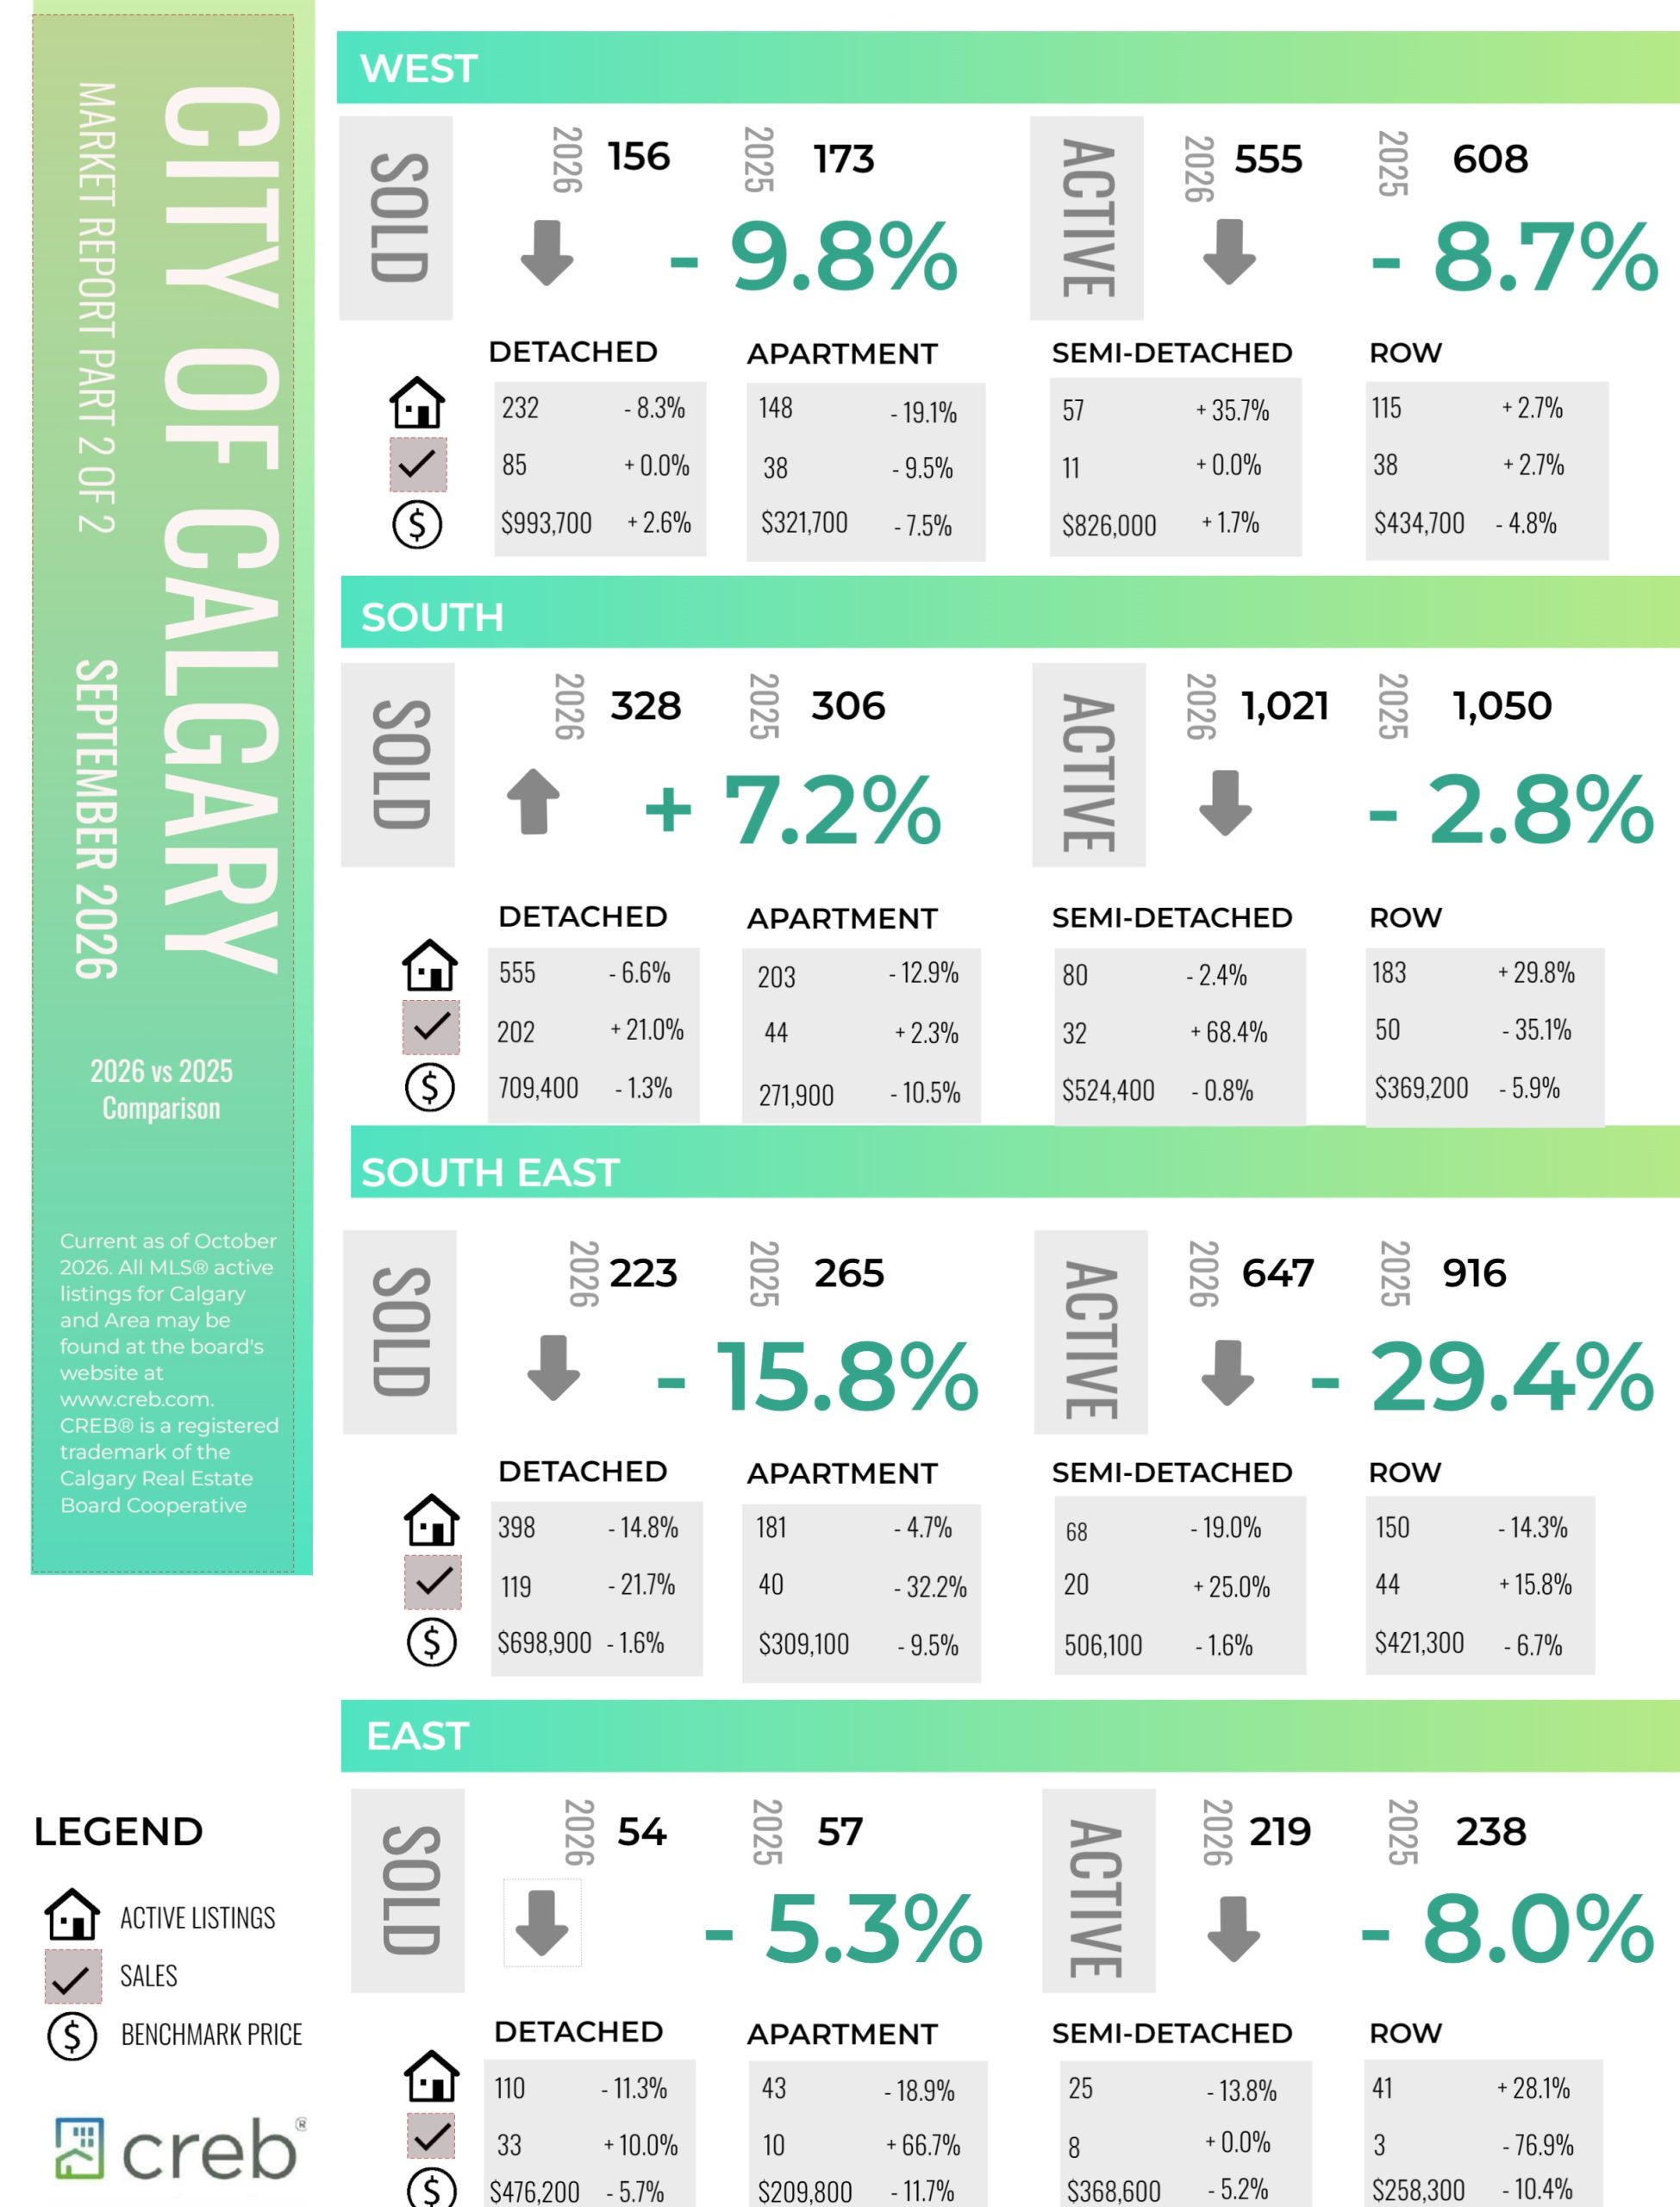
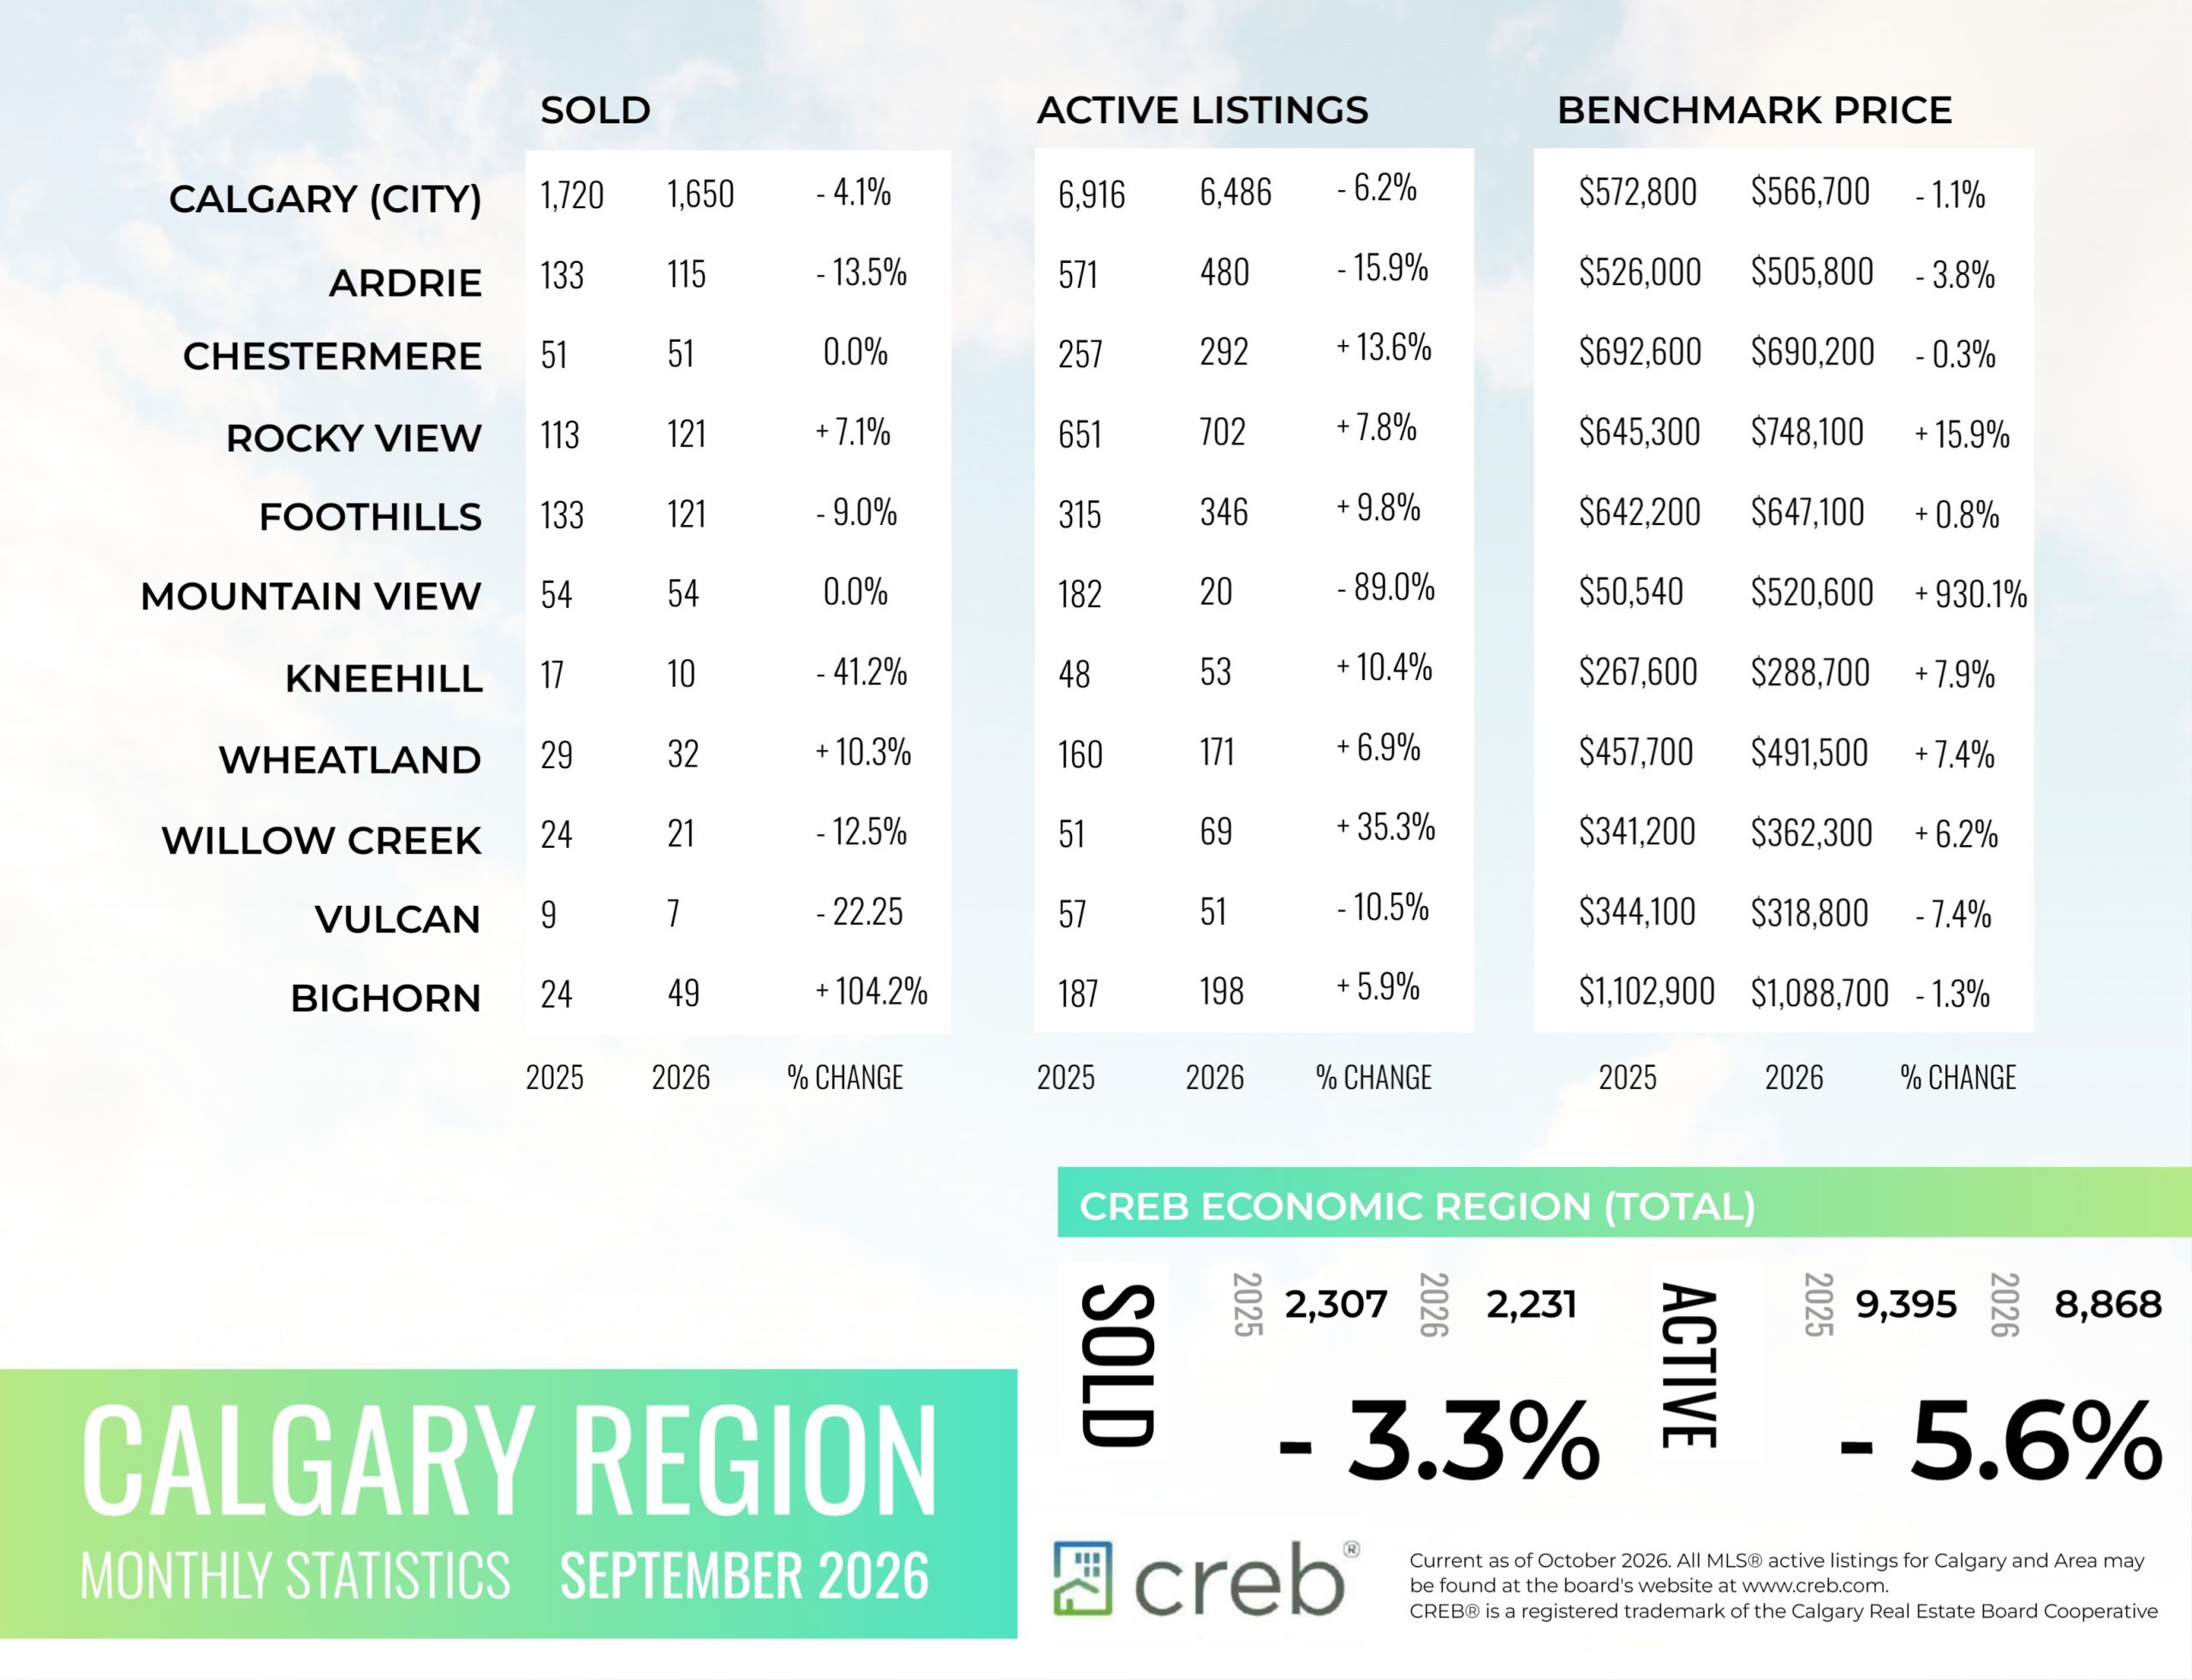
September sales totalled 1,650 units, similar to August and nearly four per cent lower than in September 2025. While September sales typically pull back compared with August, stronger detached home sales helped prevent the typical seasonal pullback.
At the same time, new listings also rose from August, causing the sales-to-new-listings ratio to fall to 49 per cent, leaving inventory levels relatively stable compared with August. Stable sales and inventory levels in September prevented any change in the months of supply compared with August, which remained at just under four months.
While the overall market is showing higher supply levels compared with sales activity, conditions vary significantly by property type. Detached properties remain in balanced territory, and the monthly boost in new listings supported gains in sales in September. Meanwhile, higher supply levels for apartment and row homes are contributing to buyer market conditions, as demand is spread across more alternatives in the rental and new home markets.
“The variation in market conditions between property types is related to where the supply was added. The construction boom over the past three years was mostly driven by gains in higher-density sectors, significantly increasing the supply of apartment and row-style homes,” said Ann-Marie Lurie, Chief Economist at the Calgary Real Estate Board (CREB®). “Meanwhile, detached homes did not see the same boost in construction, preventing broad-based supply growth. Thanks to a stronger job market and slower but positive net migration, housing demand has remained strong enough to absorb some of the supply, but not enough to offset the high-density supply added to the market, resulting in a more significant impact on prices for higher-density homes.”
Read the full report on the CREB website!
The following data is a comparison between September 2026 and September 2025 numbers, and is current as of October 0f 2026. For last month’s numbers, check out our previous infographic.
Or follow this link for all our CREB Infographics!
Click on the images for a larger view!
Download Printable Version – September 2026 CREB, City of Calgary Report Pages 1 and 2
Download Printable Version – September 2026 CREB, Calgary Region Report
Last Updated on October 6, 2026 by myRealPage
