INFOGRAPHICS: April 2019 CREB City And Region Market Reports

Ready for month number five for this year? Here are the latest housing market updates for areas covered by the Calgary Real Estate Board (CREB)!
In CREB’s latest press release, they have mentioned that April 2019 has brought a slight inventory decline along with it, while there have been “no significant changes occurring in sales activity.”
The slight adjustment in supply levels has helped support further reductions in the months of supply, which was 4.6 months in April. While this level still represents oversupply in our market, it does reflect improvement from the nearly seven months of supply that we saw at the start of the year.
According to CREB chief economist Ann-Marie Lurie,
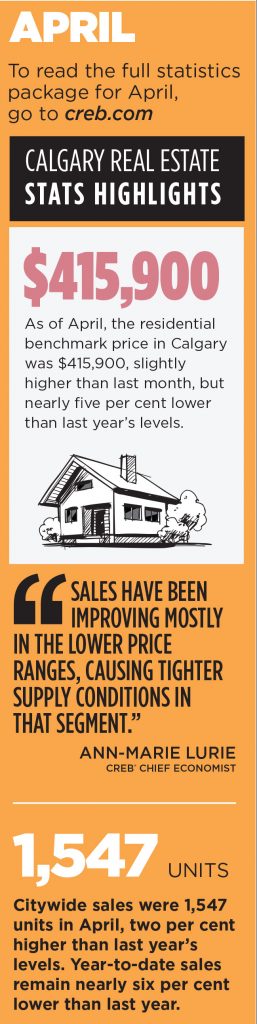
“Demand remains relatively weak in the resale market. However, if supply levels continue to adjust, this could help reduce the amount of oversupply and eventually support some price stability. Sales have been improving mostly in the lower price ranges, causing tighter supply conditions in that segment. This will likely have a different impact on price trends in the lower price ranges depending on location.”
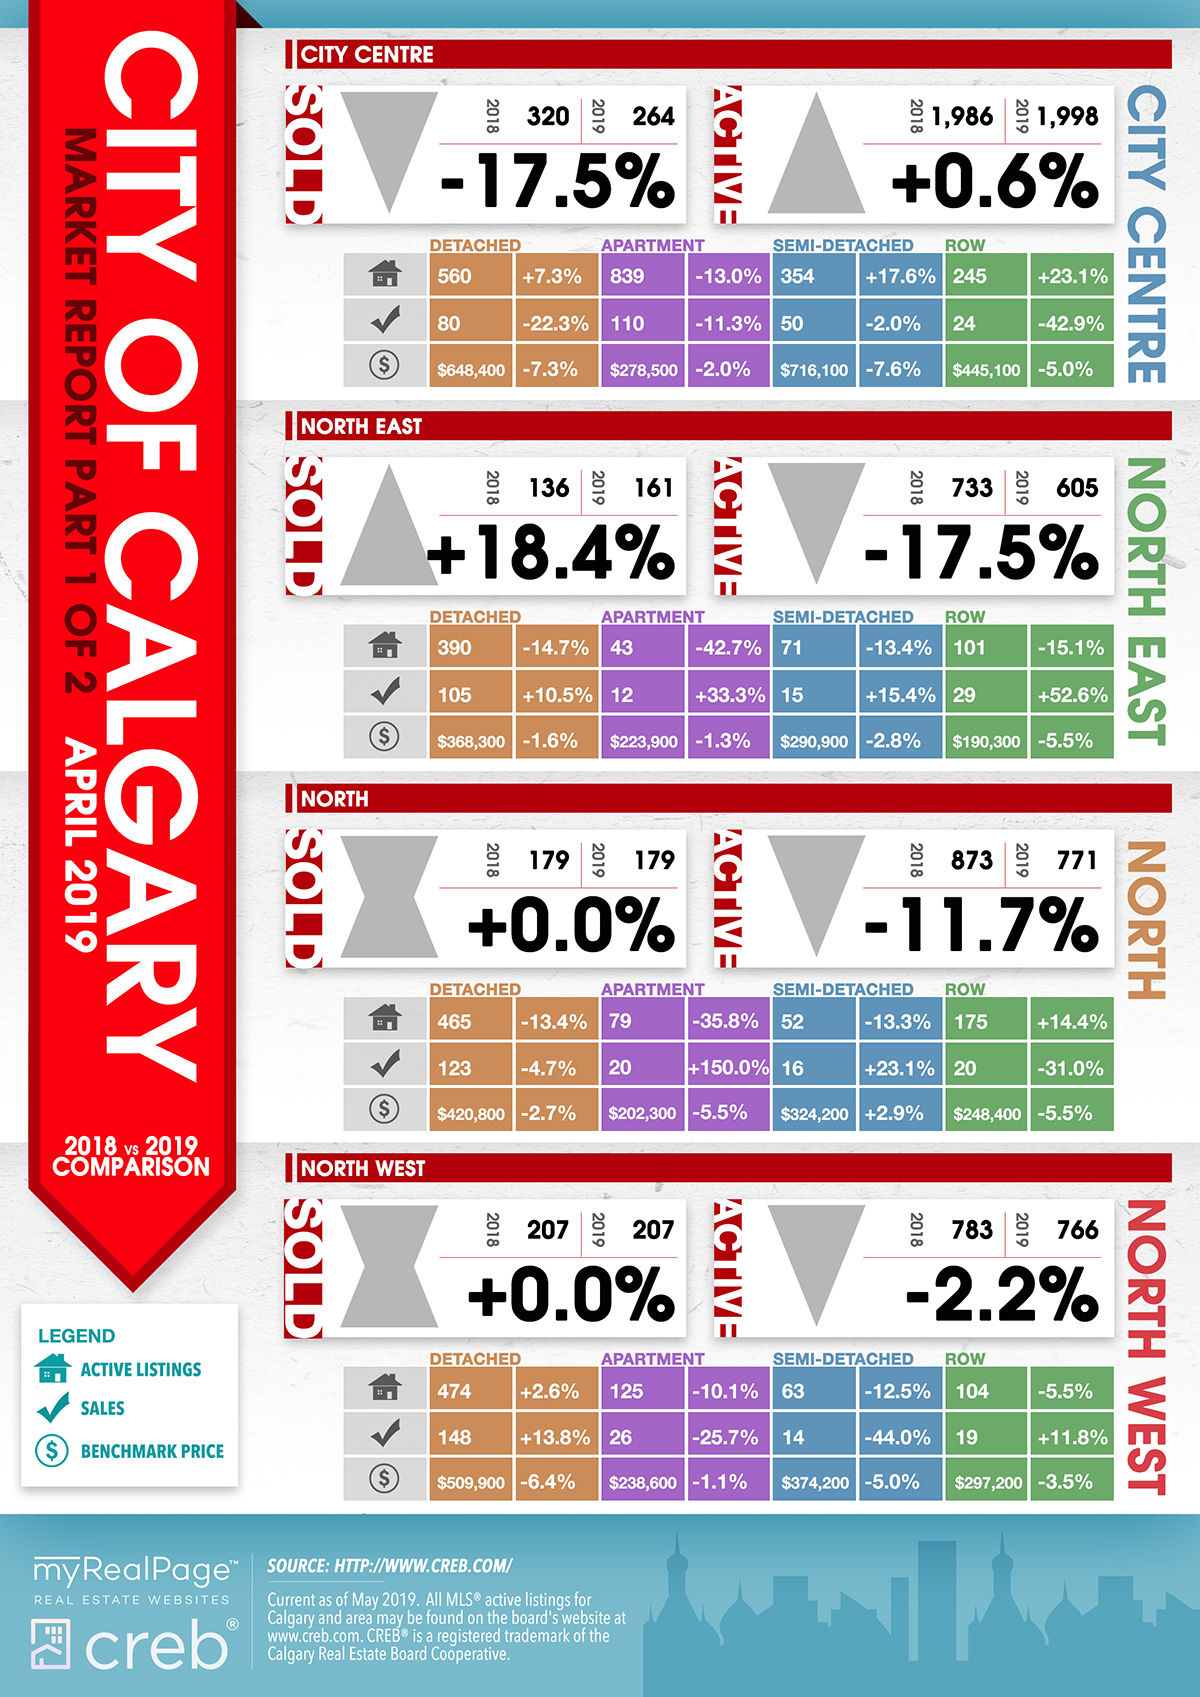
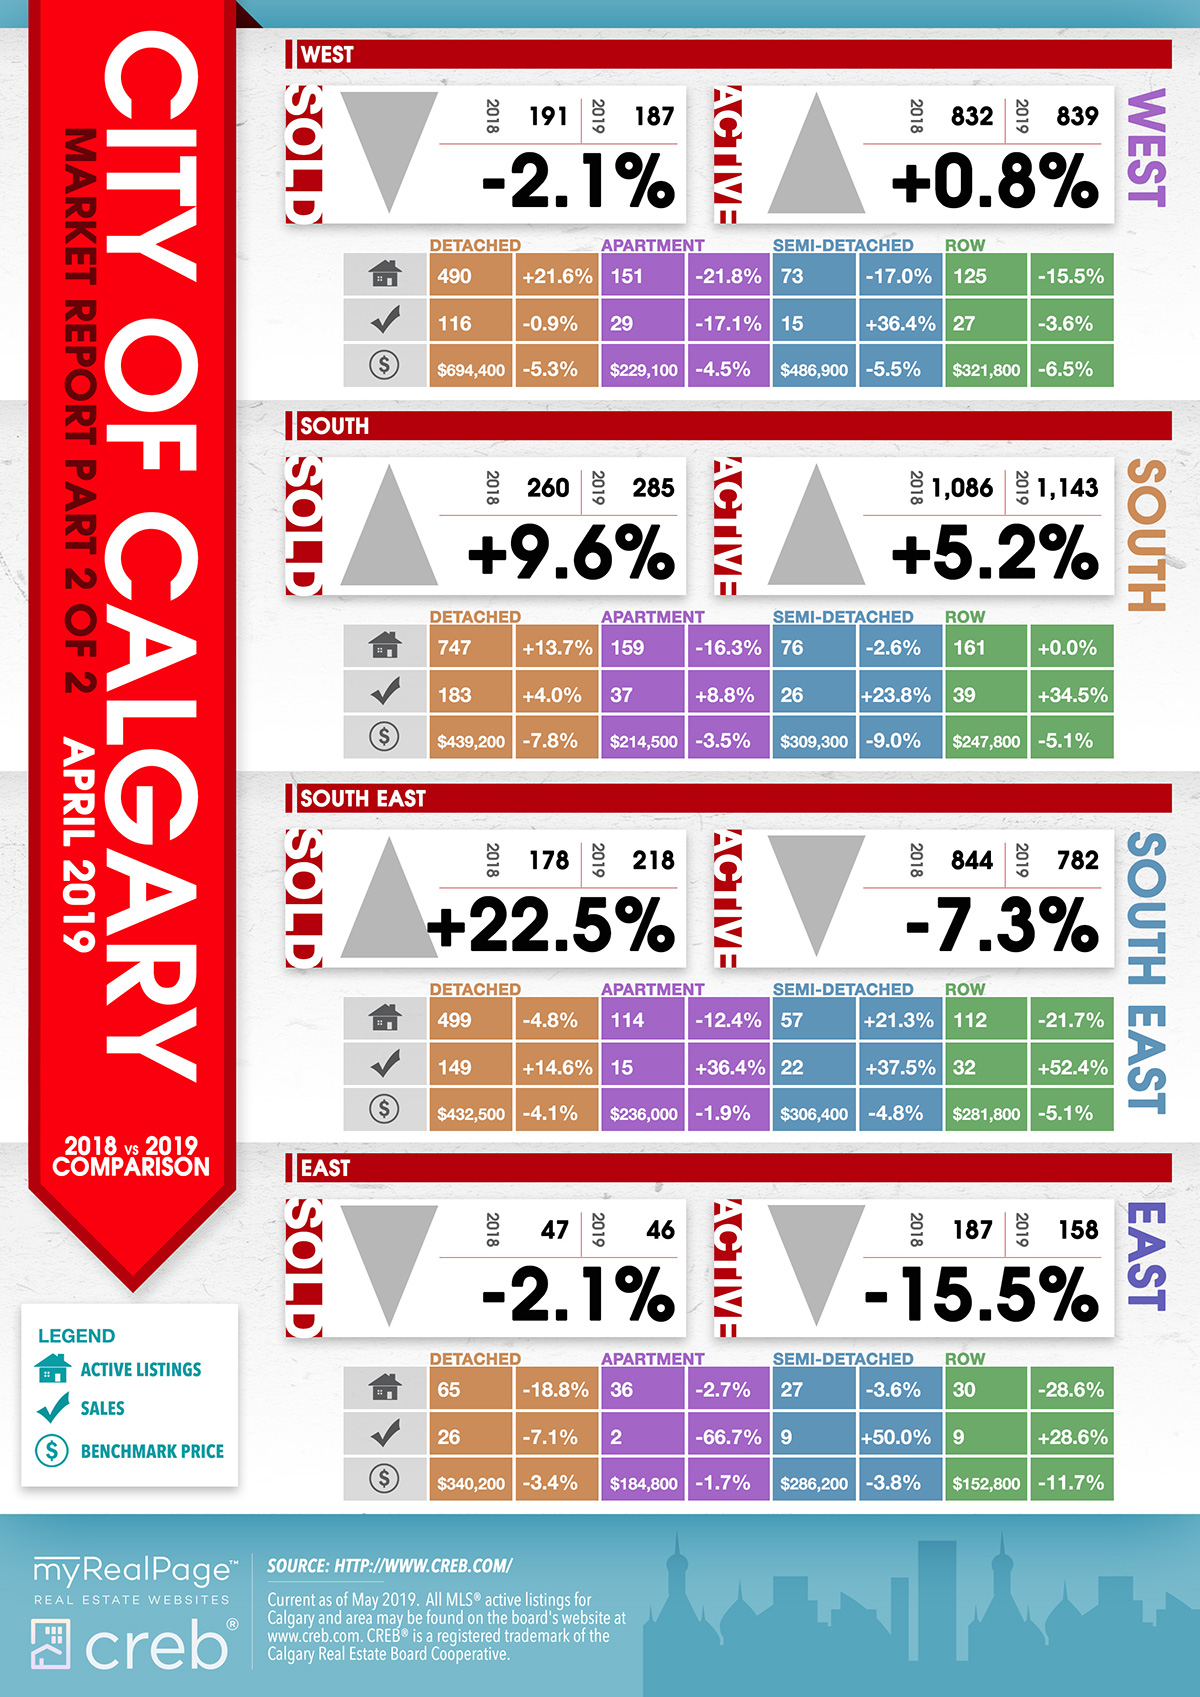
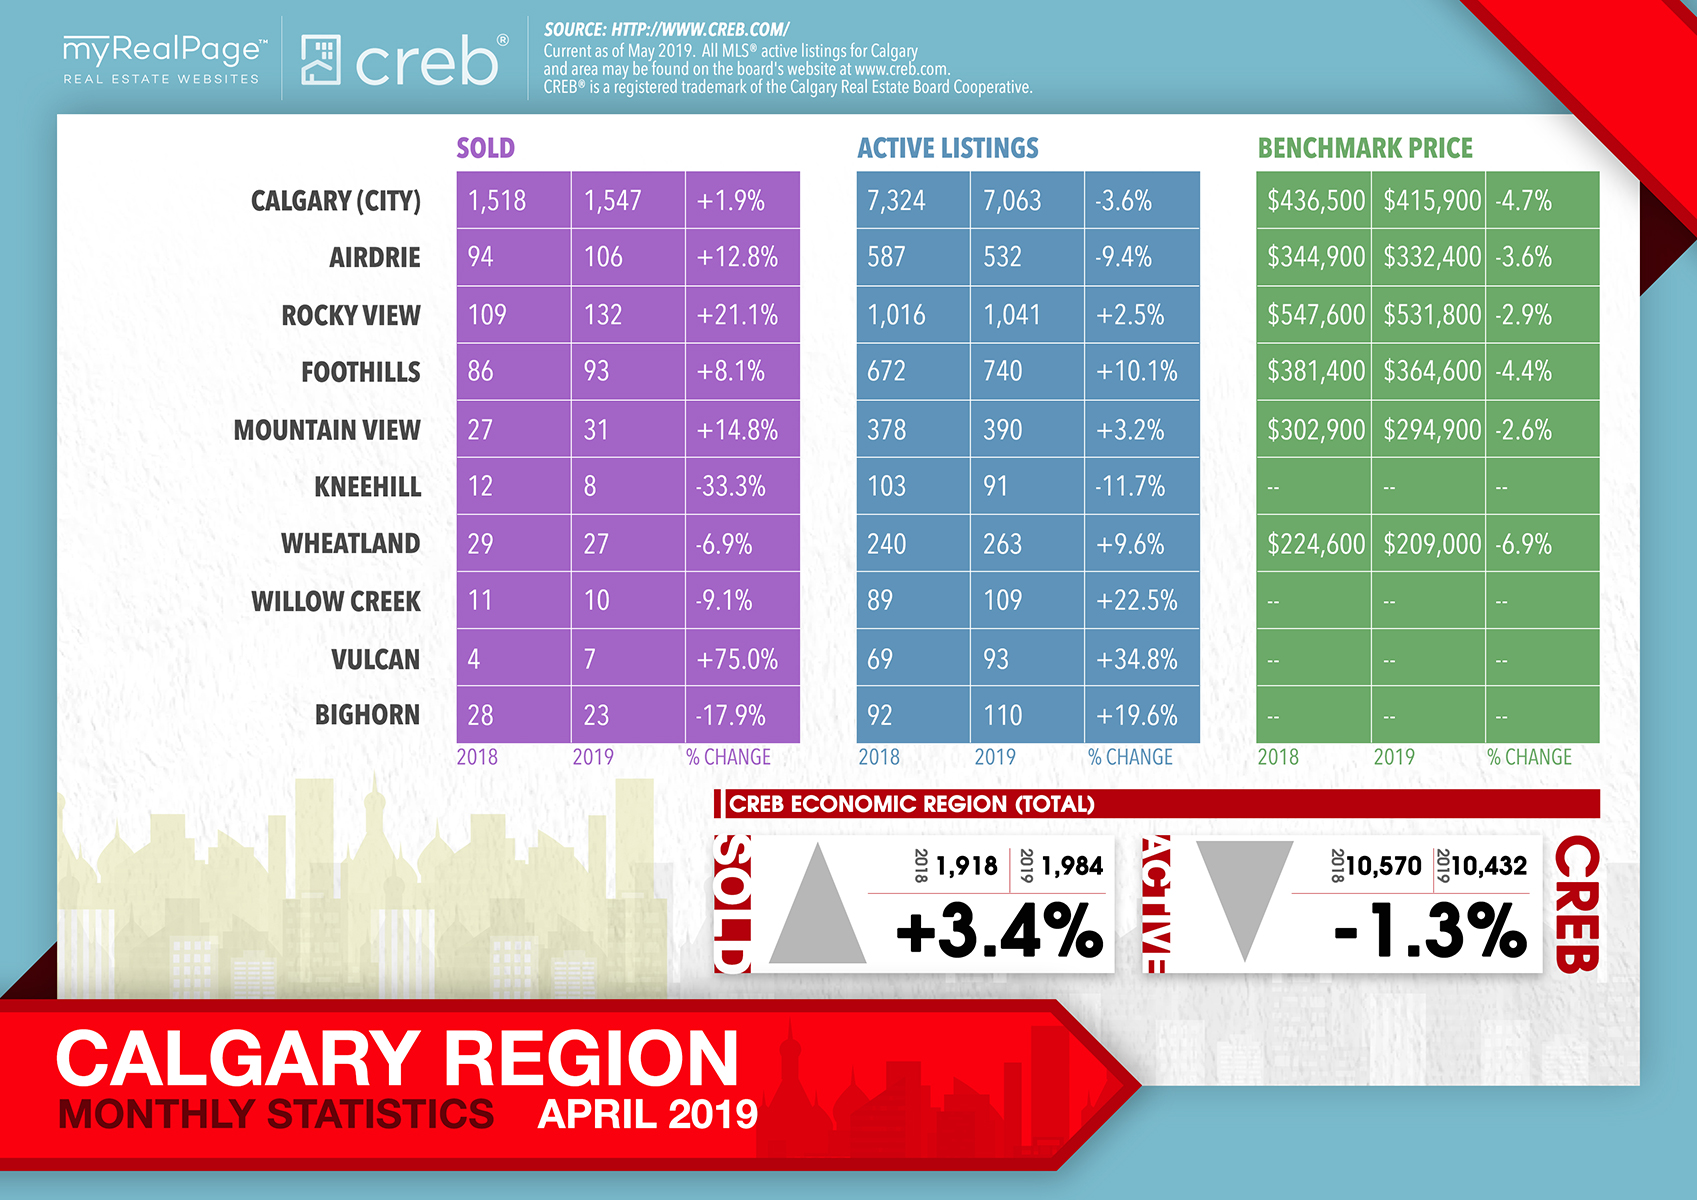
The following data is a comparison between April 2018 and April 2019 numbers, and is current as of May 2019. For last month’s numbers, check out our previous infographic.
Or follow this link for all our CREB Infographics!
Click on the images for a larger view!
(Protip: Make sure to grab the printable PDF versions, too! It fits best when printed on A4-sized sheets, AND we’ve added an area on the sheet where you can attach your business card! 🙂 )
Download Printable Version – April 2019 CREB, City of Calgary Report
Download Printable Version – April 2019 CREB, Calgary Region Report
(Image Source: CREBnow.com)
Last Updated on July 25, 2022 by myRealPage
