INFOGRAPHICS: March 2019 CREB City And Region Market Reports

Are you ready for the second quarter of 2019? Here are the latest housing market updates for areas covered by the Calgary Real Estate Board (CREB)!
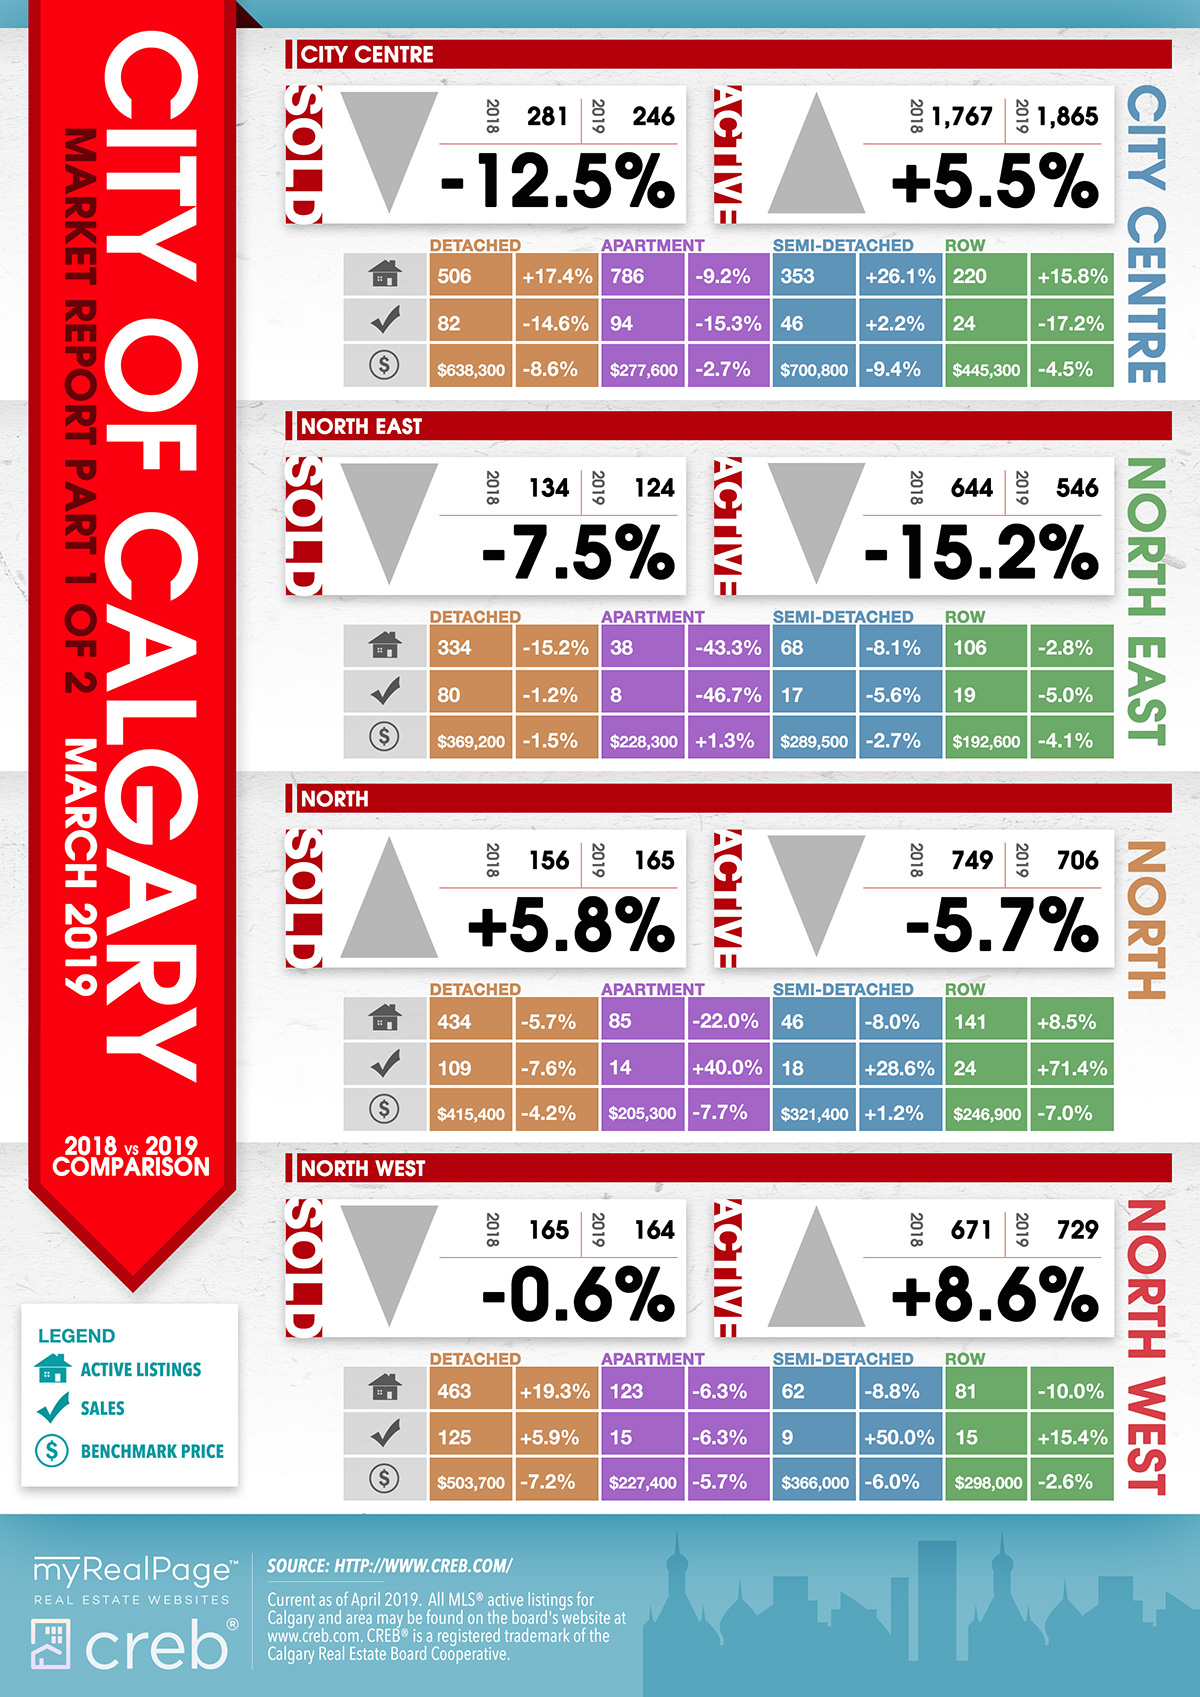
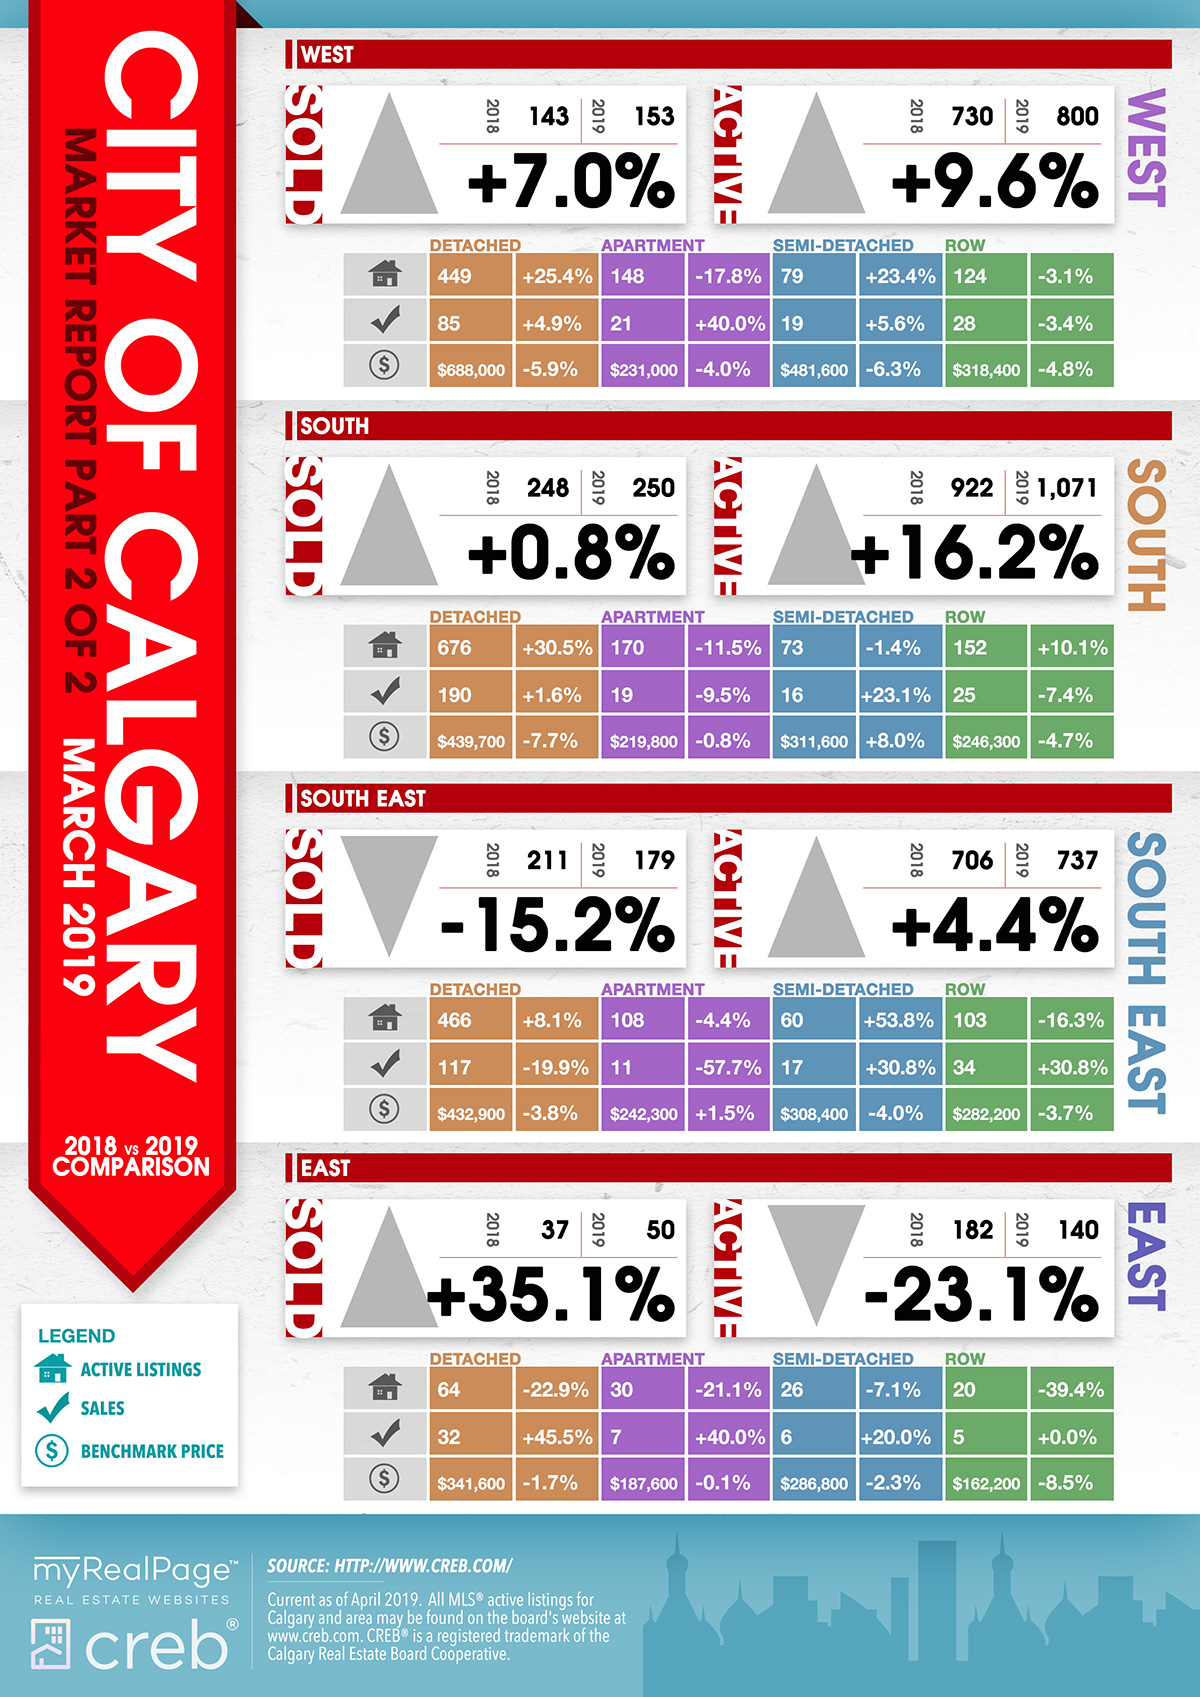
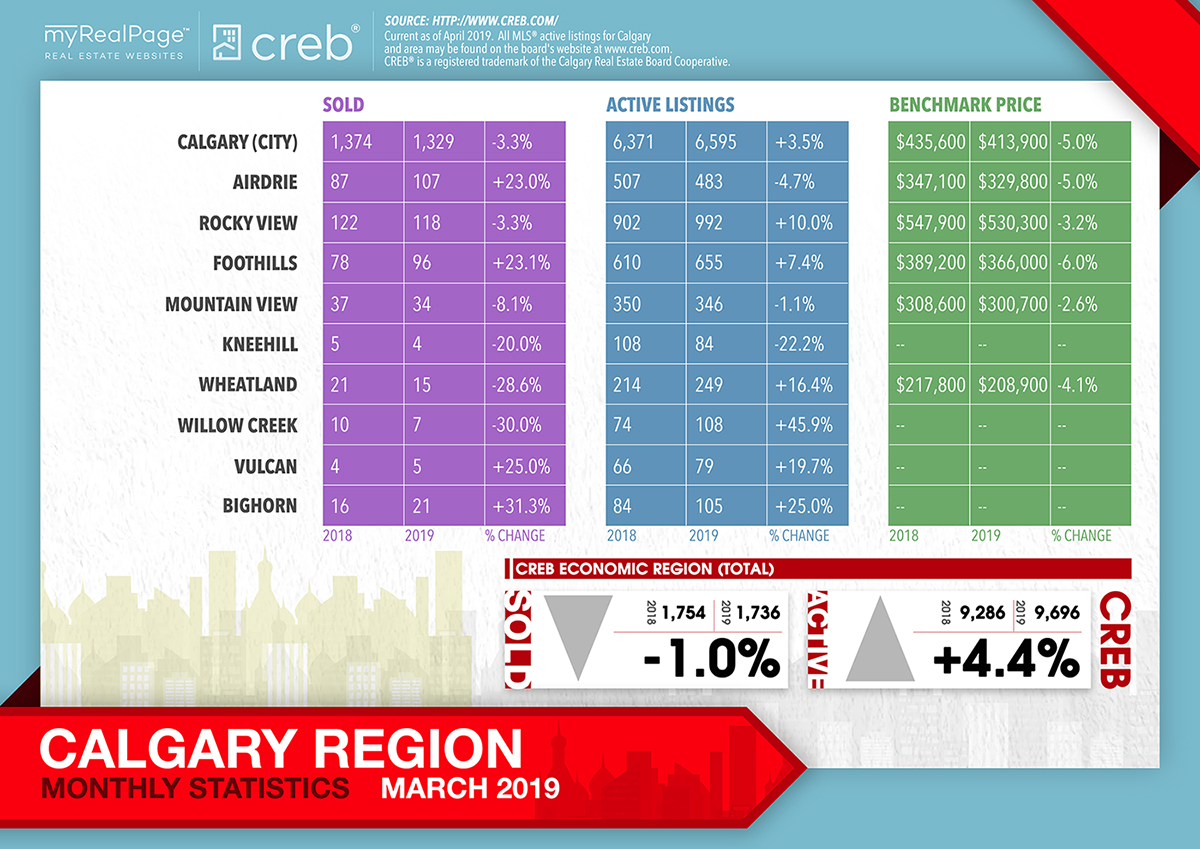
According to CREB’s latest market report, March saw a modest decline in city wide sales activity compared to last year. However, sales have been rising for more affordable product in the detached and attached sectors.
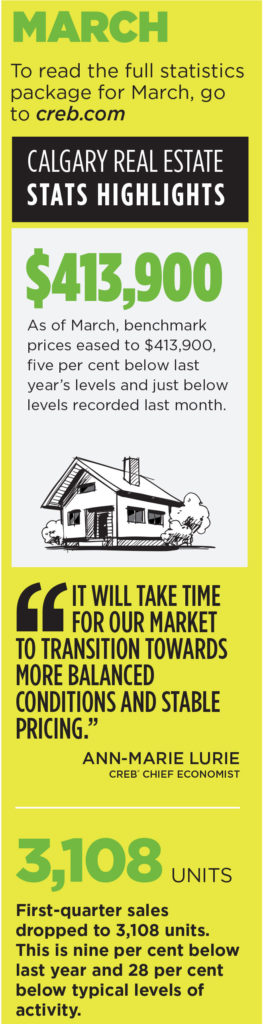
Shifts in the lower end of the market have not outweighed easing across the higher priced product. First-quarter sales dropped to 3,108 units. This is 9% below last year and 28% below typical levels of activity.
Price declines and relatively slow sales activity are impacting the number of new listings. For the second consecutive month, new listings eased compared to last year’s levels and long-term trends, but it was not enough to prevent inventory growth.
As noted by CREB chief economist Ann-Marie Lurie,
“If new listings continue to slow compared to sales, it could start to help with the persistent oversupply scenario weighing on our housing market. However, inventory is still high. It will still take time for our market to transition towards more balanced conditions and stable pricing.”
The following data is a comparison between March 2018 and March 2019 numbers, and is current as of April 2019. For last month’s numbers, check out our previous infographic.
Or follow this link for all our CREB Infographics!
Click on the images for a larger view!
(Protip: Make sure to grab the printable PDF versions, too! It fits best when printed on A4-sized sheets, AND we’ve added an area on the sheet where you can attach your business card! 🙂 )
Download Printable Version – March 2019 CREB, City of Calgary Report
Download Printable Version – March 2019 CREB, Calgary Region Report
(Image Source: CREBnow.com)
Last Updated on July 25, 2022 by myRealPage
