INFOGRAPHICS: April 2019 TREB Toronto Market Reports

April has been a good month for sales! Here are the latest real estate market updates for areas covered by the Toronto Real Estate Board (TREB)!
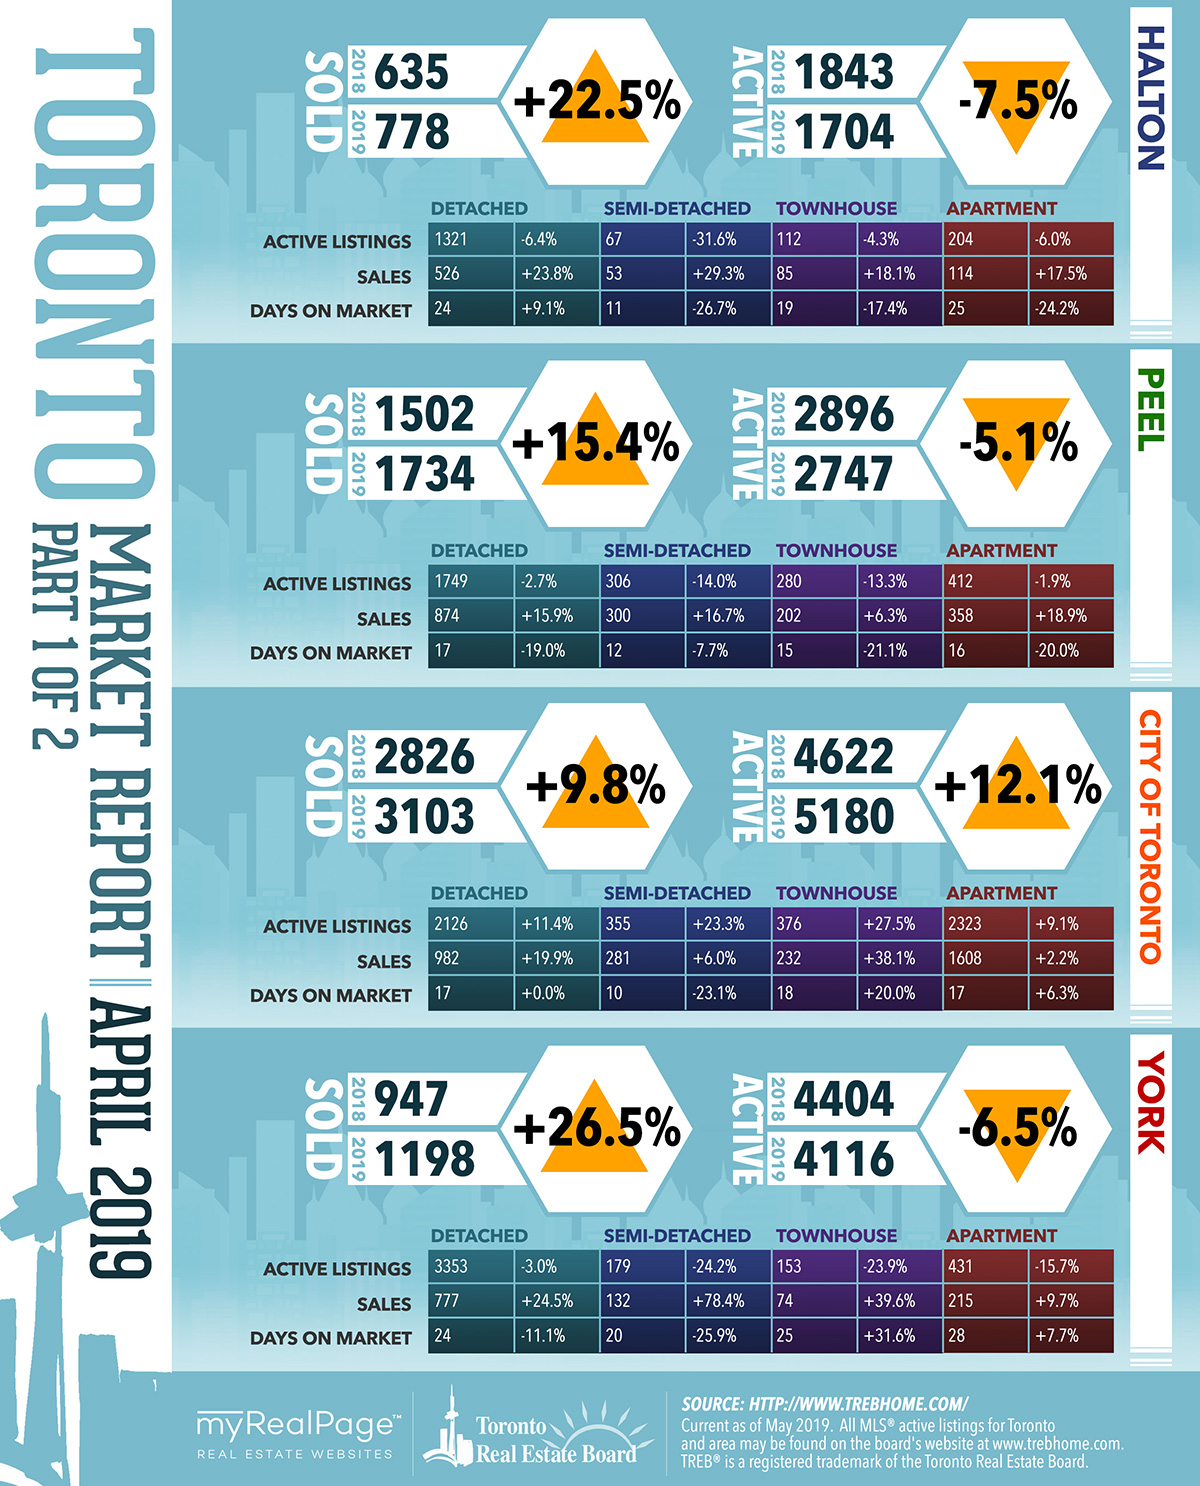
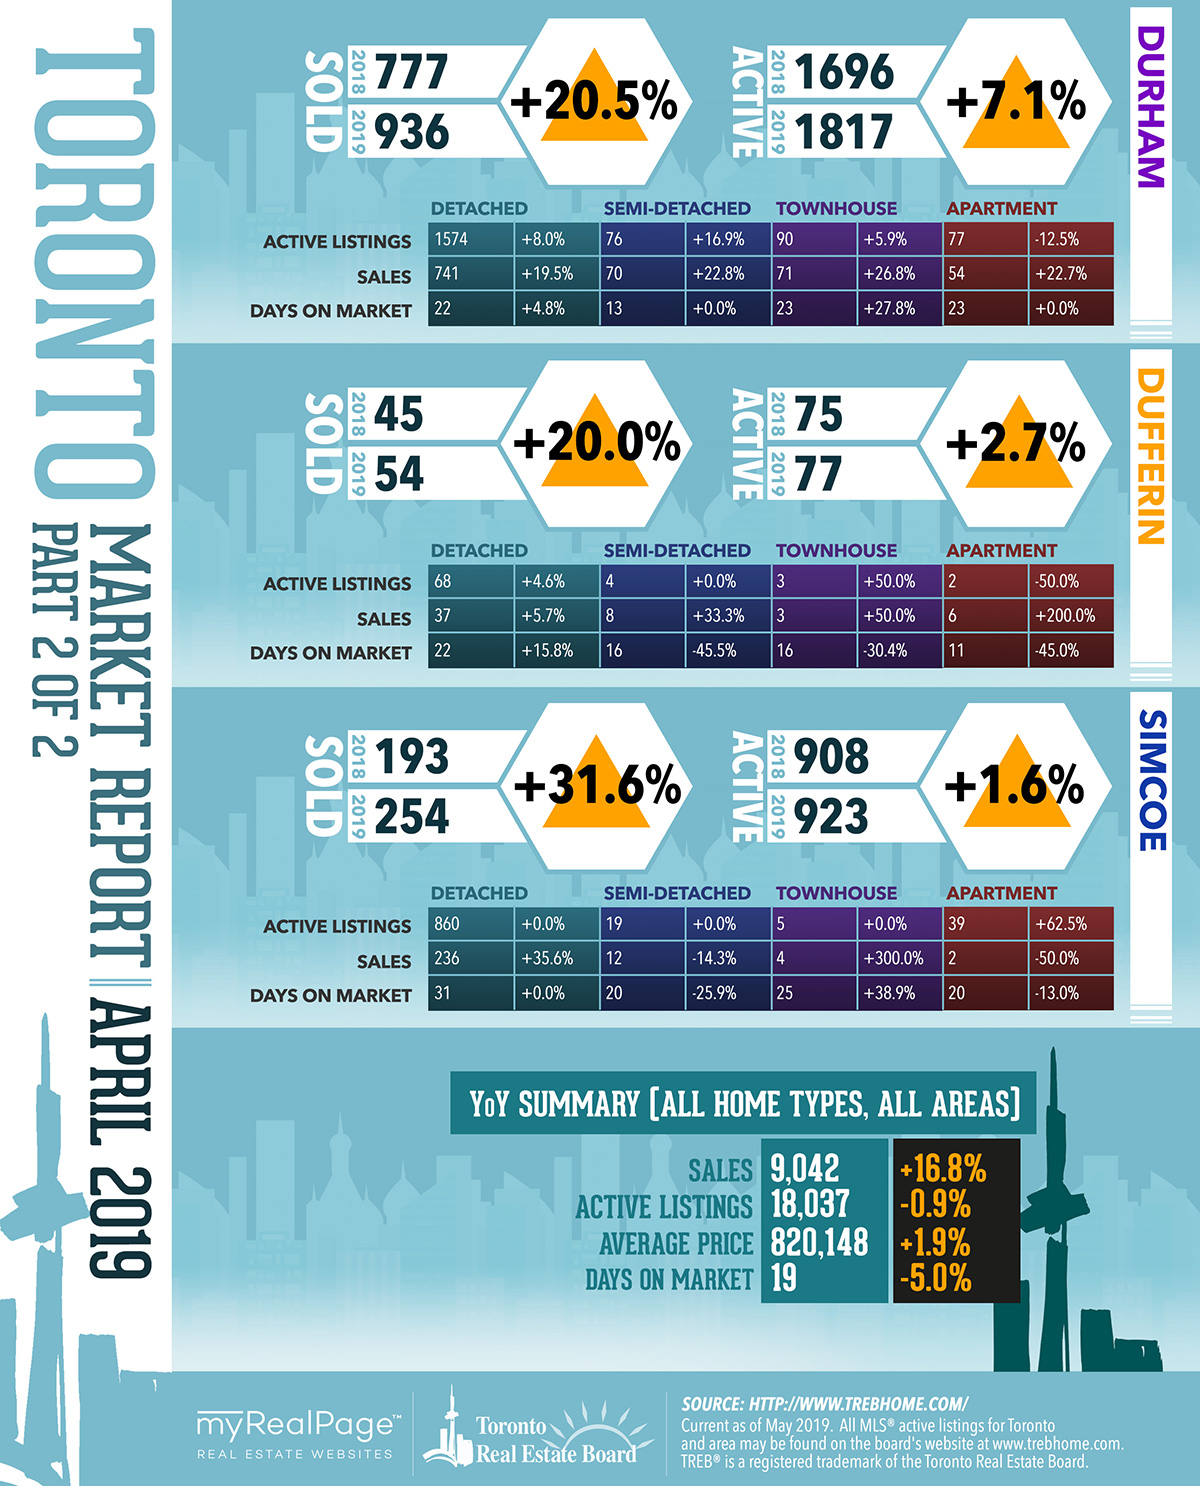
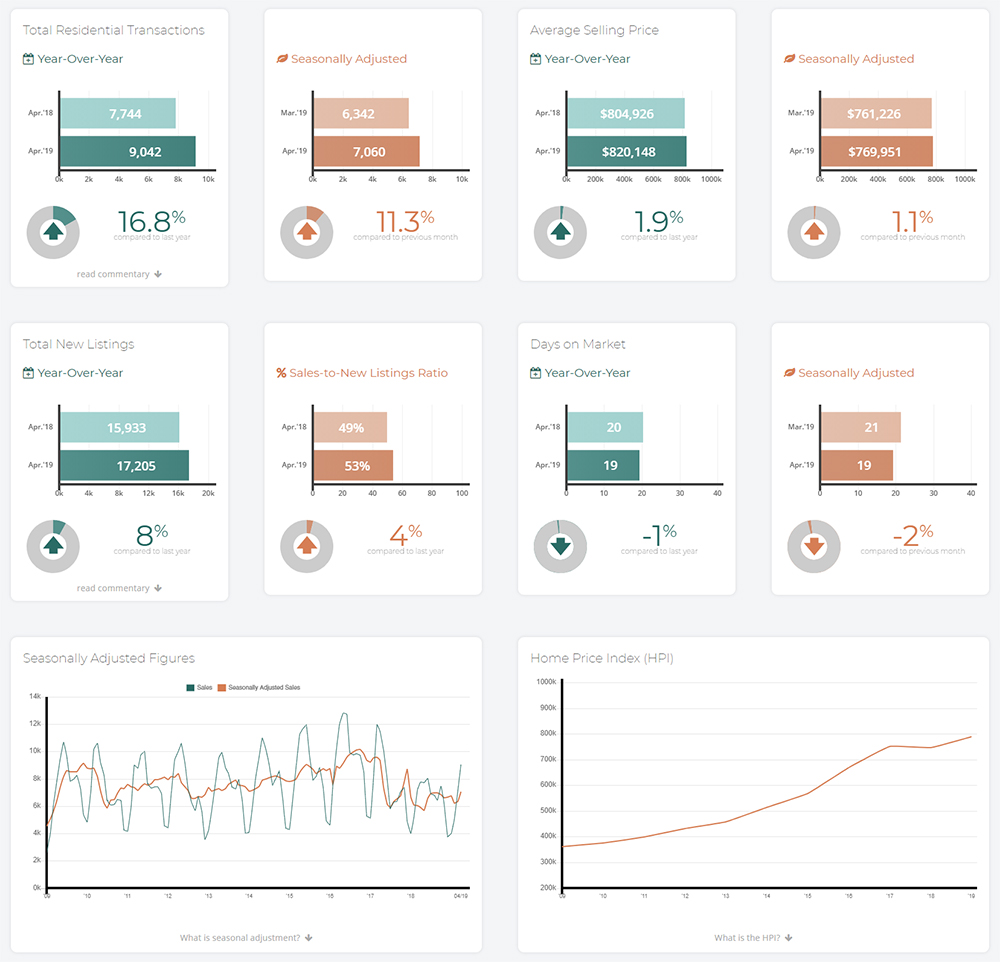
As noted in TREB’s most recent market update, a substantial year-over-year increase in home sales in April 2019 has been announced by board President Garry Bhaura. The number of residential transactions jumped by 16.8% to 9,042 compared to 7,744 in April 2018.
New listings were also up year-over-year by eight per cent. However, the annual growth rate for new listings was much lower than that reported for sales. This suggests that market conditions continued to tighten which points toward an acceleration in price growth.
![]() Garry Bhaura remarks,
Garry Bhaura remarks,
“The strong year-over-year growth in sales is obviously a good news story and likely represents some catchup from a slow start to the year. TREB’s sales outlook for 2019 anticipates an increase relative to 2018. It should be noted, however, that growth in new listings is not keeping pace with sales. This points to the ongoing housing supply issue in the GTA. In this regard TREB welcomes the provincial government’s Housing Supply Action Plan announced last week to reduce red tape and improve the mix of housing types. TREB provided input on the Plan through submissions and participation on working groups.”
Price growth continued to be driven by the condominium apartment segment and higher-density low-rise segments. The average price for detached houses dipped year-over-year, specifically in regions surrounding the City of Toronto. The detached market segment, with the highest price point on average, has arguably been hardest hit by measures such as the OSFI stress test.
TREB Chief Market Analyst Jason Mercer adds,
“While sales were up year-over-year in April, it is important to note that they remain well-below April levels for much of the past decade. Many potential home buyers arguably remain on the sidelines as they reassess their options in light of the OSFI-mandated two percentage point stress test on mortgages. Longer term borrowing costs have trended lower this year and the outlook for short-term rates, for which the Bank of Canada holds the lever, is flat to down this year. Unfortunately, against this backdrop, we have seen no movement toward flexibility in the OSFI stress test.”
UPDATE: In January 2020, TREB has since rebranded to TRREB, the Toronto Regional Real Estate Board.
The following data is a comparison between April 2018 and April 2019 numbers, and is current as of May 2019. For last month’s numbers, check out our previous infographic!
Or follow this link for all our TREB Infographics!
Click on the images for a larger view!
(Protip: Make sure to grab the printable PDF versions, too! It fits best when printed on A4-sized sheets, AND we’ve added an area on the sheet where you can attach your business card! 🙂 )
Download Printable Version – April 2019 TREB, Toronto Market Report
(Image Source: TREBhome.com)
Last Updated on September 28, 2023 by myRealPage
