INFOGRAPHICS: April 2020 REBGV Greater Vancouver Market Reports

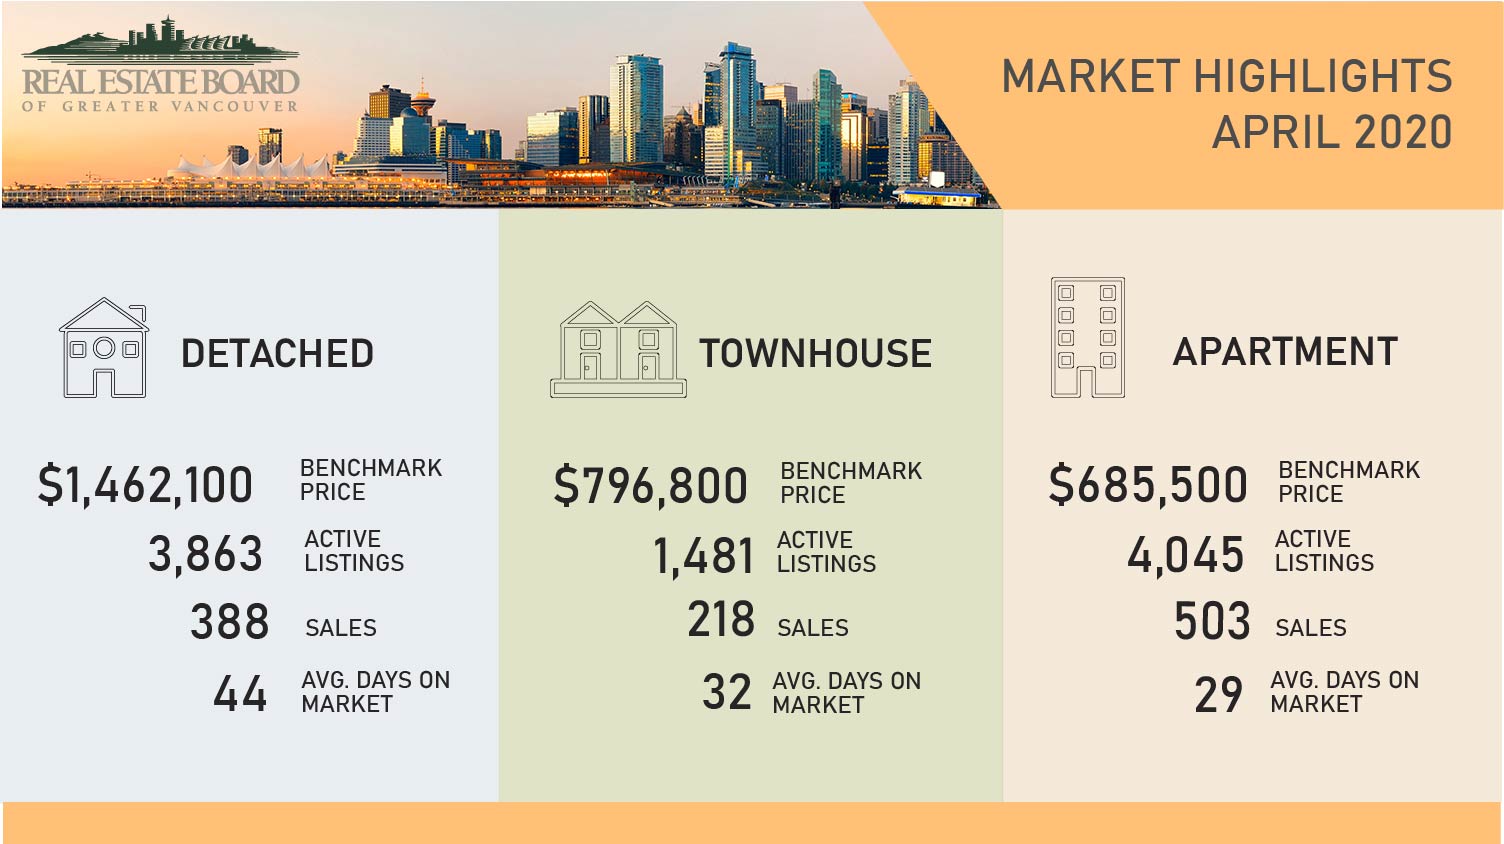
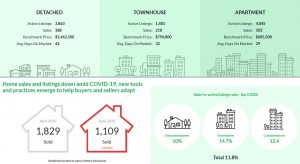
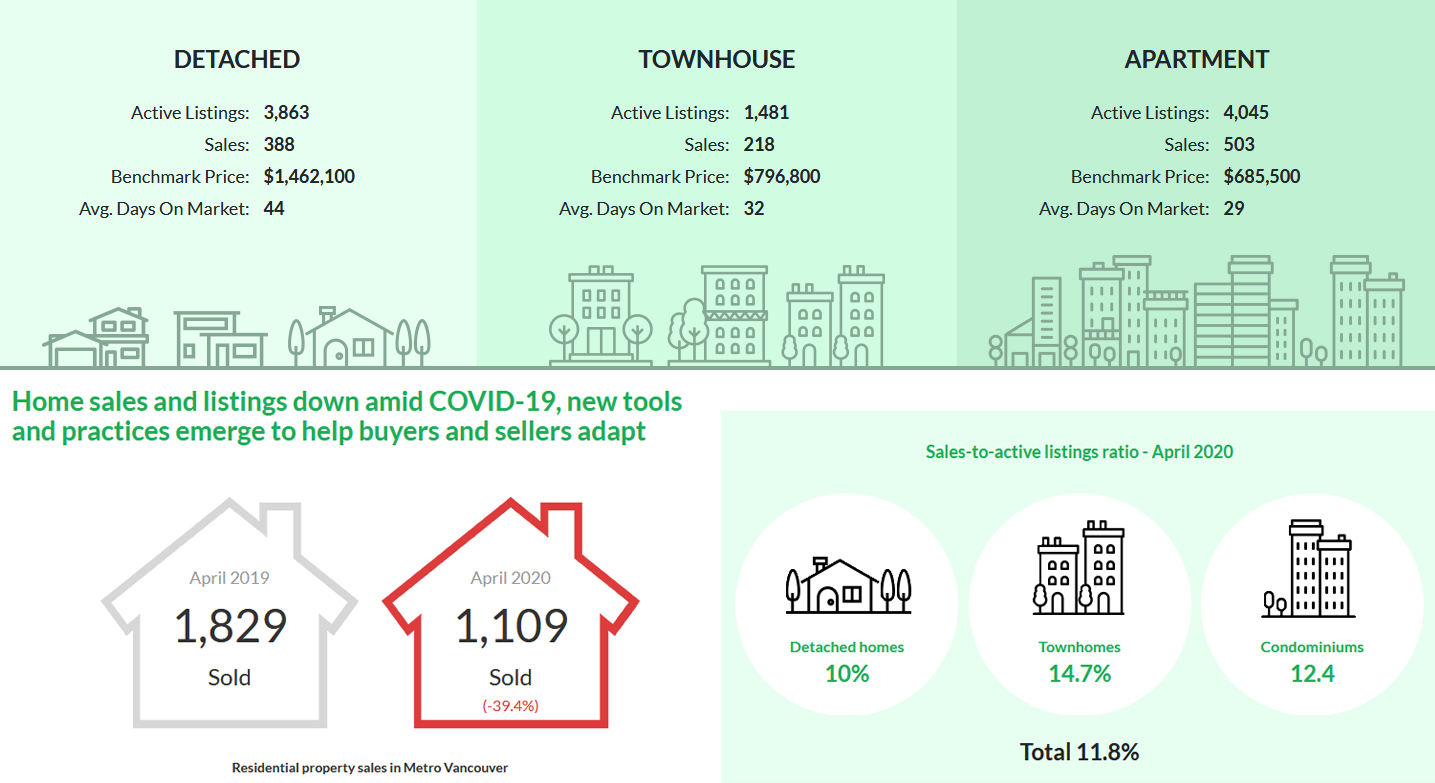
Home sales and listings down amid COVID-19, new tools and practices emerge to help buyers and sellers adapt.
The Real Estate Board of Greater Vancouver (REBGV) reports that residential home sales in the region totalled 1,109 in April 2020, a 39.4% decrease from the 1,829 sales recorded in April 2019, and a 56.1% decrease from the 2,524 homes sold in March 2020.
Last month’s sales were 62.7% below the 10-year April sales average and was the lowest total for the month since 1982.
Read the full report over on the REBGV website.
The following data is a comparison between April 2019 and April 2020 numbers, and is current as of May 2020. For last month’s update, you can check out our previous post for March 2020 data.
Or follow this link for all our REBGV Infographics!
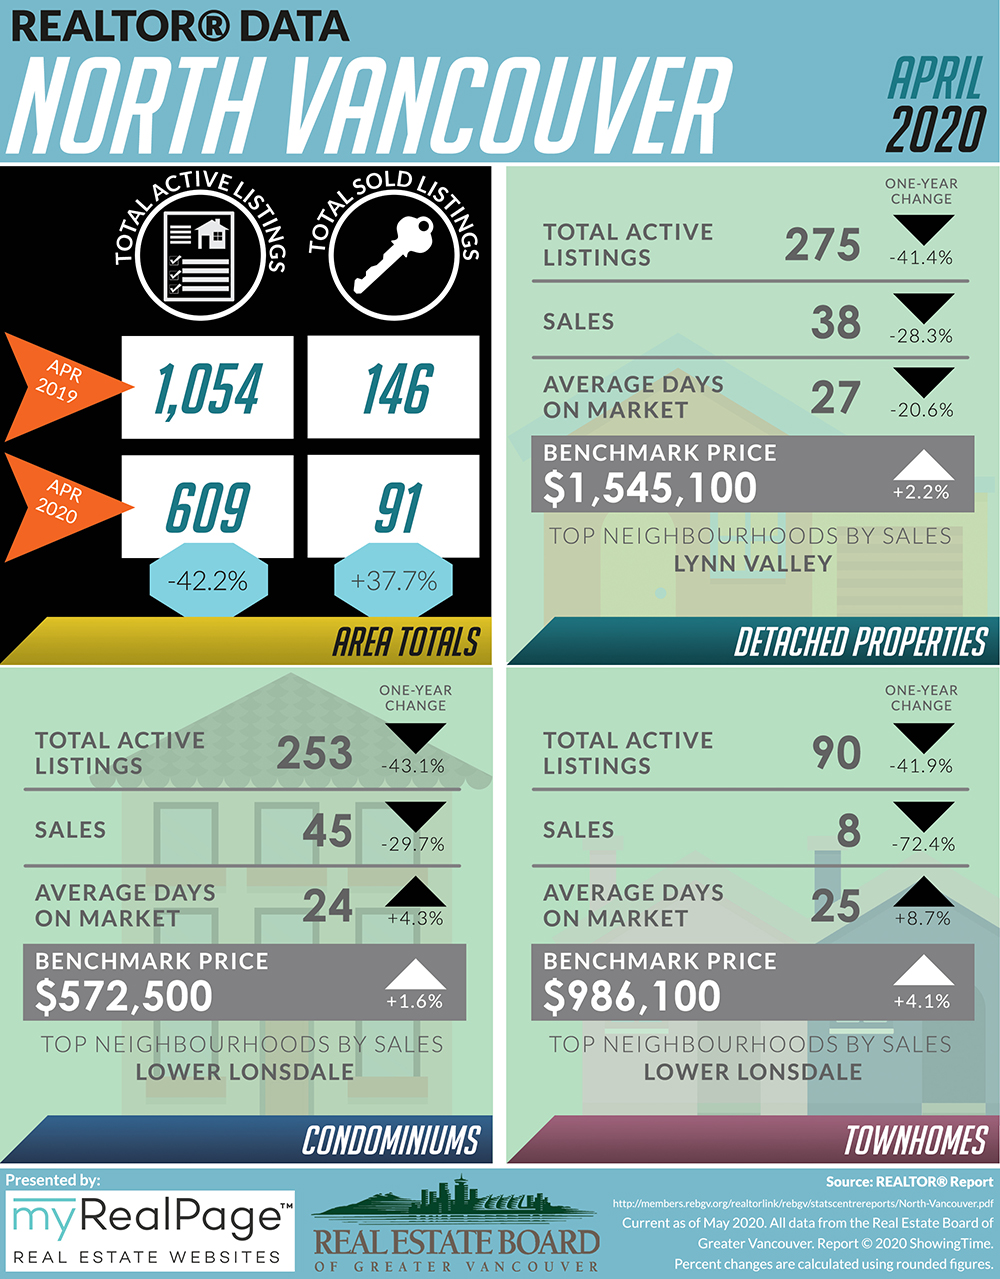
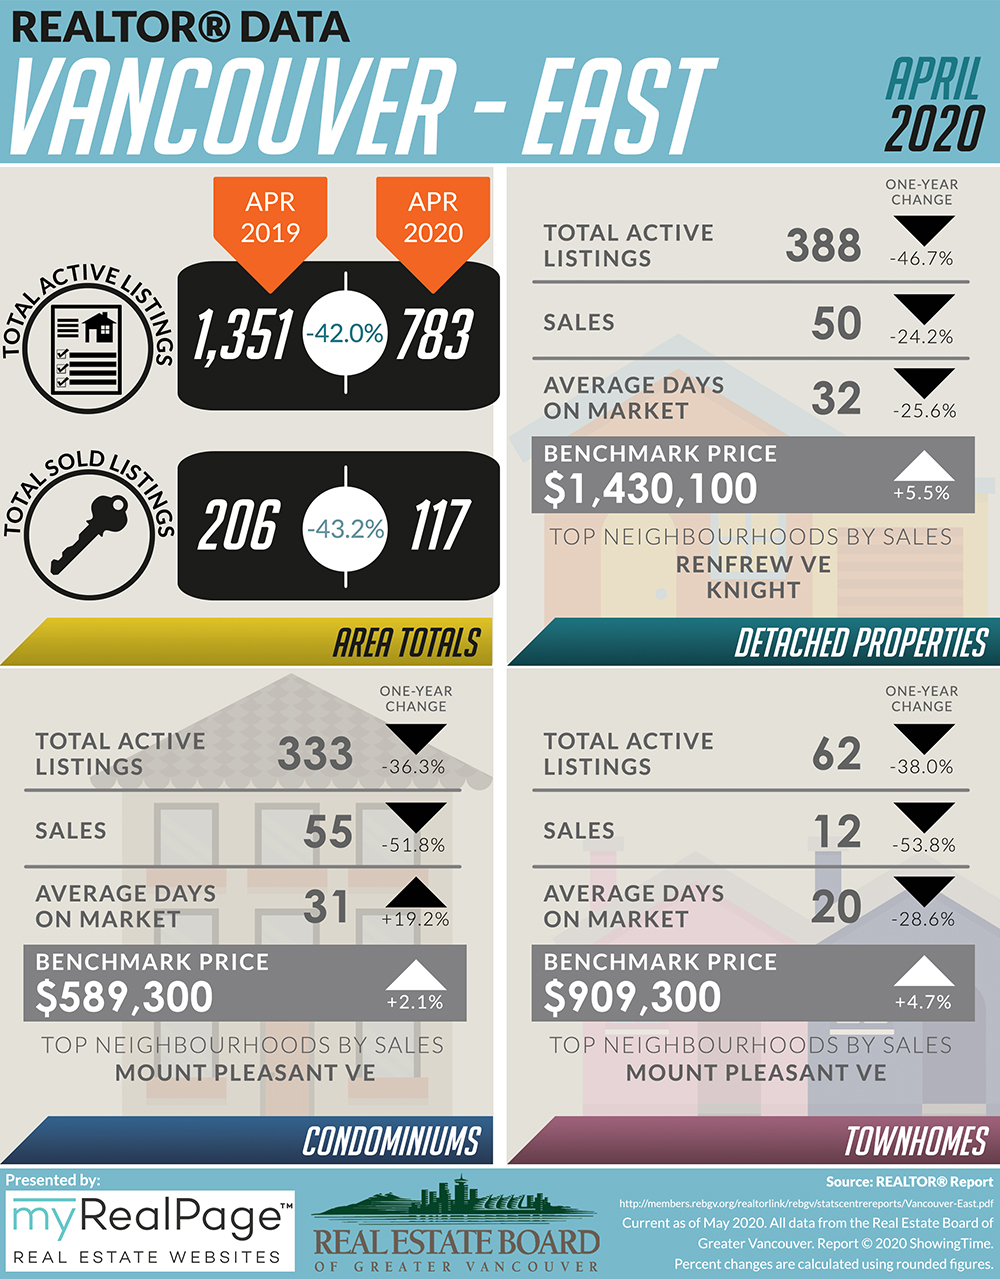
These infographics cover current trends in North Vancouver, West Vancouver, Vancouver East, and Vancouver West. Click on the images for a larger view! (Protip: Make sure to grab the printable PDF versions, too! It fits best when printed on A4-sized sheets, AND we’ve added an area on the sheet where you can attach your business card! 🙂 )
Download Printable Version – REBGV April 2020 Data Infographics


-

- (Image Source: REBGV Twitter)
-
- (Image from: REBGV.org)
Last Updated on July 25, 2022 by myRealPage
