INFOGRAPHICS: April 2021 VREB Victoria Market Reports

Housing in Greater Victoria remains in high demand
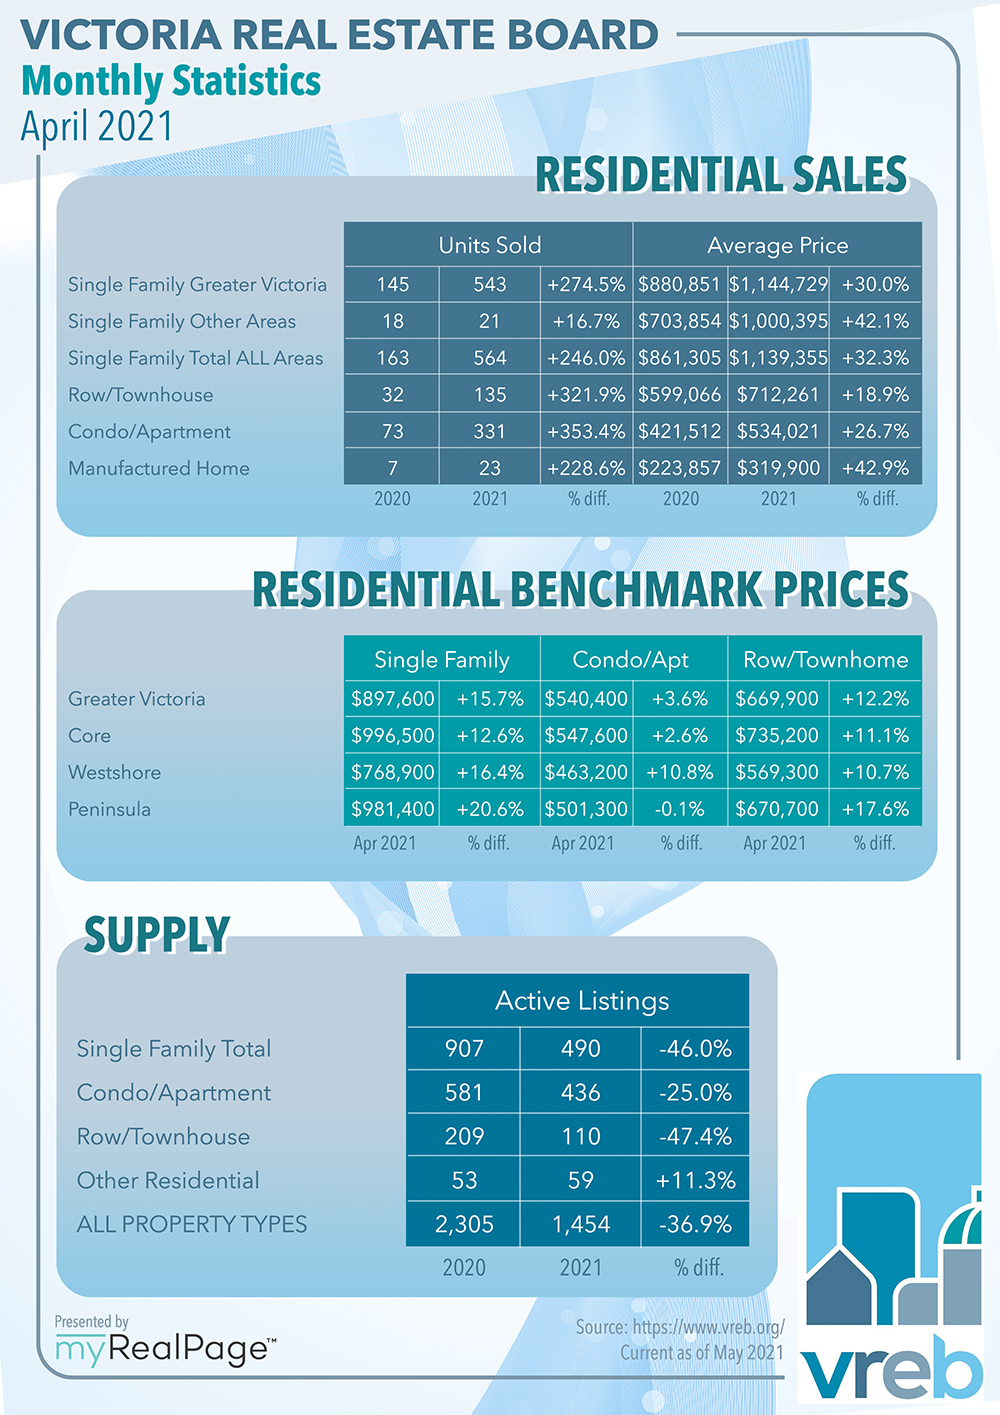
“Comparing last year’s April market to 2021 does not provide us any real insight into long term market trends,” said Victoria Real Estate Board President David Langlois. “Instead of comparing to last year’s numbers, we need to look at years before the pandemic to see how April 2021 compares to average. In the most recent five years pre-pandemic, the average number of sales in the month of April was 896. April 2016 holds the record for sales with 1,286 properties sold. The five-year average for active listings was 2,596, so we sit at more than one thousand homes fewer than a recent average level of inventory.”
Read the full report on the VREB website!
The following data is a comparison between April 2020 and April 2021 numbers, and is current as of May 2021. Click here to check out last month’s figures!
You can also follow this link for all our Victoria Board monthly infographics!
Click on the images for a larger view! (Protip: Make sure to grab the printable PDF versions, too! It fits best when printed on A4-sized sheets, AND we’ve added an area on the sheet where you can attach your business card! 🙂 )
Download Printable Version – April 2021 VREB, Victoria Market Report
Last Updated on July 25, 2022 by myRealPage
