INFOGRAPHICS: April 2022 FVREB Fraser Valley, South Surrey, Etc. Market Reports

Fraser Valley sales dip below 10-year average for first time in nearly two years
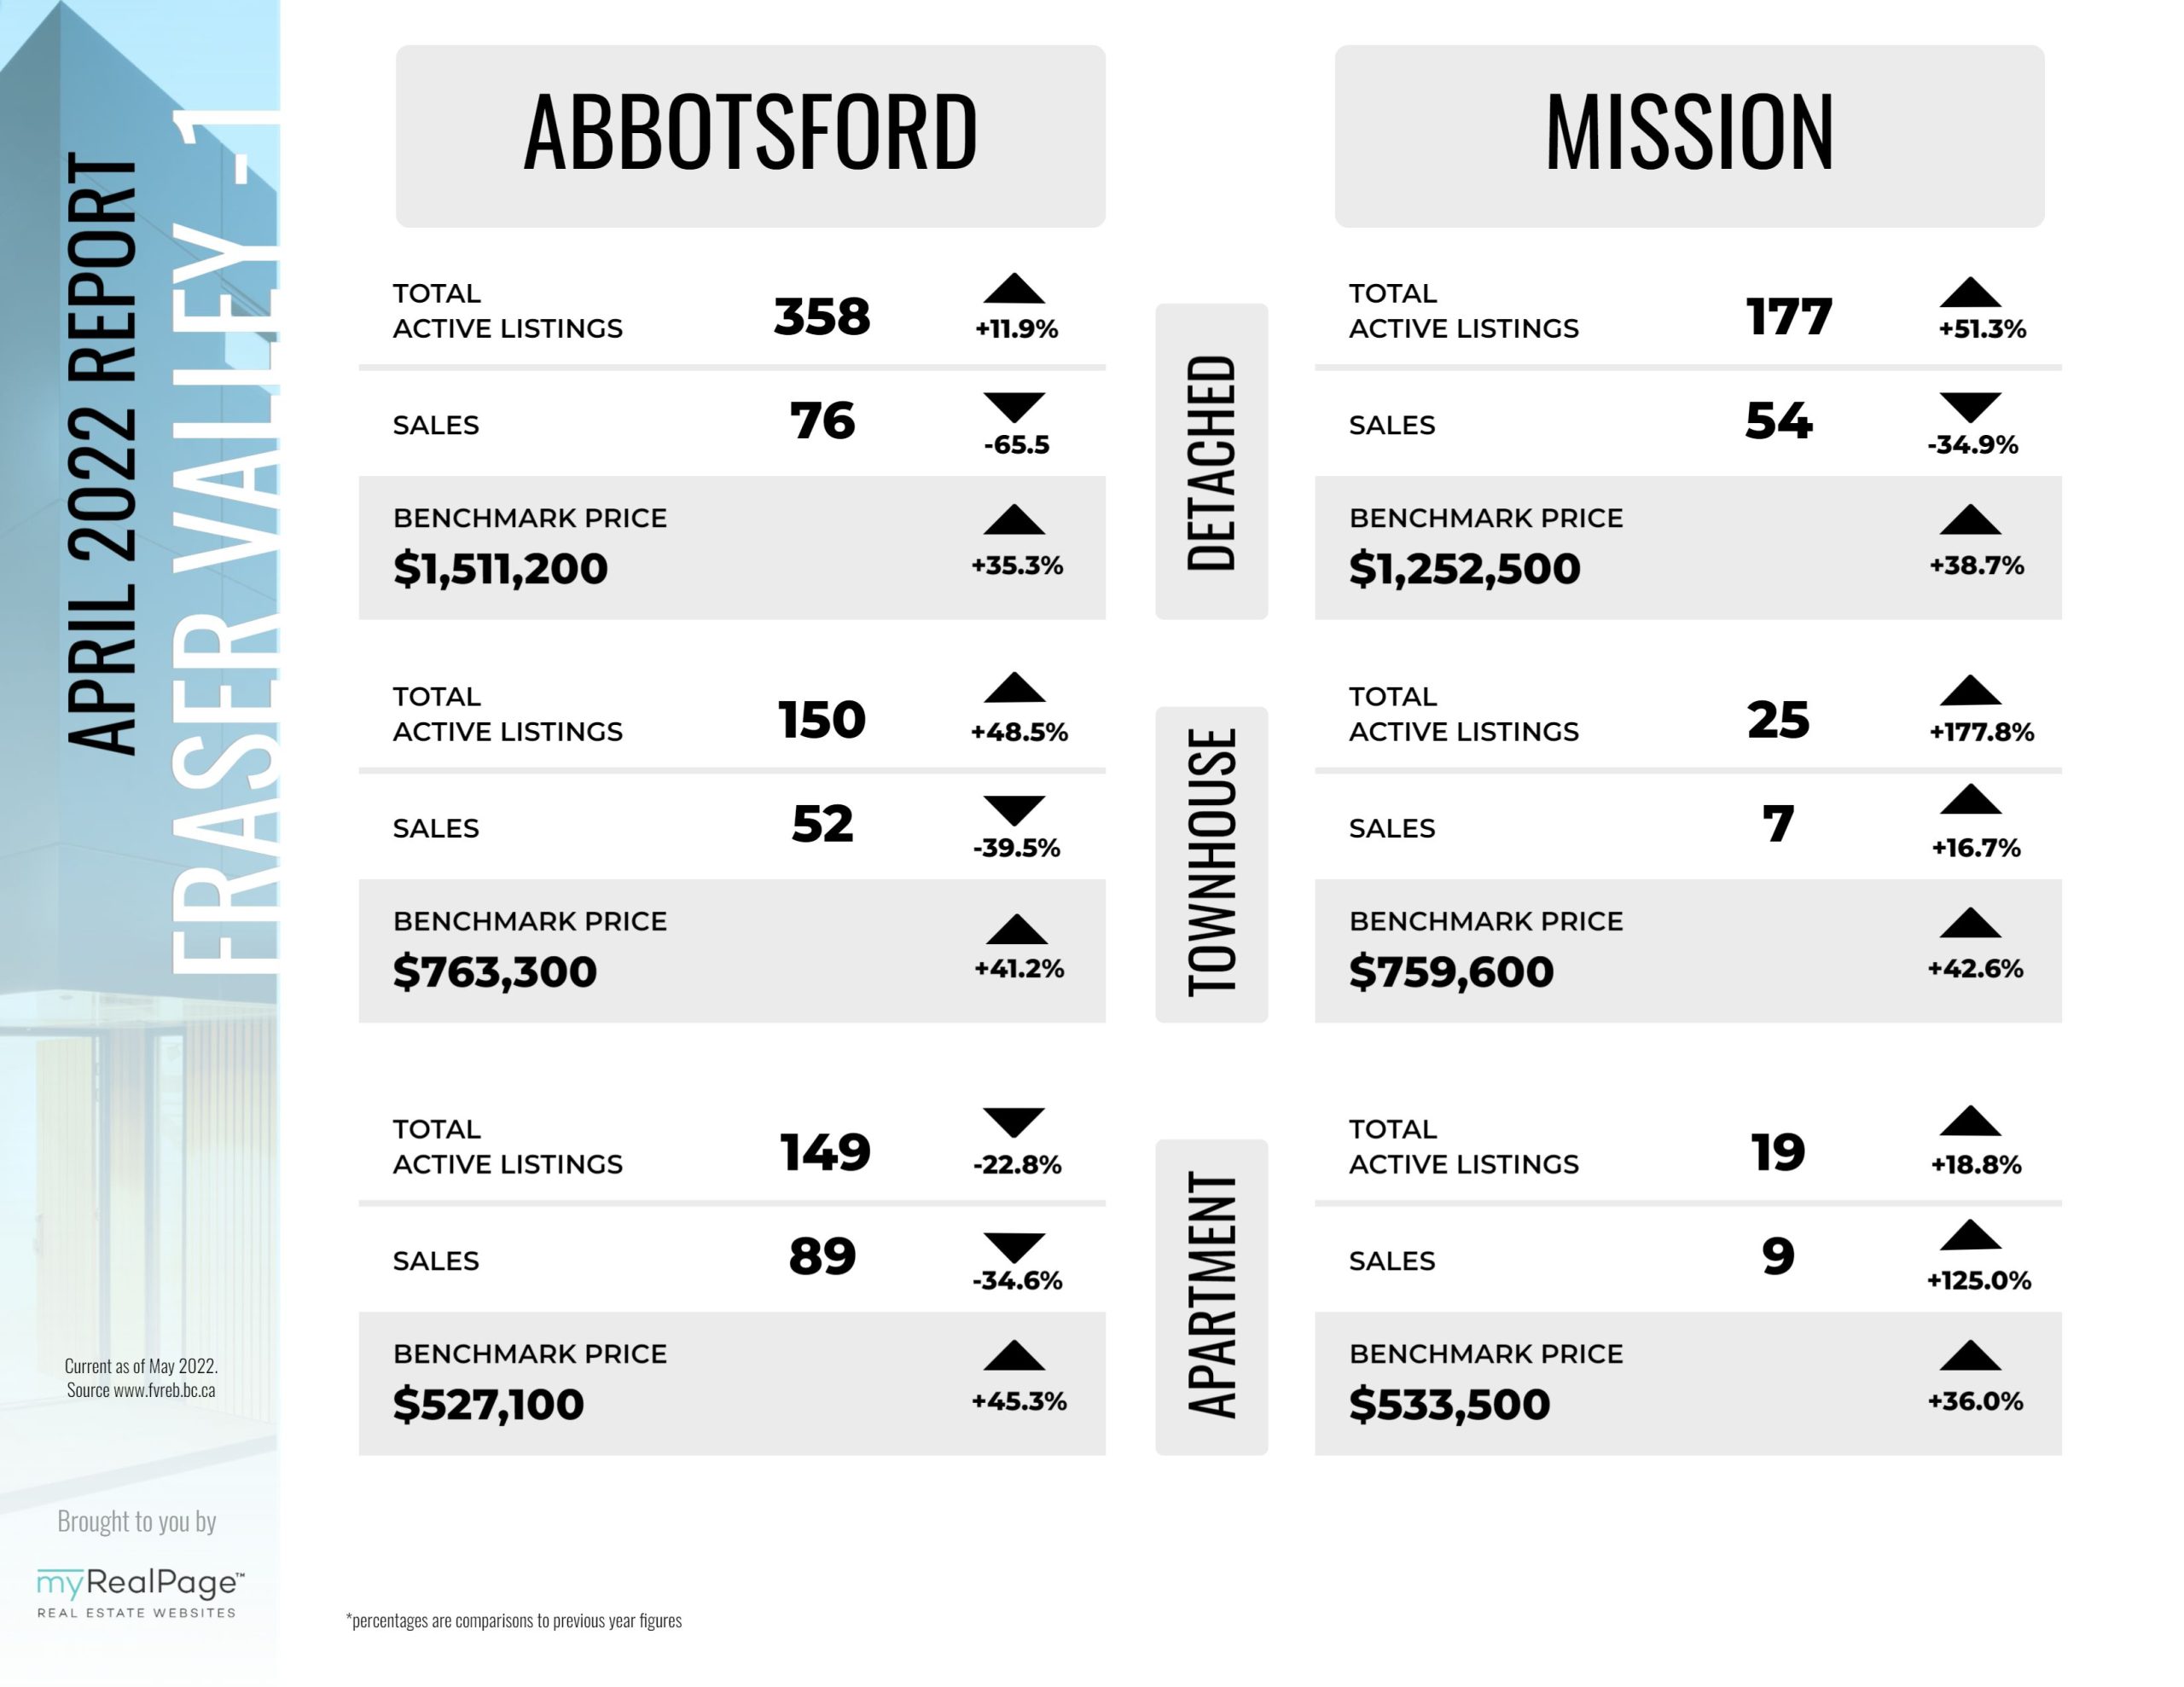
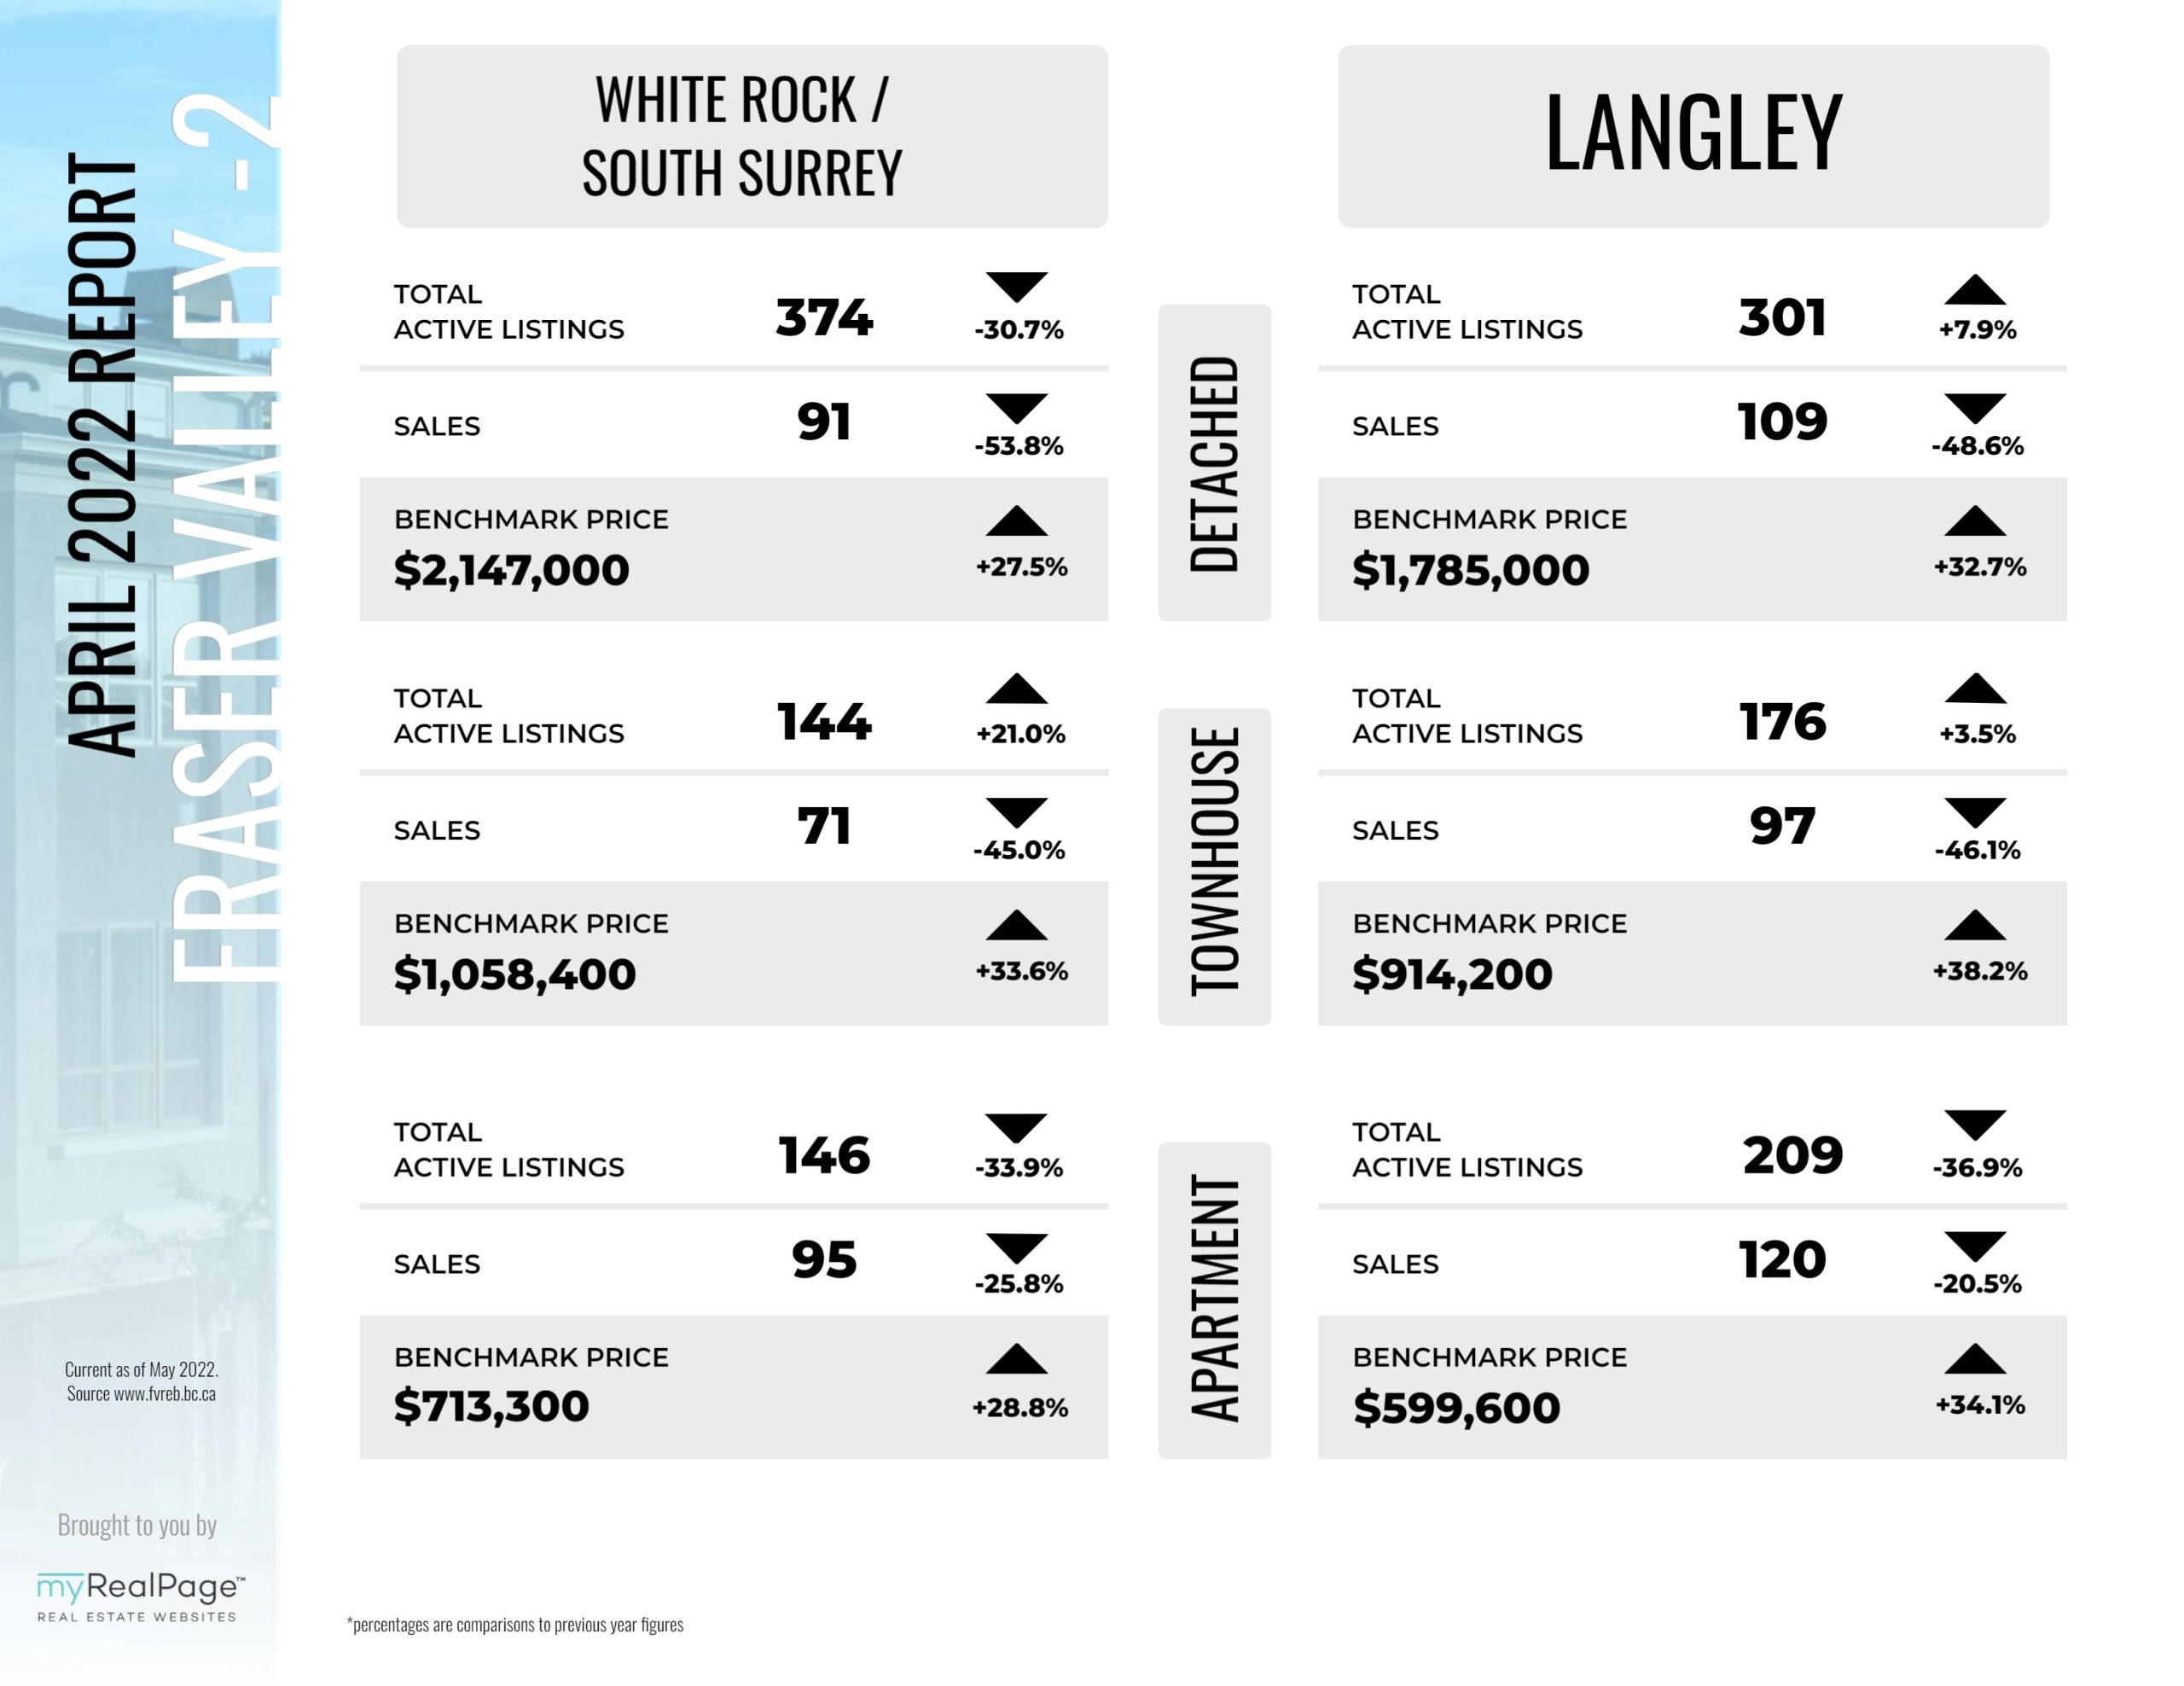
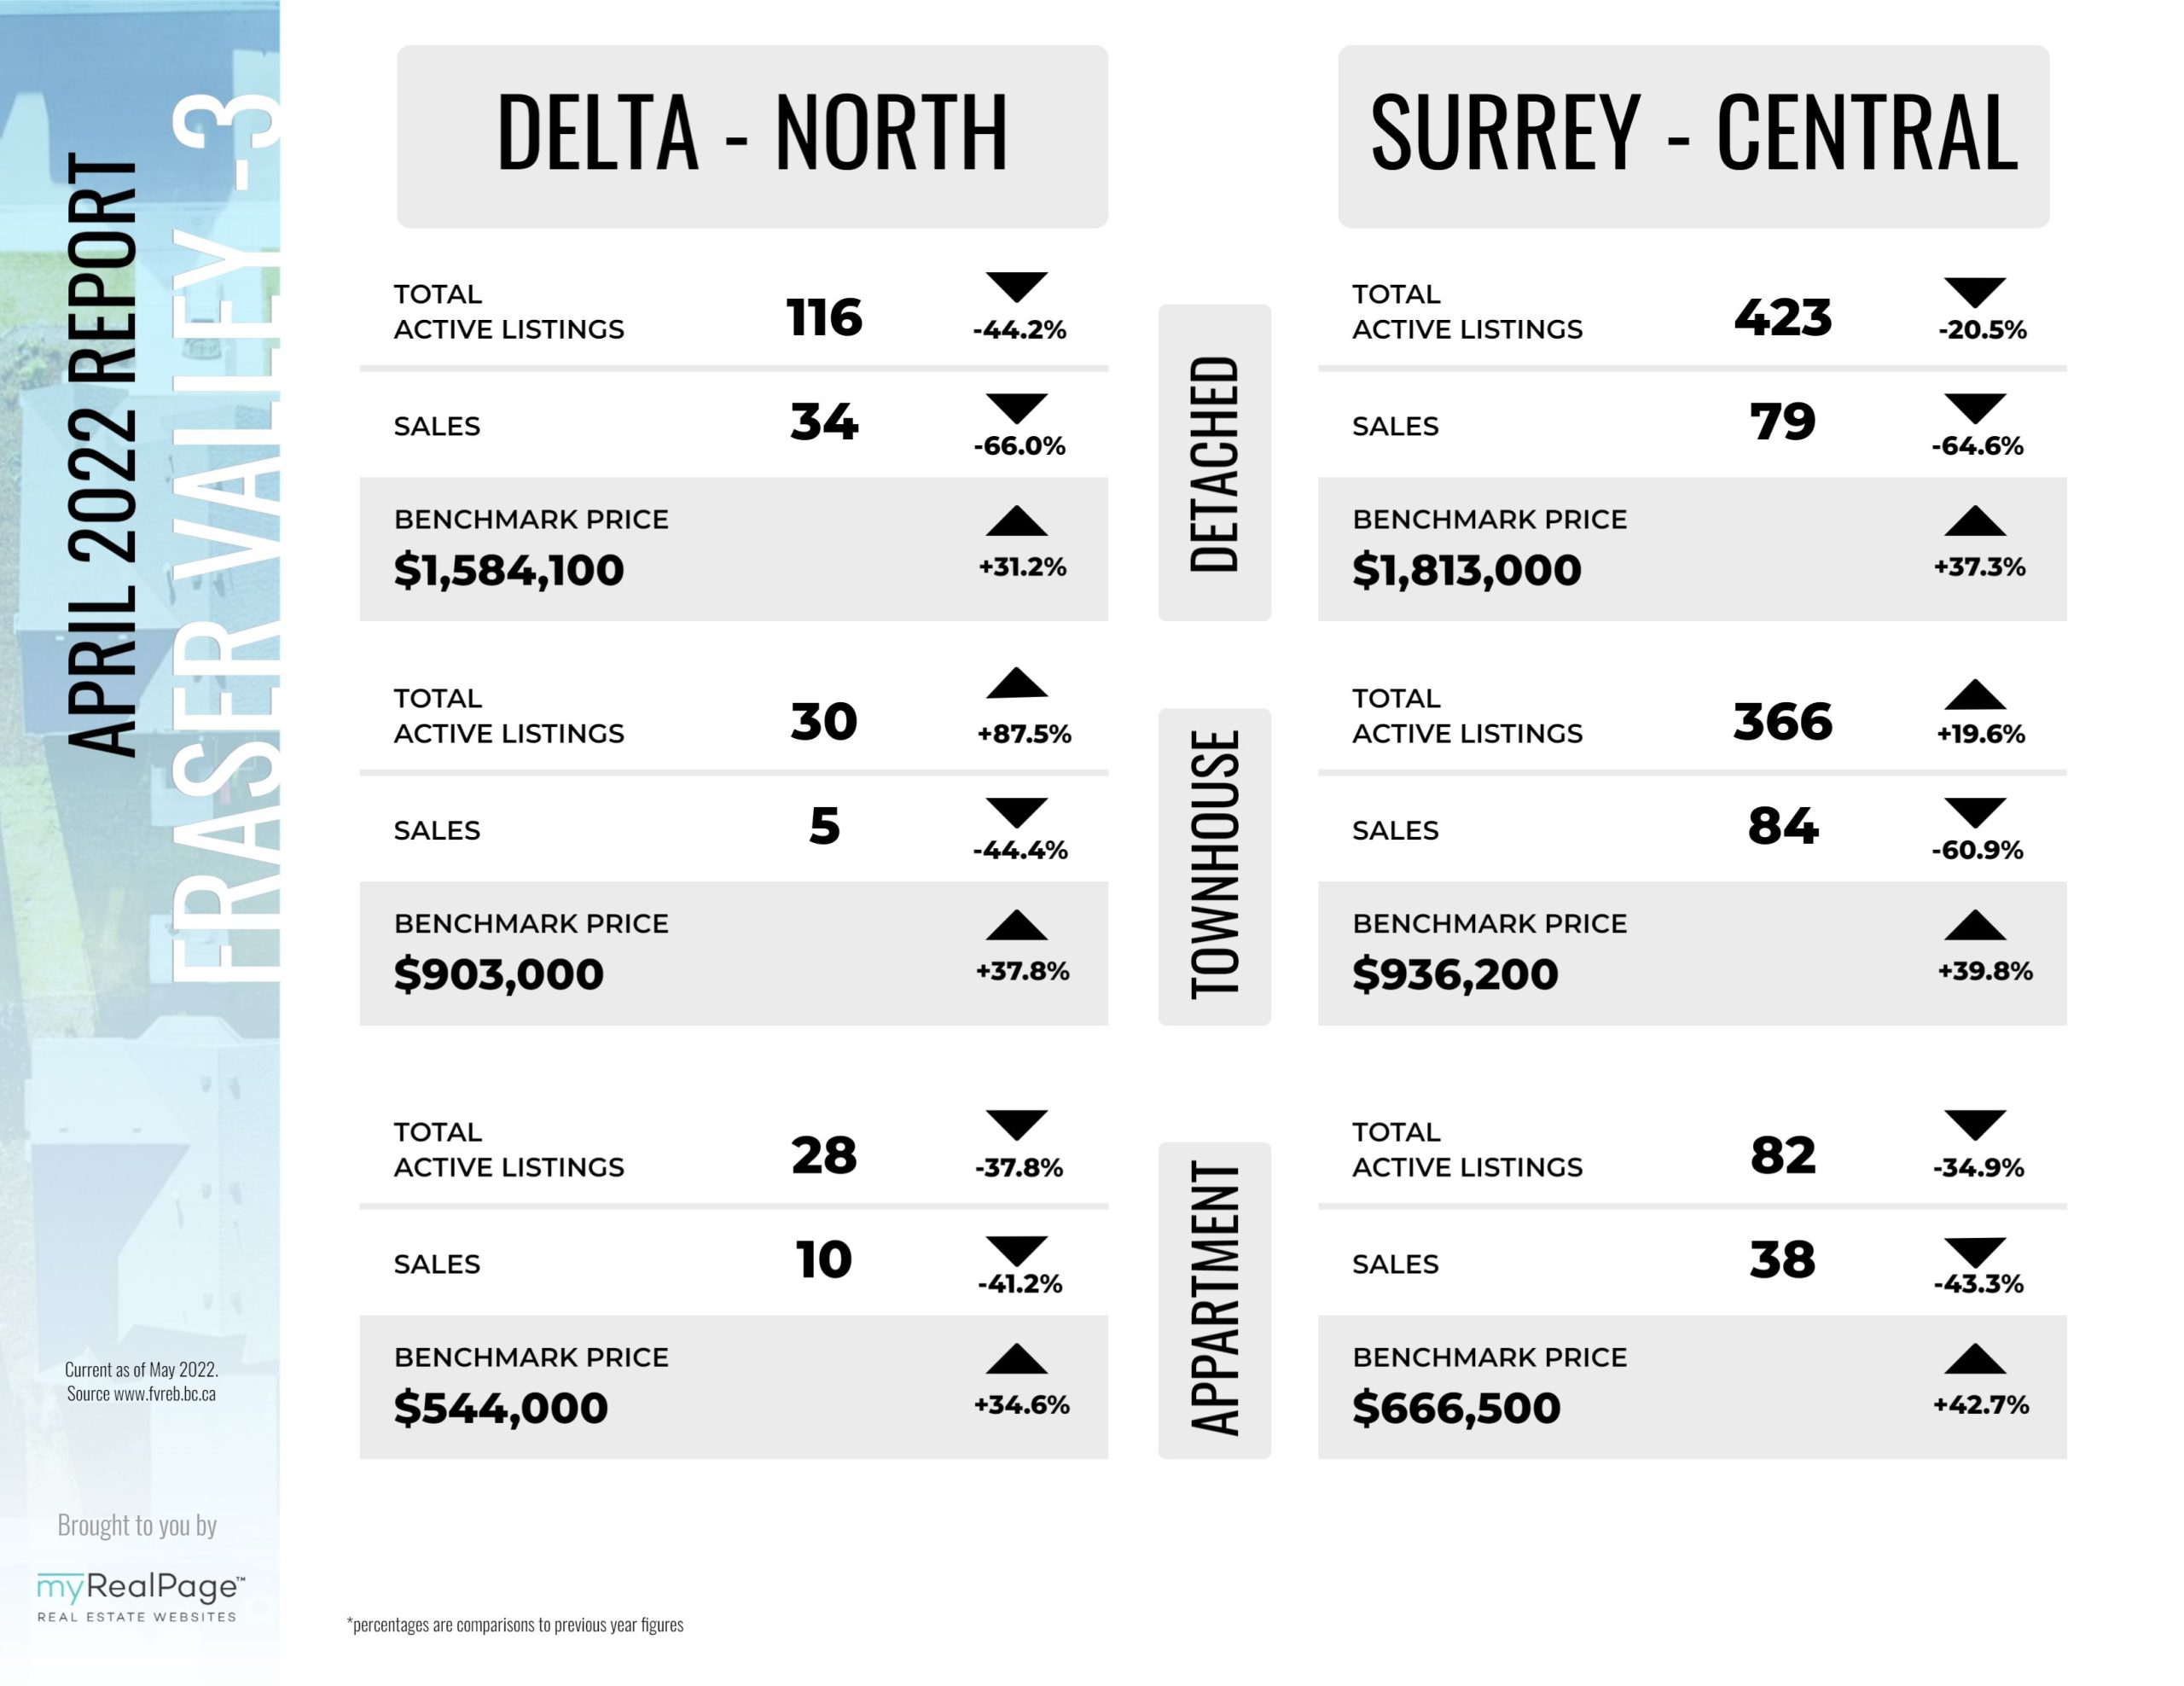
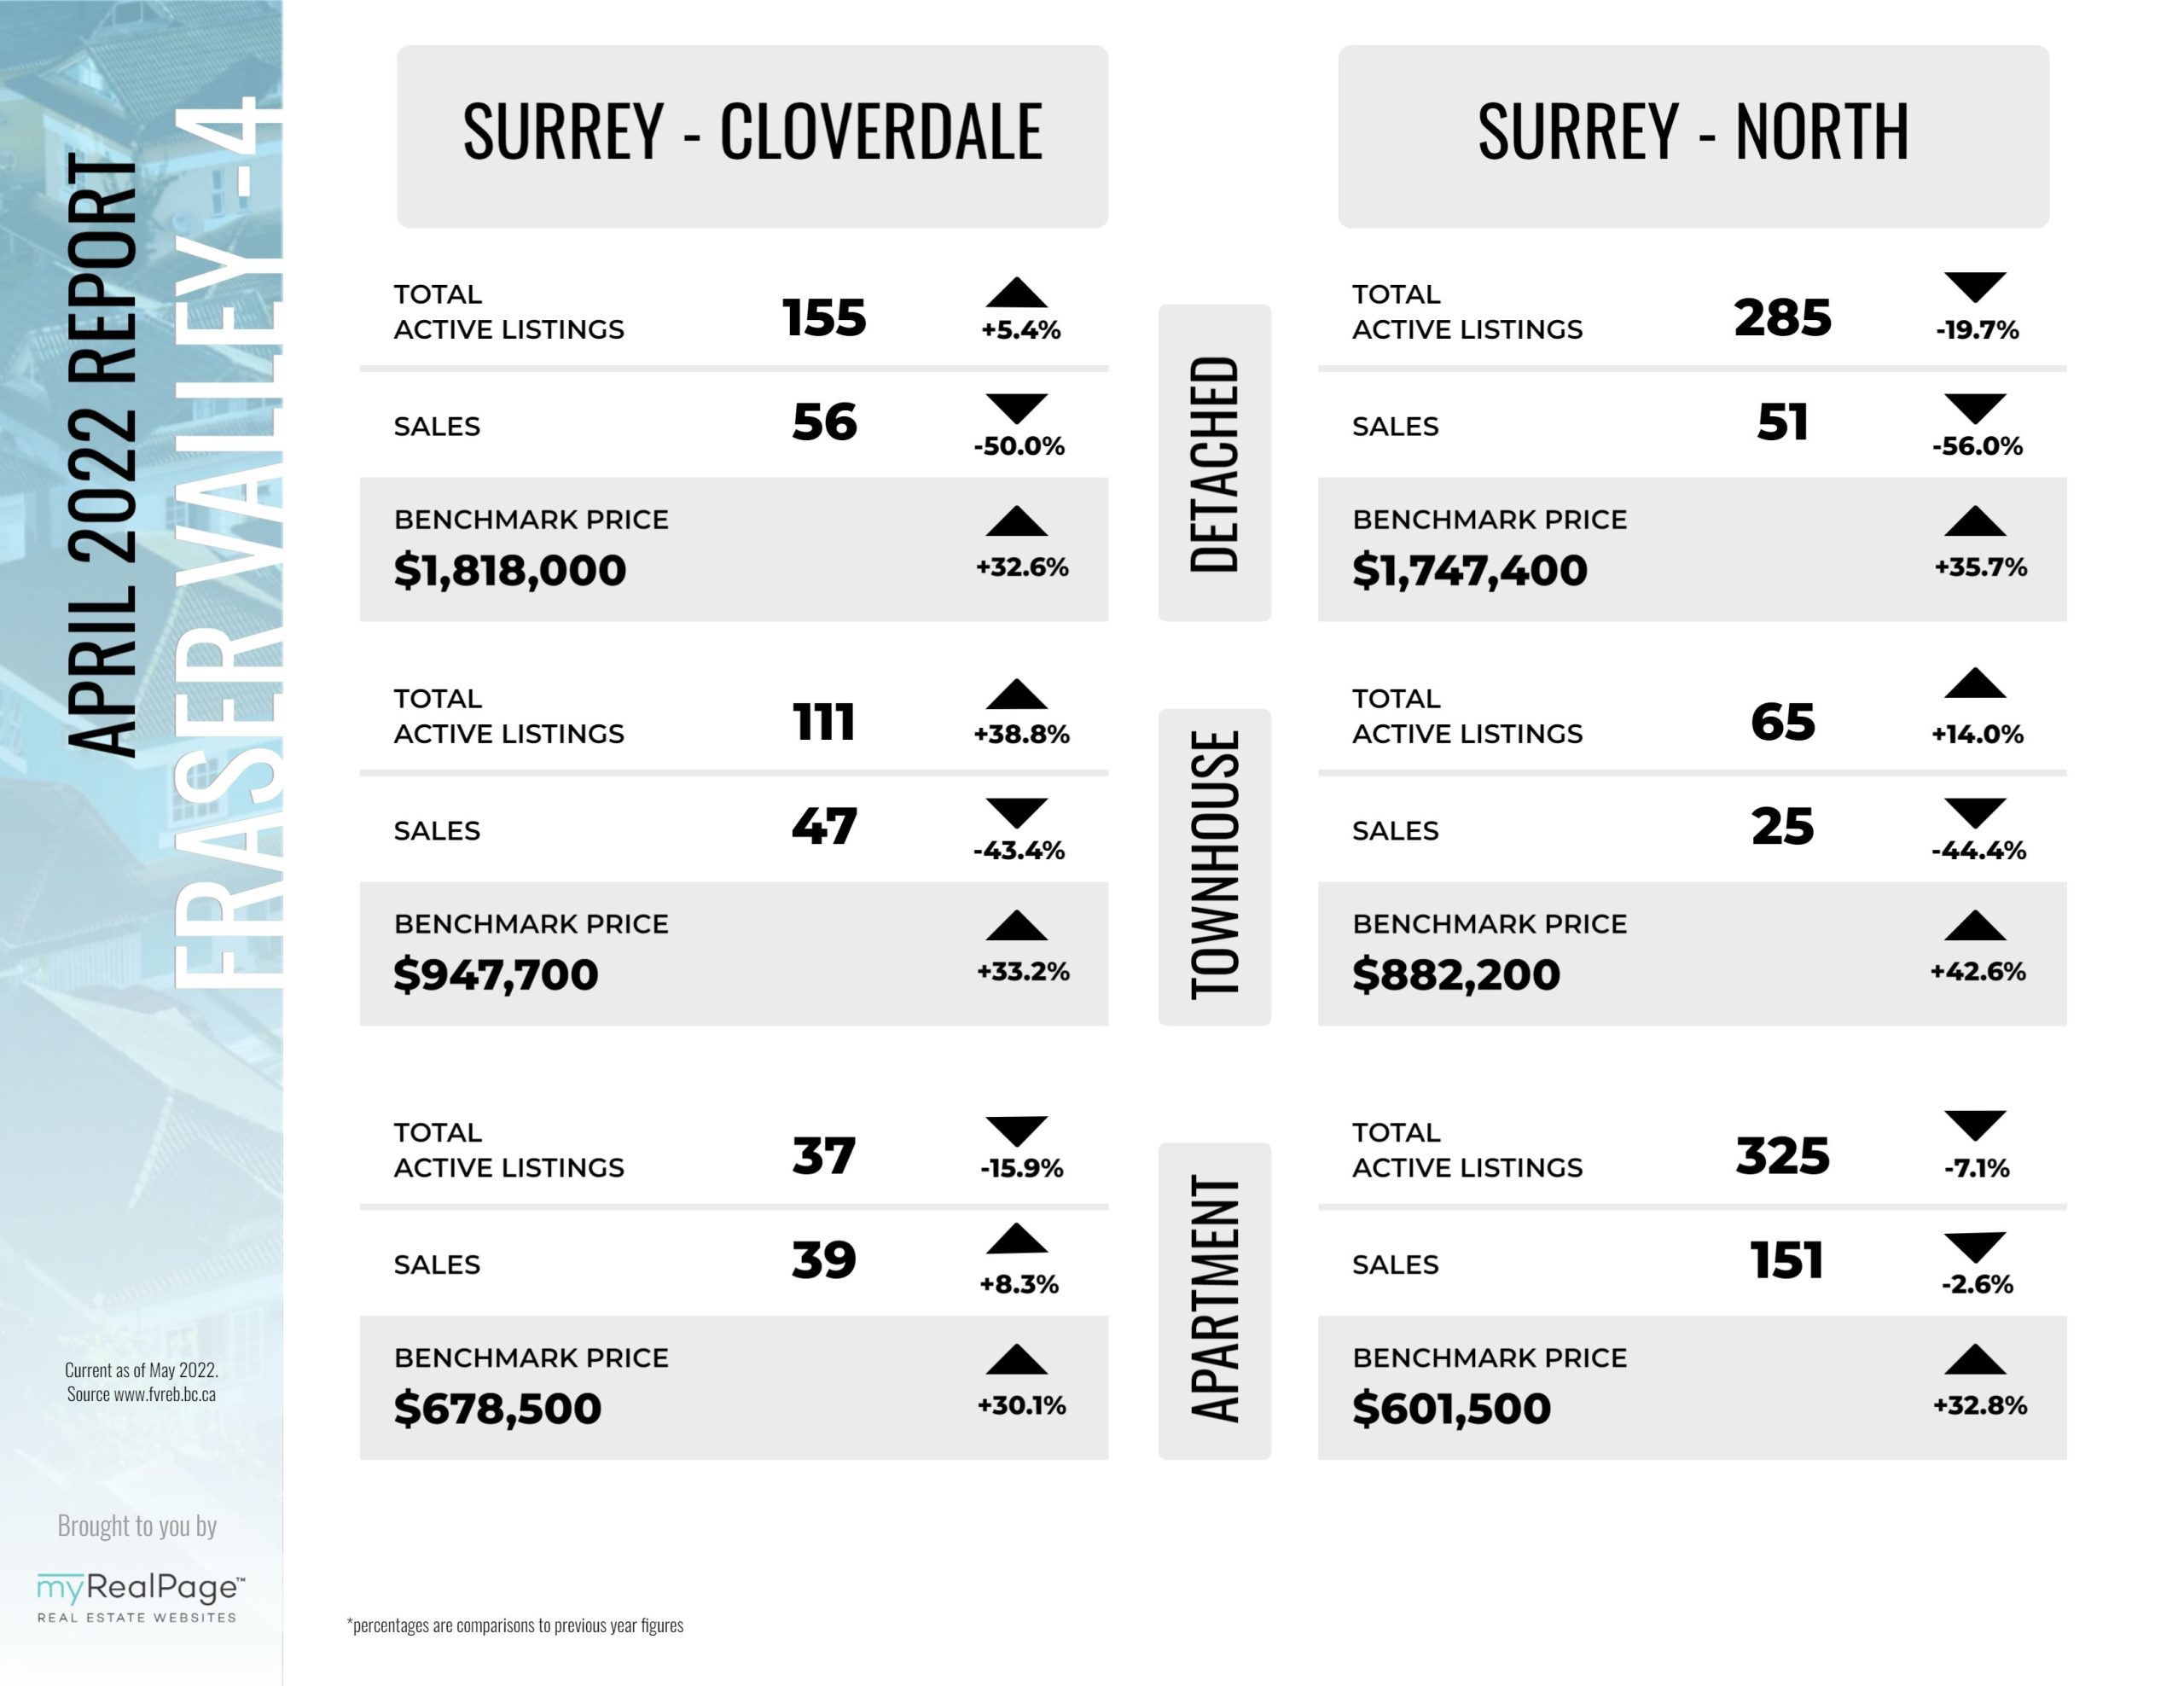
Property sales in the Fraser Valley decreased by over 35 per cent in April 2022 compared to the previous month, and while the figure is still the sixth-highest April on record for the past ten years, it marks the first time monthly sales have fallen below the ten-year average since June 2020.
In April, the Fraser Valley Real Estate Board (FVREB) processed 1,637 sales on its Multiple Listing Service® (MLS®), a decrease of 45.7 per cent compared to April 2021 and a 36.6 per cent decrease compared to March.
“We would typically see a flurry of activity around this time of the year,” said, FVREB President, Sandra Benz, “however that’s not been the case so far. While it’s still too early to say whether this trend will endure, the slowing of sales combined with an increase in active listings is helping to restore a semblance of balance to the market, which is encouraging for homebuyers.”
Read the full report on the FVREB website!
The following data is a comparison between April 2022 and April 2021 numbers, and is current as of May 2022. For last month’s report, check out our previous infographic!
Or follow this link for all our FVREB Infographics!
These infographics cover current trends in Fraser Valley neighbourhoods that are within the FVREB. Click on the images for a larger view!
Download Printable Version – FVREB April 2022 Market Report 1
Download Printable Version – FVREB April 2022 Market Report 2
Download Printable Version – FVREB April 2022 Market Report 3
Download Printable Version – FVREB April 2022 Market Report 4
Last Updated on July 25, 2022 by myRealPage
