INFOGRAPHICS: March 2022 FVREB Fraser Valley, South Surrey, Etc. Market Reports

March sees large number of listings hit the market
Buyers of Fraser Valley real estate had significantly more inventory to choose from last month due to a record-breaking volume of new listings received for the month of February.
The Fraser Valley Real Estate Board (FVREB) received 3,742 new listings in February, an increase of 75.3 per cent compared to January, and an increase of 14.6 per cent compared to February of last year. The previous highest February for new listings was 3,283 in 2016.
The FVREB processed a total of 1,824 sales of all property types on its Multiple Listing Service® (MLS®) in February 2022, a decrease of 35.2 per cent compared to February 2021, and 39.2 per cent higher compared to January 2022. Sales remain strong at 18 per cent above the 10-year average.
Read the full report on the FVREB website!
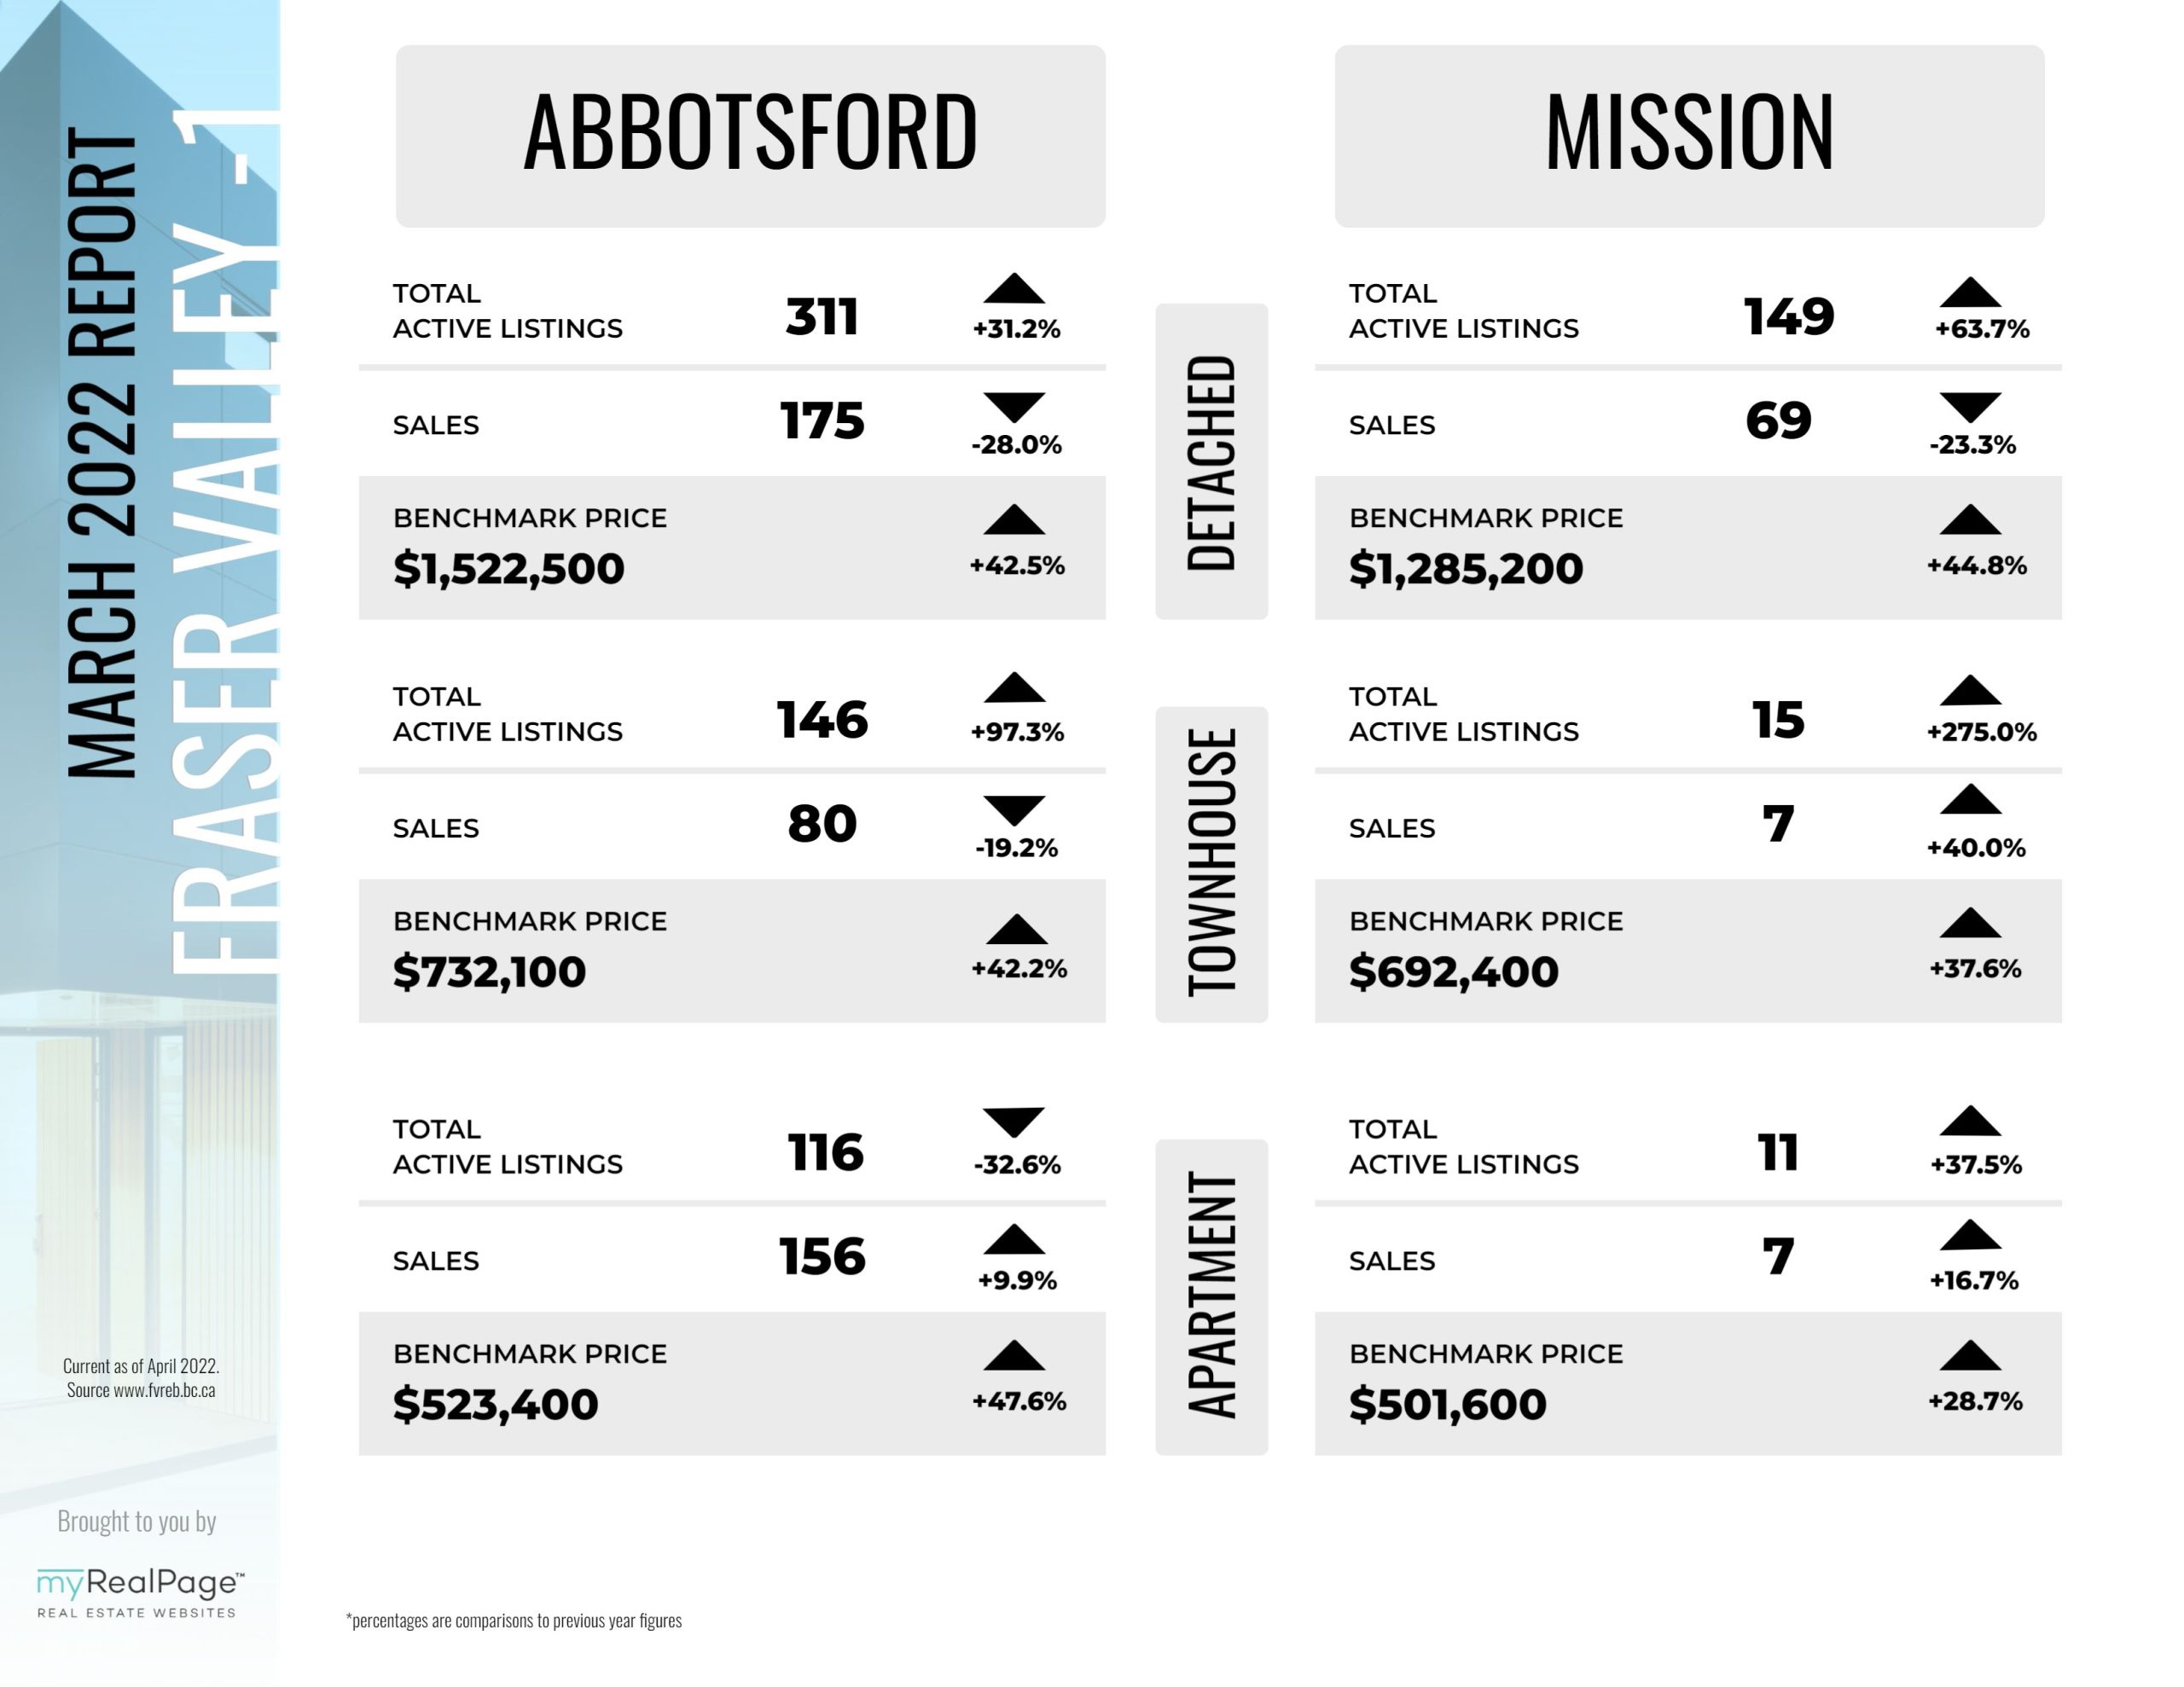
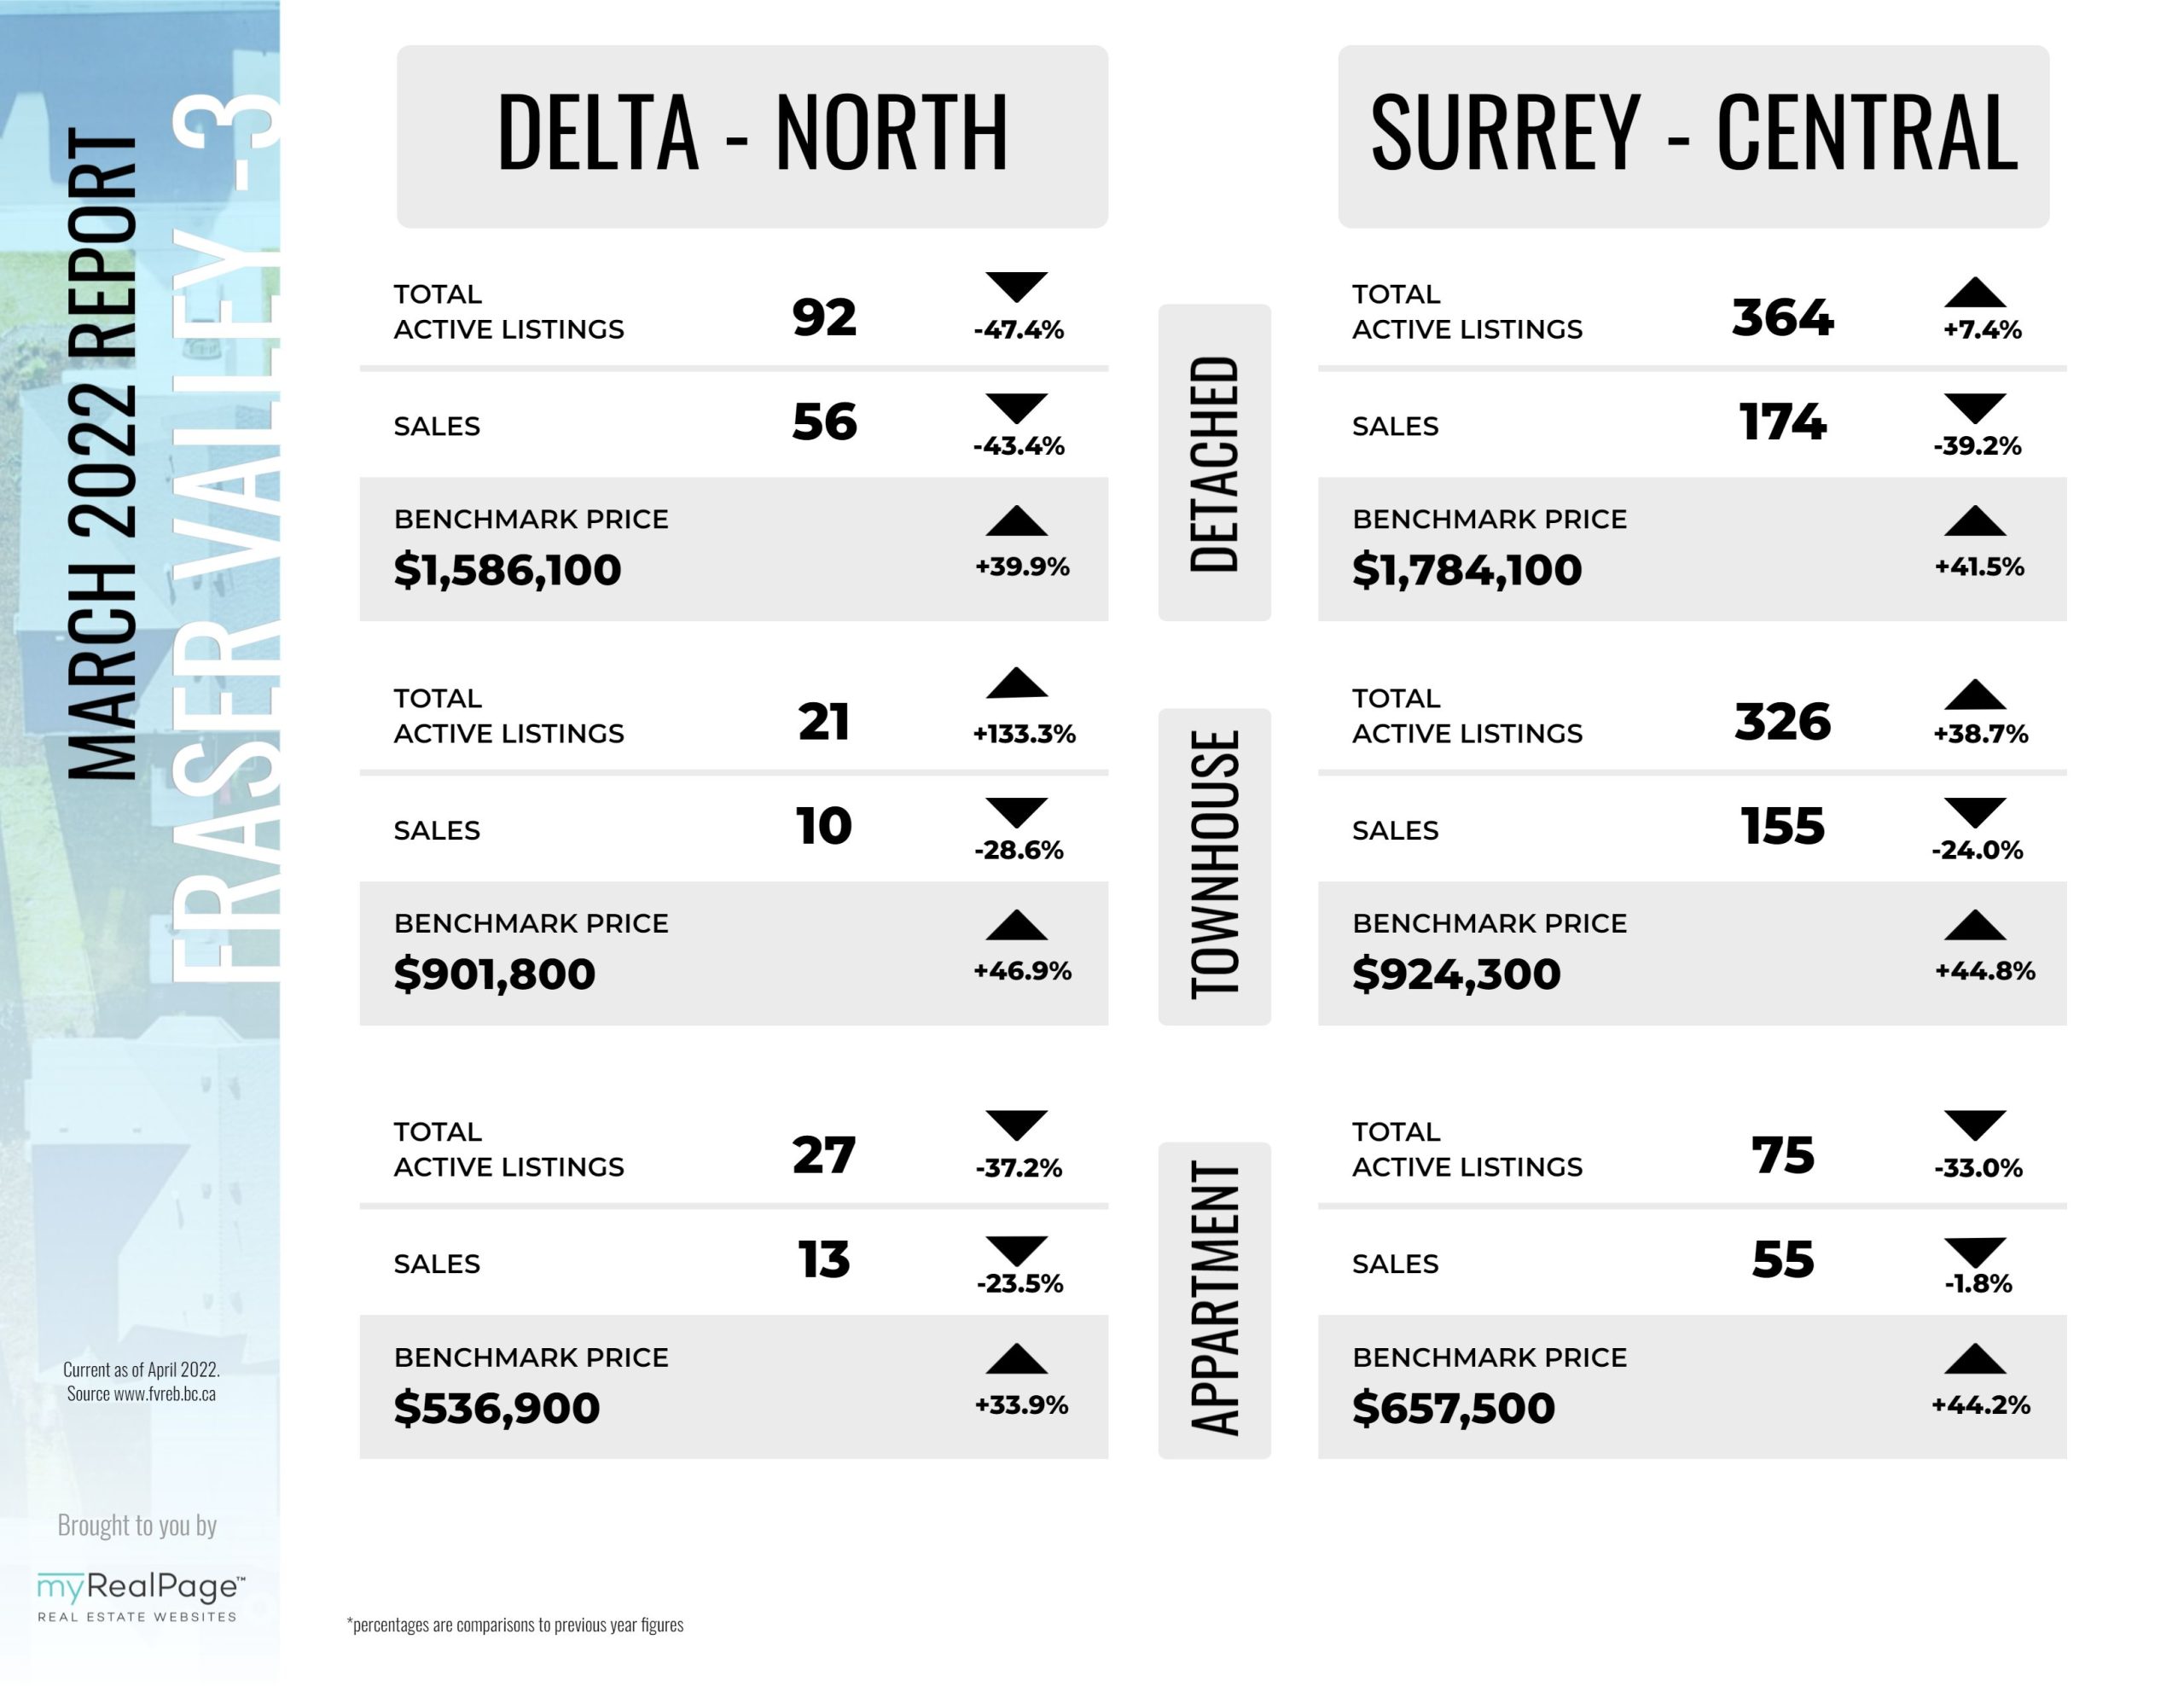
The following data is a comparison between March 2022 and March 2021 numbers, and is current as of March 2022. For last month’s report, check out our previous infographic!
Or follow this link for all our FVREB Infographics!
These infographics cover current trends in Fraser Valley neighbourhoods that are within the FVREB. Click on the images for a larger view!
Download Printable Version – FVREB March 2022 Market Report 1
Download Printable Version – FVREB March 2022 Market Report 2
Download Printable Version – FVREB March 2022 Market Report 3
Download Printable Version – FVREB March 2022 Market Report 4


Last Updated on July 25, 2022 by myRealPage
