INFOGRAPHICS: August 2018 FVREB Fraser Valley, South Surrey, Etc. Market Reports

Once again, it’s time for our monthly update on the Fraser Valley markets that are fall within the Fraser Valley Real Estate Board (FVREB).
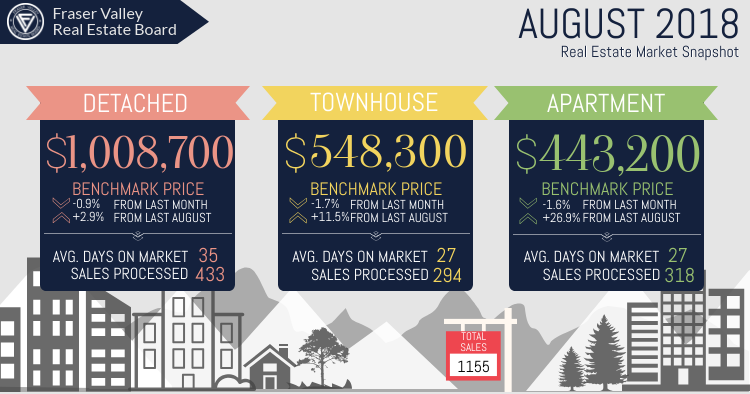
This year’s summer season seems to be on a downswing at the moment, as FVREB reports in their most recent press release that Fraser Valley has seen further decline in activity in August.
According to John Barbisan, President of the Board:
“With demand slowing down and prices staying put, both buyers and sellers can expect to see an easing of competition with less multiple offer situations. … Right now, effective pricing is key and will be the determining factor for a successful transaction.”
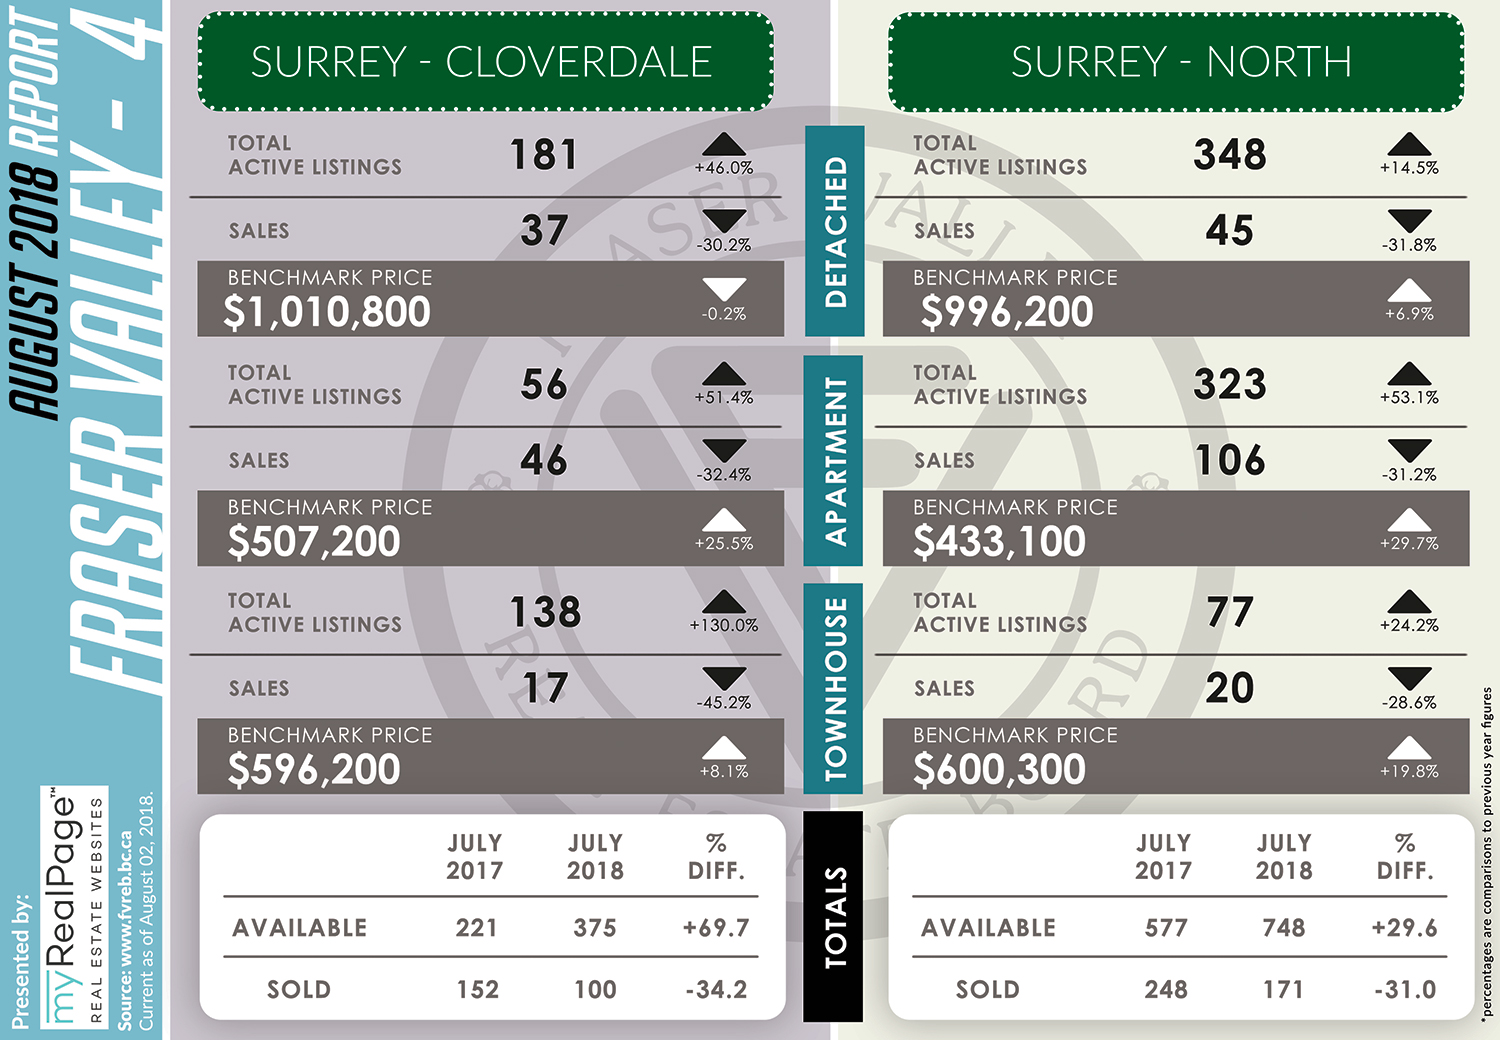
There has been a 28.5% increase for total active inventory within Fraser Valley, in comparison with the inventory in August 2017. It has also been reported that the average days on market for apartments this month is 27 days, while single family detached homes were available for an average of 35 days.
(Image Source: https://www.facebook.com/FVREB/ )
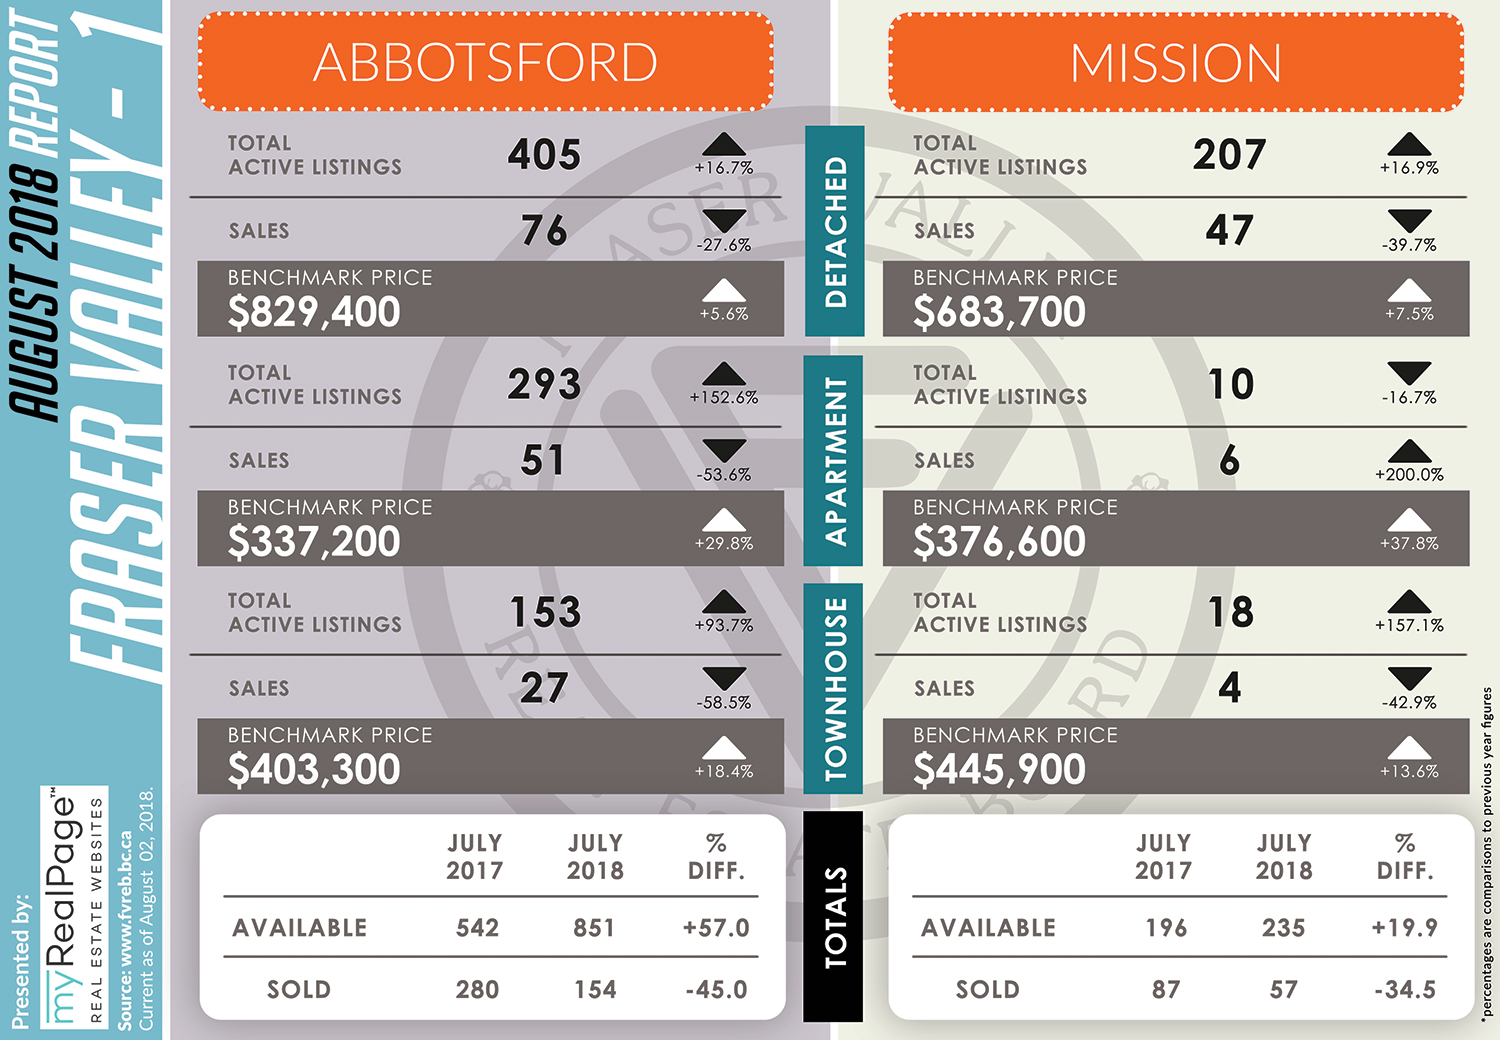
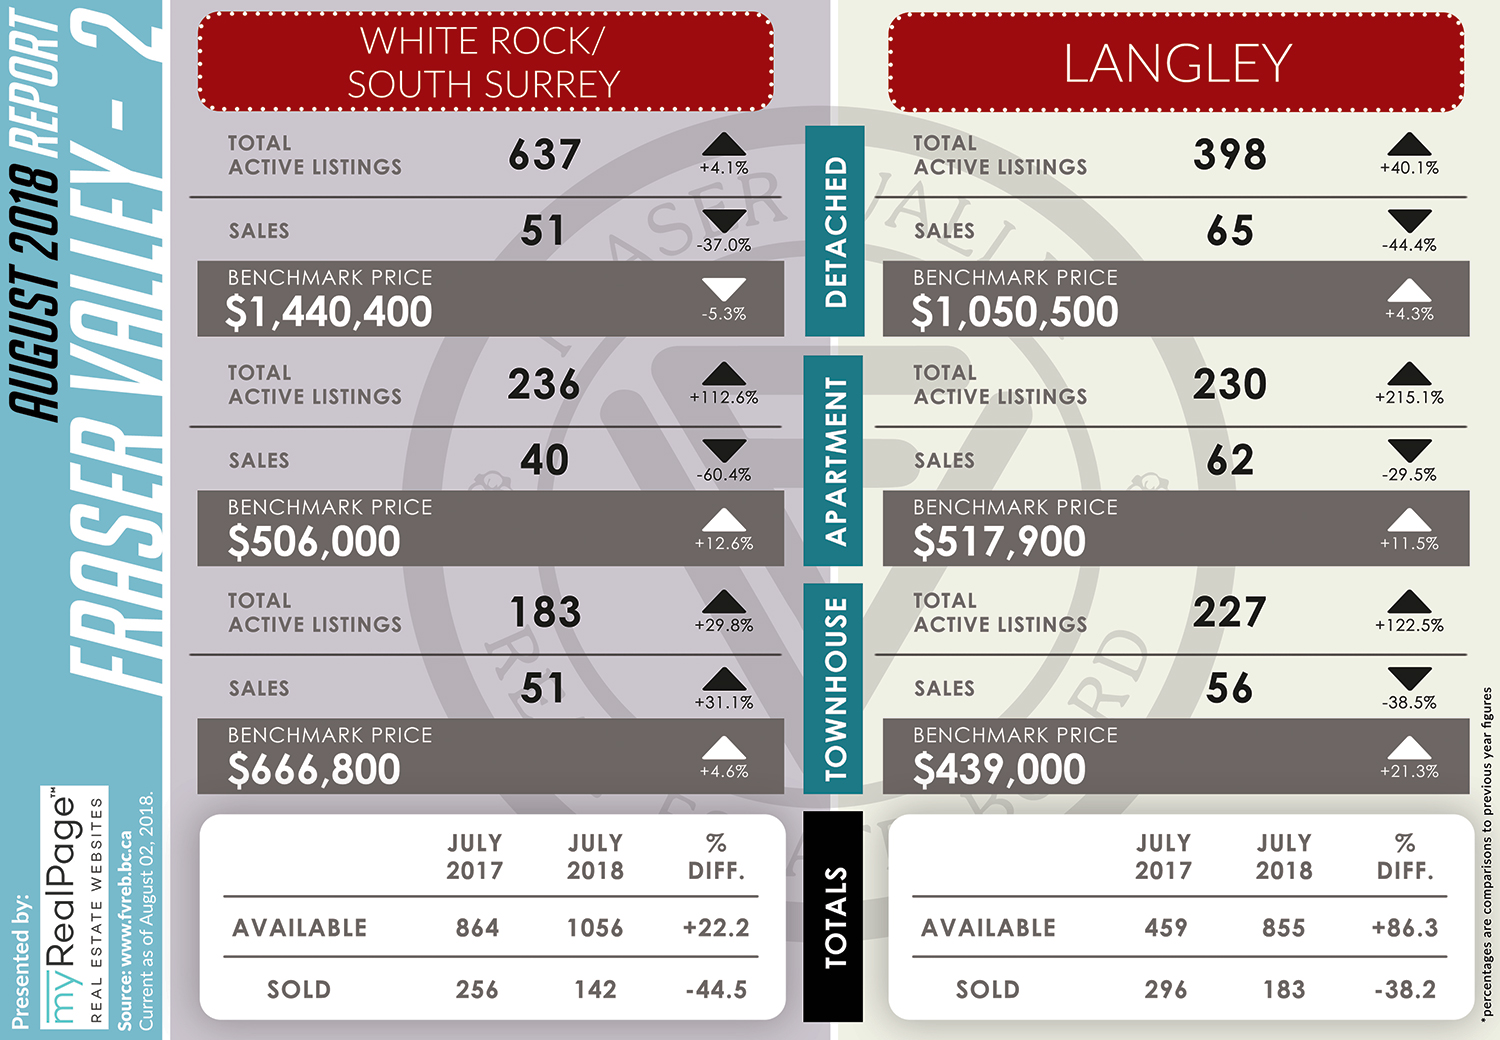
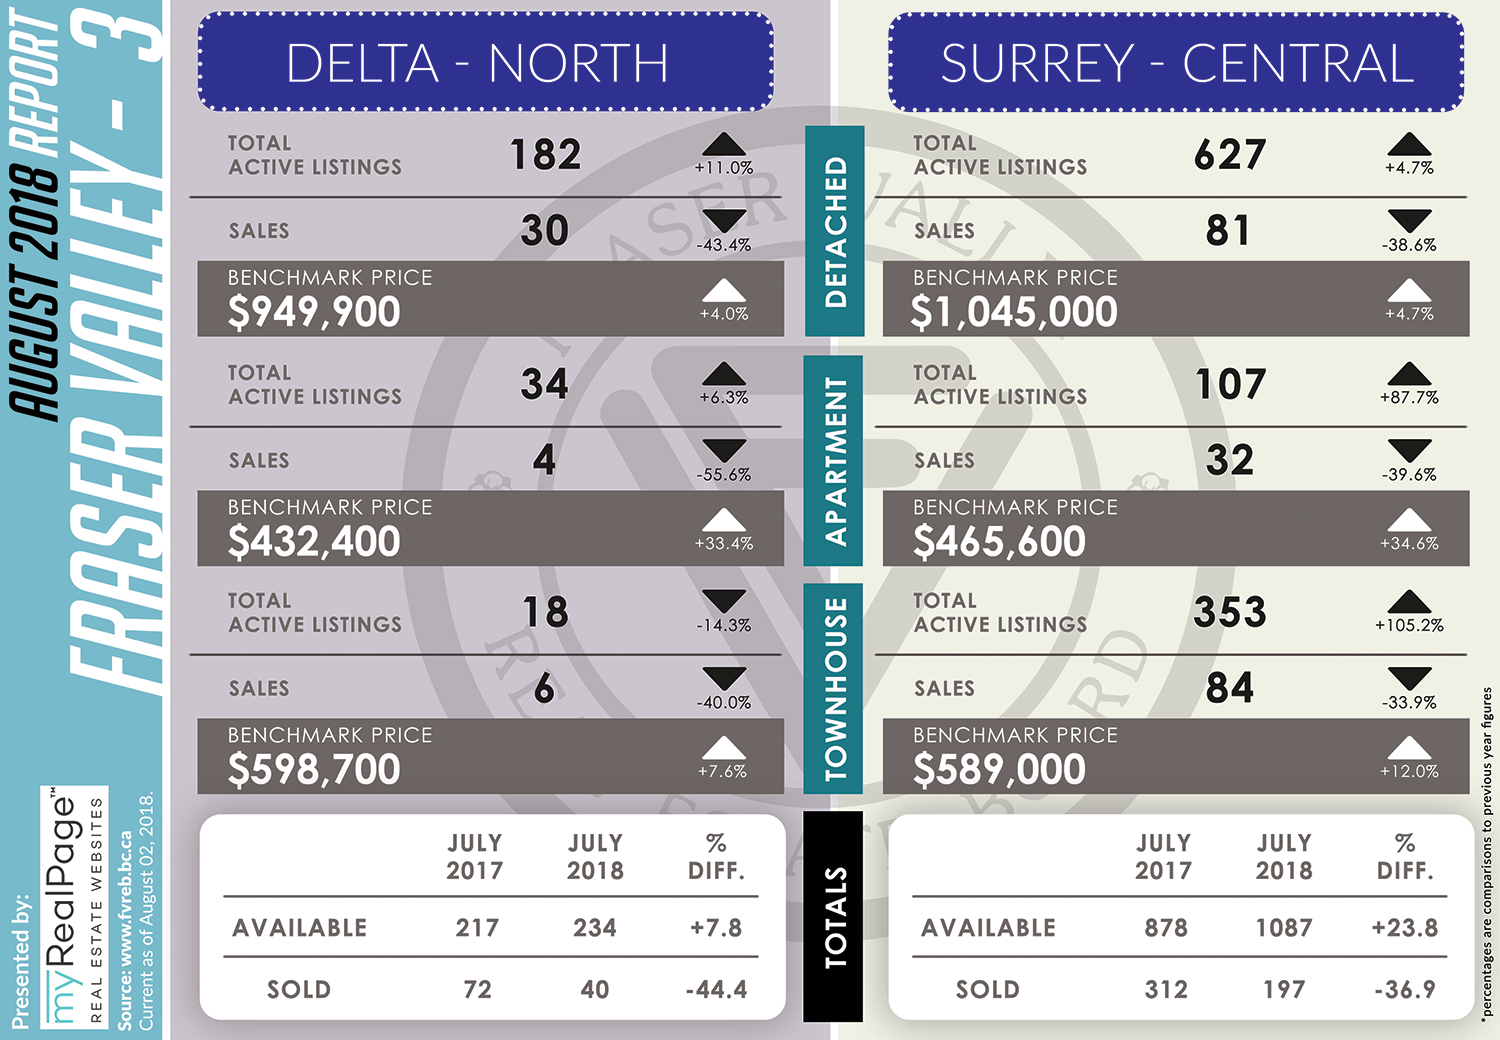
The following data is a comparison between August 2017 and August 2018 numbers, and is current as of September 6, 2018. For last month’s report, check out our previous infographic! Or follow this link for all our FVREB Infographics!
These infographics cover current trends in Fraser Valley neighbourhoods that are within the FVREB.
Click on the images for a larger view!
(Protip: Make sure to grab the printable PDF version, too! It fits best when printed on A4-sized sheets, AND we’ve added an area on the sheet where you can attach your business card! 🙂 )
Download Printable Version – FVREB August 2018 Market Report
Last Updated on July 25, 2022 by myRealPage
