INFOGRAPHICS: July 2018 FVREB Fraser Valley, South Surrey, Etc. Market Reports

For this month’s updates for the markets covered by the Fraser Valley Real Estate Board (FVREB), it appears that there is a cool down right in the middle of the summer.
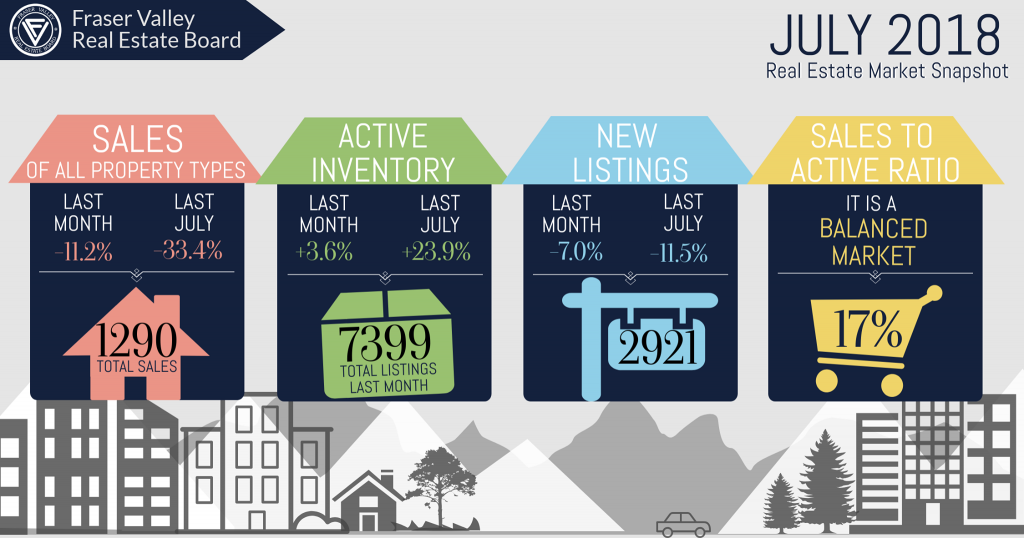
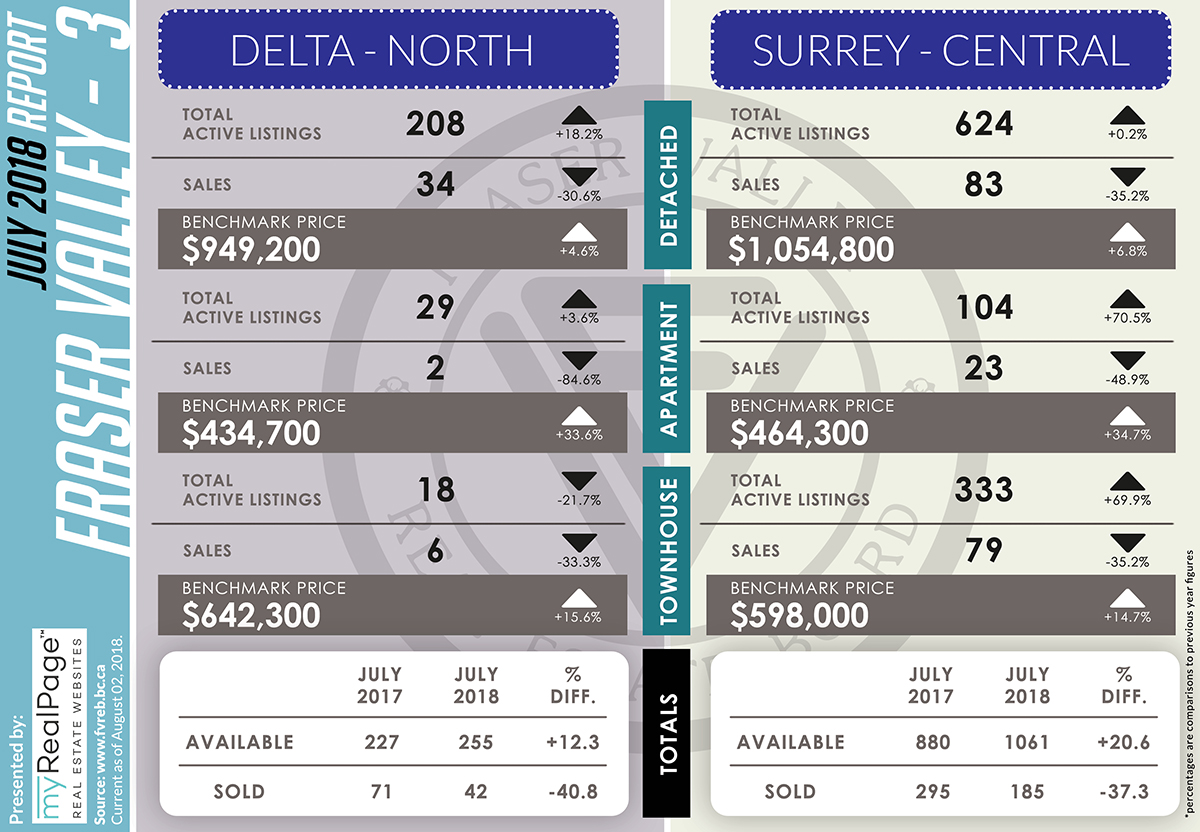
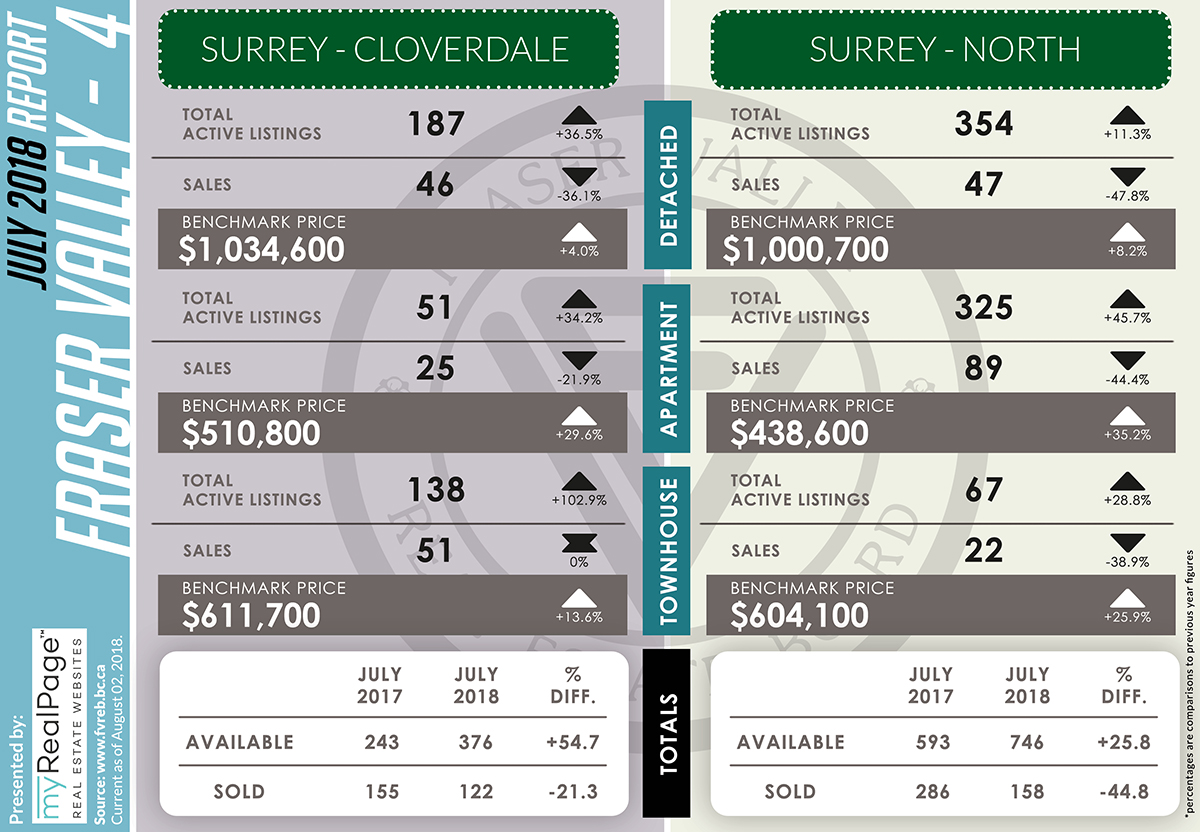
As per FVREB’s latest media release, overall housing supply continued to grow in July as sales dropped to their lowest point this year since January. Active inventory for the Fraser Valley in July finished at 7,399 listings, increasing 3.6% month-over-month and 23.9% year-over-year.
Board President John Barbisan notes, however, this is not an unusual or unexpected event. According to Barbisan,
“Despite a much healthier level of inventory, demand continues to be influenced by pricing and market barriers such as the mortgage stress test and rising interest rates. On top of that, summer is busy for people and usually a slow season for real estate.”
He is also remains optimistic that a slower market might provide better opportunities for buyers to explore their options, and enjoy a more relaxed purchasing environment.
(Image Source: https://twitter.com/FVREB)
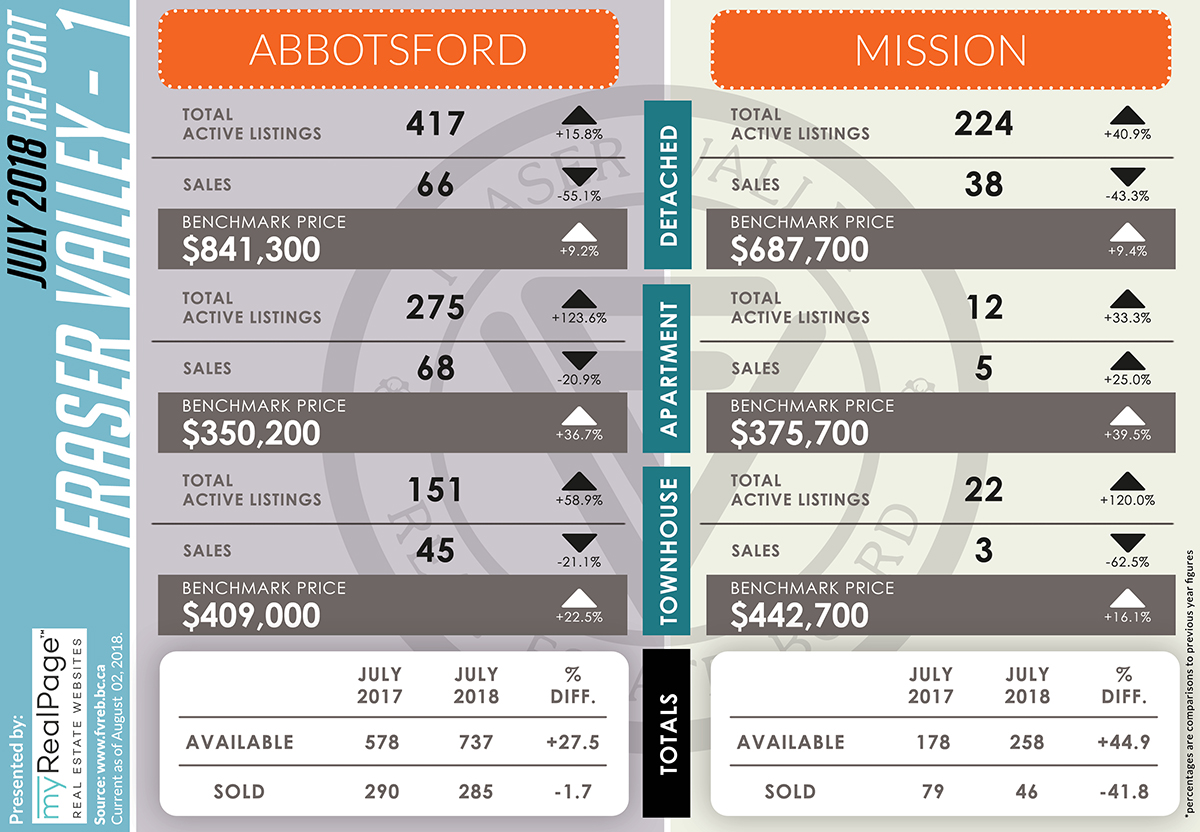
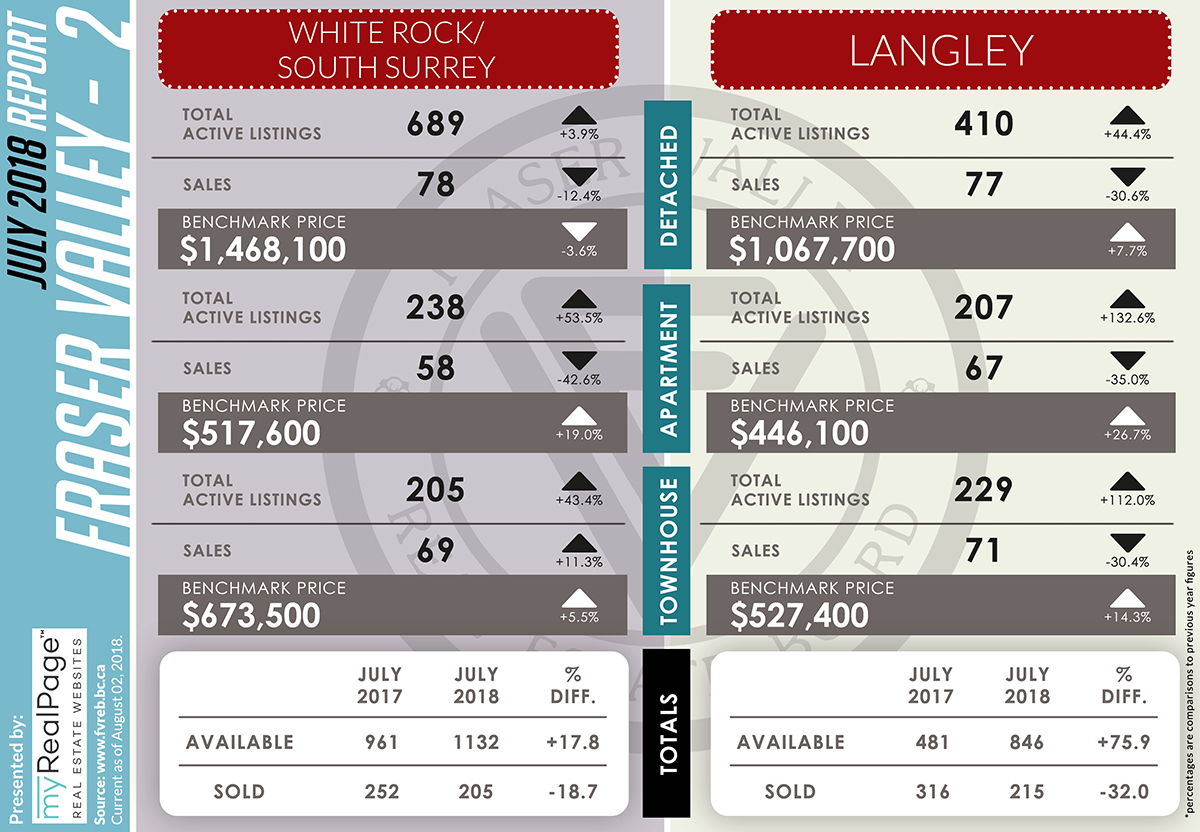
The following data is a comparison between July 2017 and July 2018 numbers, and is current as of June 2, 2018. For last month’s report, check out our previous infographic! Or follow this link for all our FVREB Infographics!
These infographics cover current trends in Fraser Valley neighbourhoods that are within the FVREB.
Click on the images for a larger view!
(Protip: Make sure to grab the printable PDF version, too! It fits best when printed on A4-sized sheets, AND we’ve added an area on the sheet where you can attach your business card! 🙂 )
Download Printable Version – FVREB July 2018 Market Report
Last Updated on July 25, 2022 by myRealPage
