INFOGRAPHICS: August 2018 TREB Toronto Market Reports

It’s once again time for this month’s market updates for areas covered by the Toronto Real Estate Board (TREB)!
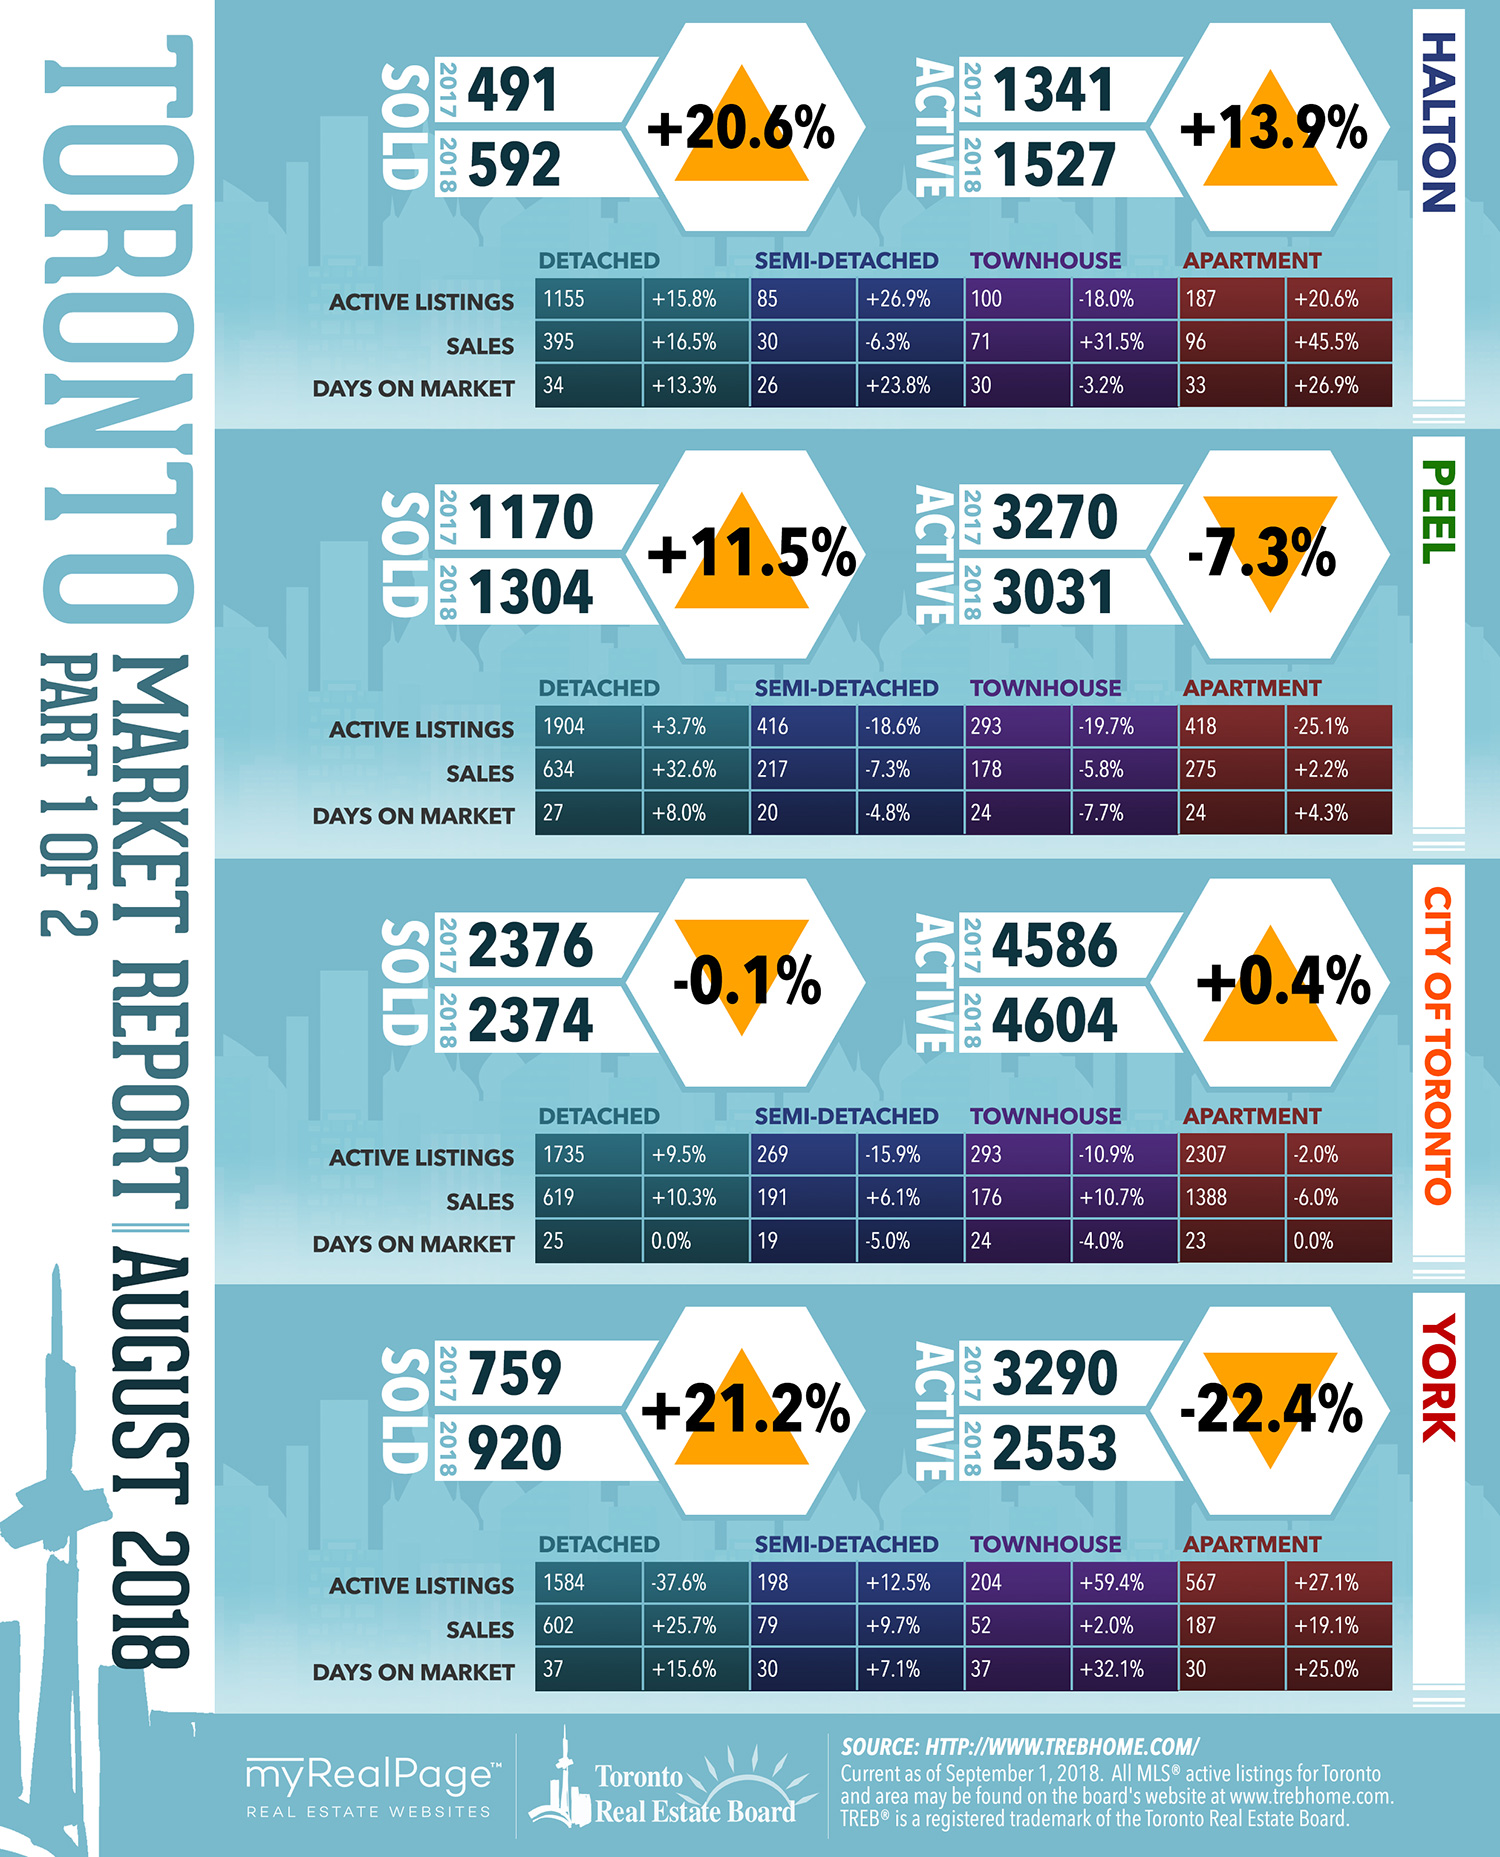
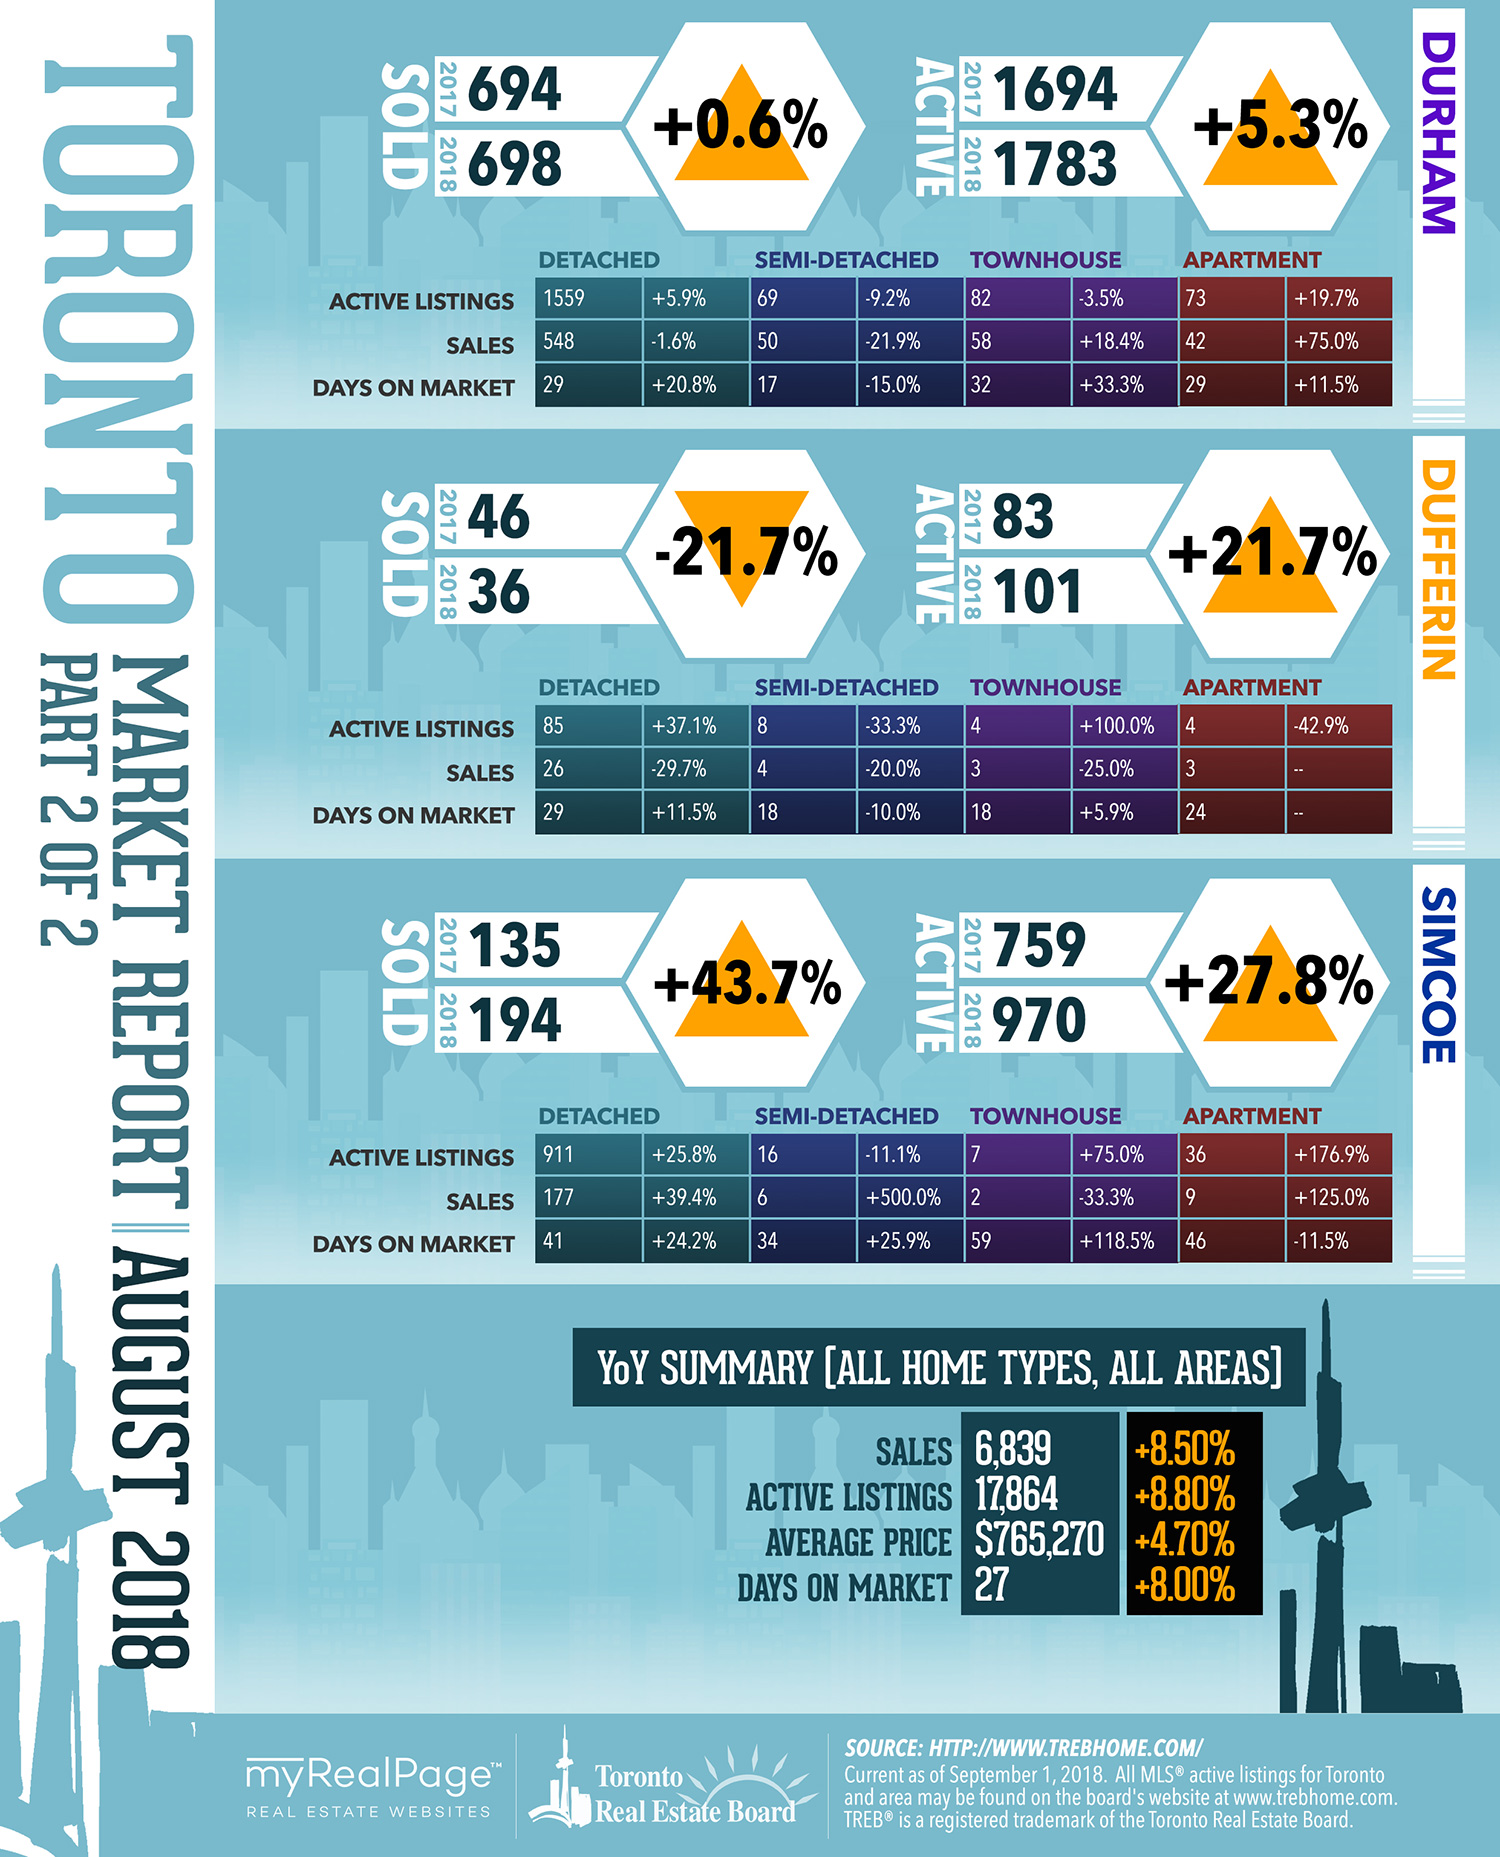
According to TREB’s latest media release, the average selling price and the MLS® Home Price Index Composite Benchmark for August 2018 were up compared to the same month in 2017.
The release also states that the average selling price increased by more than the MLS® HPI Composite due, at least in part, to a change in the mix of sales compared to last year. Detached home sales were up by double digits on a year-over-year percentage basis – substantially more than many other less-expensive home types.
Toronto Real Estate Board President Garry Bhaura is optimistic, stating:
“It is encouraging to see a continued resurgence in the demand for ownership housing. Many home buyers who had initially moved to the sidelines due to the Ontario Fair Housing Plan and new mortgage lending guidelines have renewed their search for a home and are getting deals done much more so than last year.
In a region where the economy remains strong and the population continues to grow, ownership housing remains a solid long-term investment.”
Meanwhile, according to Jason Mercer, TREB’s Director of Market Analysis:
“Market conditions in the summer of 2018, including this past August, were tighter than what was experienced in the summer of 2017.
In August, the annual rate of sales growth outpaced the annual rate of new listings growth. We only have slightly more than two-and-a-half months of inventory in the TREB market area as a whole and less than two months of inventory in the City of Toronto.
This means that despite the fact the sales remain off the record highs from 2016 and 2017, many GTA neighbourhoods continue to suffer from a lack of inventory. This could present a problem if demand continues to accelerate over the next year, which is expected.”
UPDATE: In January 2020, TREB has since rebranded to TRREB, the Toronto Regional Real Estate Board.
The following data is a comparison between August 2017 and August 2018 numbers, and is current as of September 2018. For last month’s numbers, check out our previous infographic! Or follow this link for all our TREB Infographics!
Click on the images for a larger view!
(Protip: Make sure to grab the printable PDF versions, too! It fits best when printed on A4-sized sheets, AND we’ve added an area on the sheet where you can attach your business card! 🙂 )
Download Printable Version – August 2018 TREB, Toronto Market Report

(MarketWatch Image Source: https://twitter.com/TREBhome/)
Last Updated on July 25, 2022 by myRealPage
