INFOGRAPHICS: August 2019 TREB Toronto Market Reports

The summer months just zoomed by, and here we are at the beginning of a new season! With that, here are the latest real estate market updates for areas covered by the Toronto Real Estate Board (TREB)!
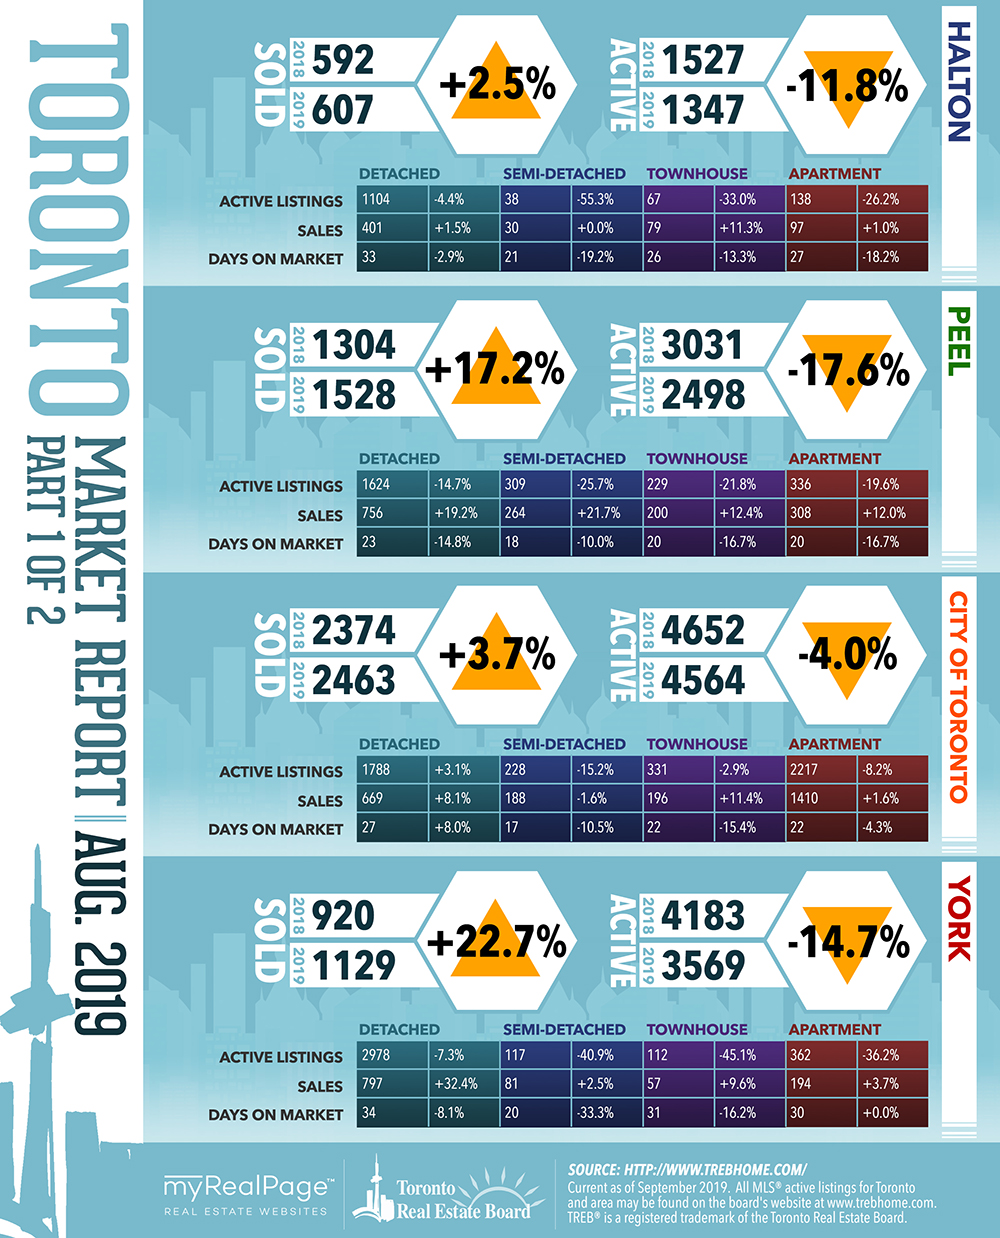
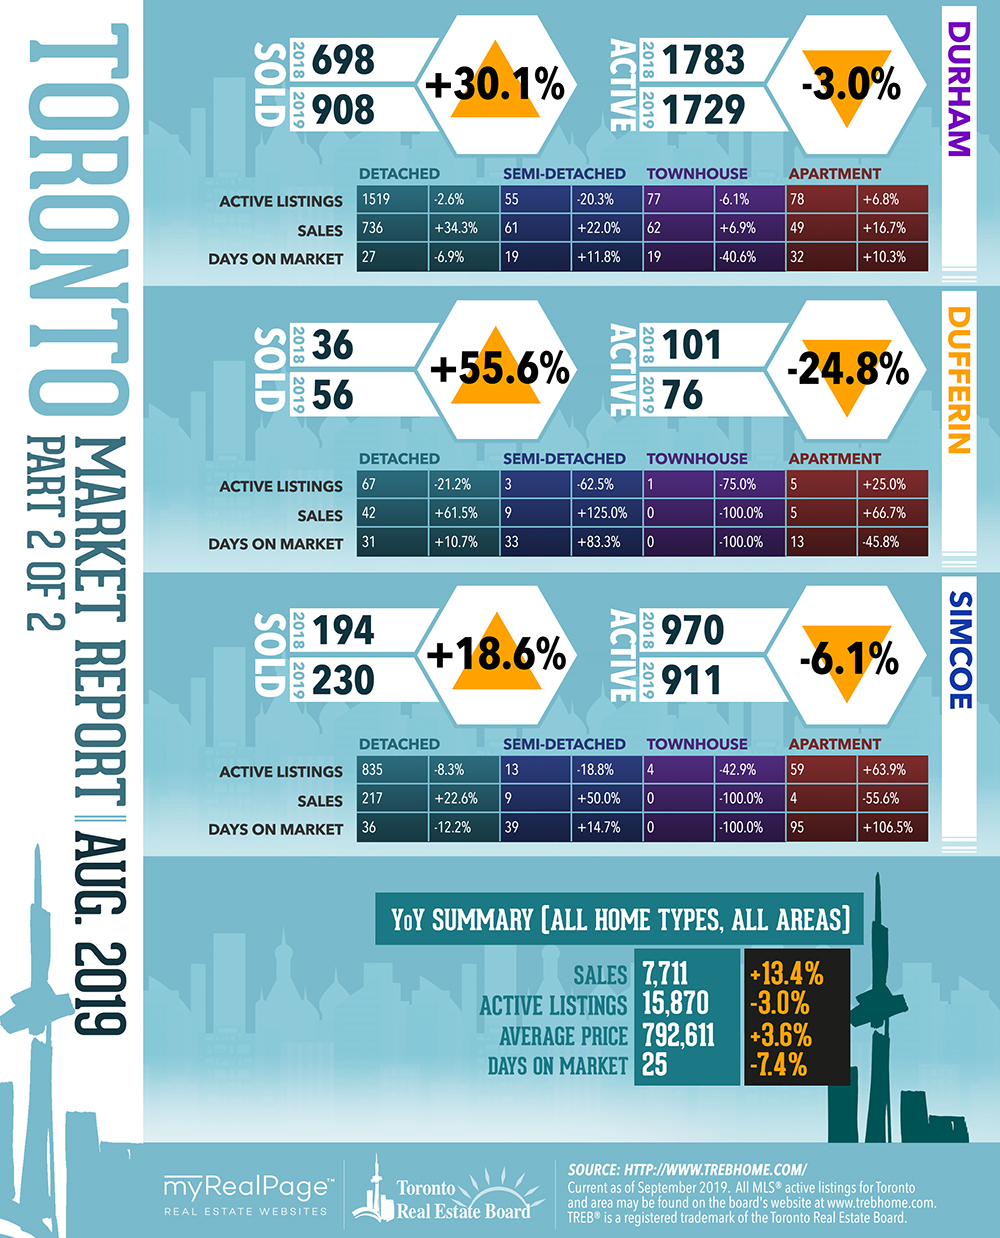
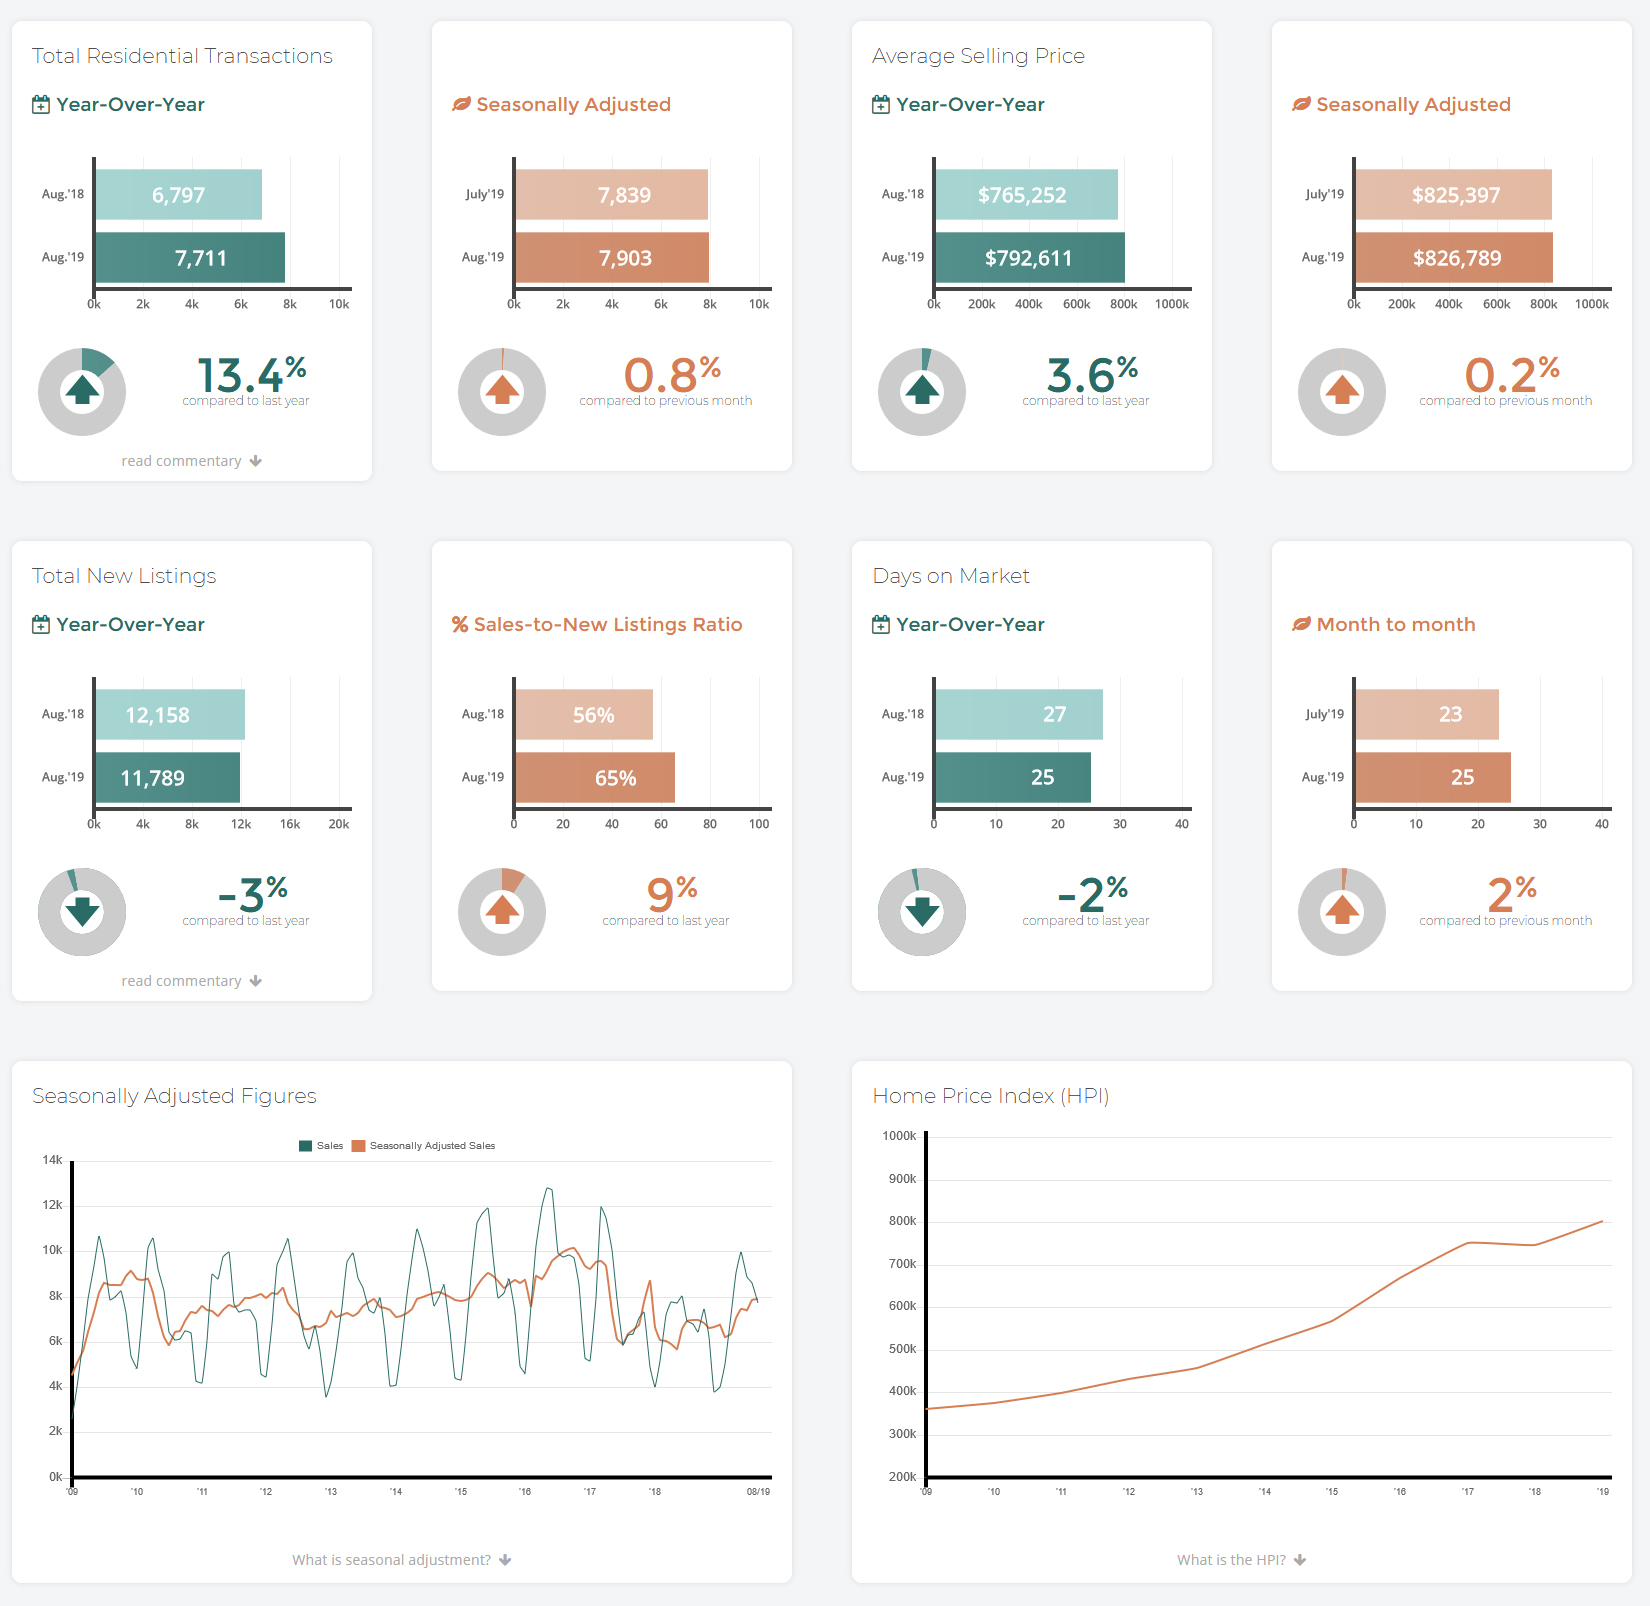
According to their most recent media release, TREB has reported 7,711 residential sales in August 2019. This result represented a 13.4% increase compared to 6,797 sales reported in August 2018. On a month-over-month basis, after preliminary seasonal adjustment, sales were up by 0.8%.
Market conditions also became tighter in August 2019 compared to a year ago because, while sales were up year-over-year, new listings were down by 3% over the same time period to 11,789. Year-to-date, growth in sales has well outstripped growth in new listings. This is why overall active listings counted at the end of August were down by more than 11% compared to August 2018.
The average selling price, at $792,611 in August 2019, was up by 3.6% year-over-year.
UPDATE: In January 2020, TREB has since rebranded to TRREB, the Toronto Regional Real Estate Board.
The following data is a comparison between August 2018 and August 2019 numbers, and is current as of September 2019. For last month’s numbers, check out our previous infographic!
Or follow this link for all our TREB Infographics!
Click on the images for a larger view!
(Protip: Make sure to grab the printable PDF versions, too! It fits best when printed on A4-sized sheets, AND we’ve added an area on the sheet where you can attach your business card! 🙂 )
Download Printable Version – August 2019 TREB, Toronto Market Report
(Image Source: TREBhome.com)
Last Updated on July 25, 2022 by myRealPage
