

INFOGRAPHICS: July 2026 FVREB Fraser Valley Market Reports
Improving affordability continues to outpace buyer demand
Fraser Valley home prices continued to edge downward in July, with the composite Benchmark price down 0.8 per cent from June and down seven per cent year-over-year. Despite improving affordability, buyers remained cautious, keeping sales well below typical seasonal levels.
The Fraser Valley Real Estate Board recorded 1,089 sales on its Multiple Listing Service® (MLS®) in July, a five per cent decrease from June and nine per cent below the same month last year.
“Buyer urgency has been notably absent from the Fraser Valley market for some time now,” said Ishaq Ismail, Chair of the Fraser Valley Real Estate Board. “With inventory remaining high and competition subdued, buyers know they don’t have to rush. They can take their time evaluating their options, knowing they can return to a market that continues to offer plenty of choice.”
Read the full report on the FVREB website!
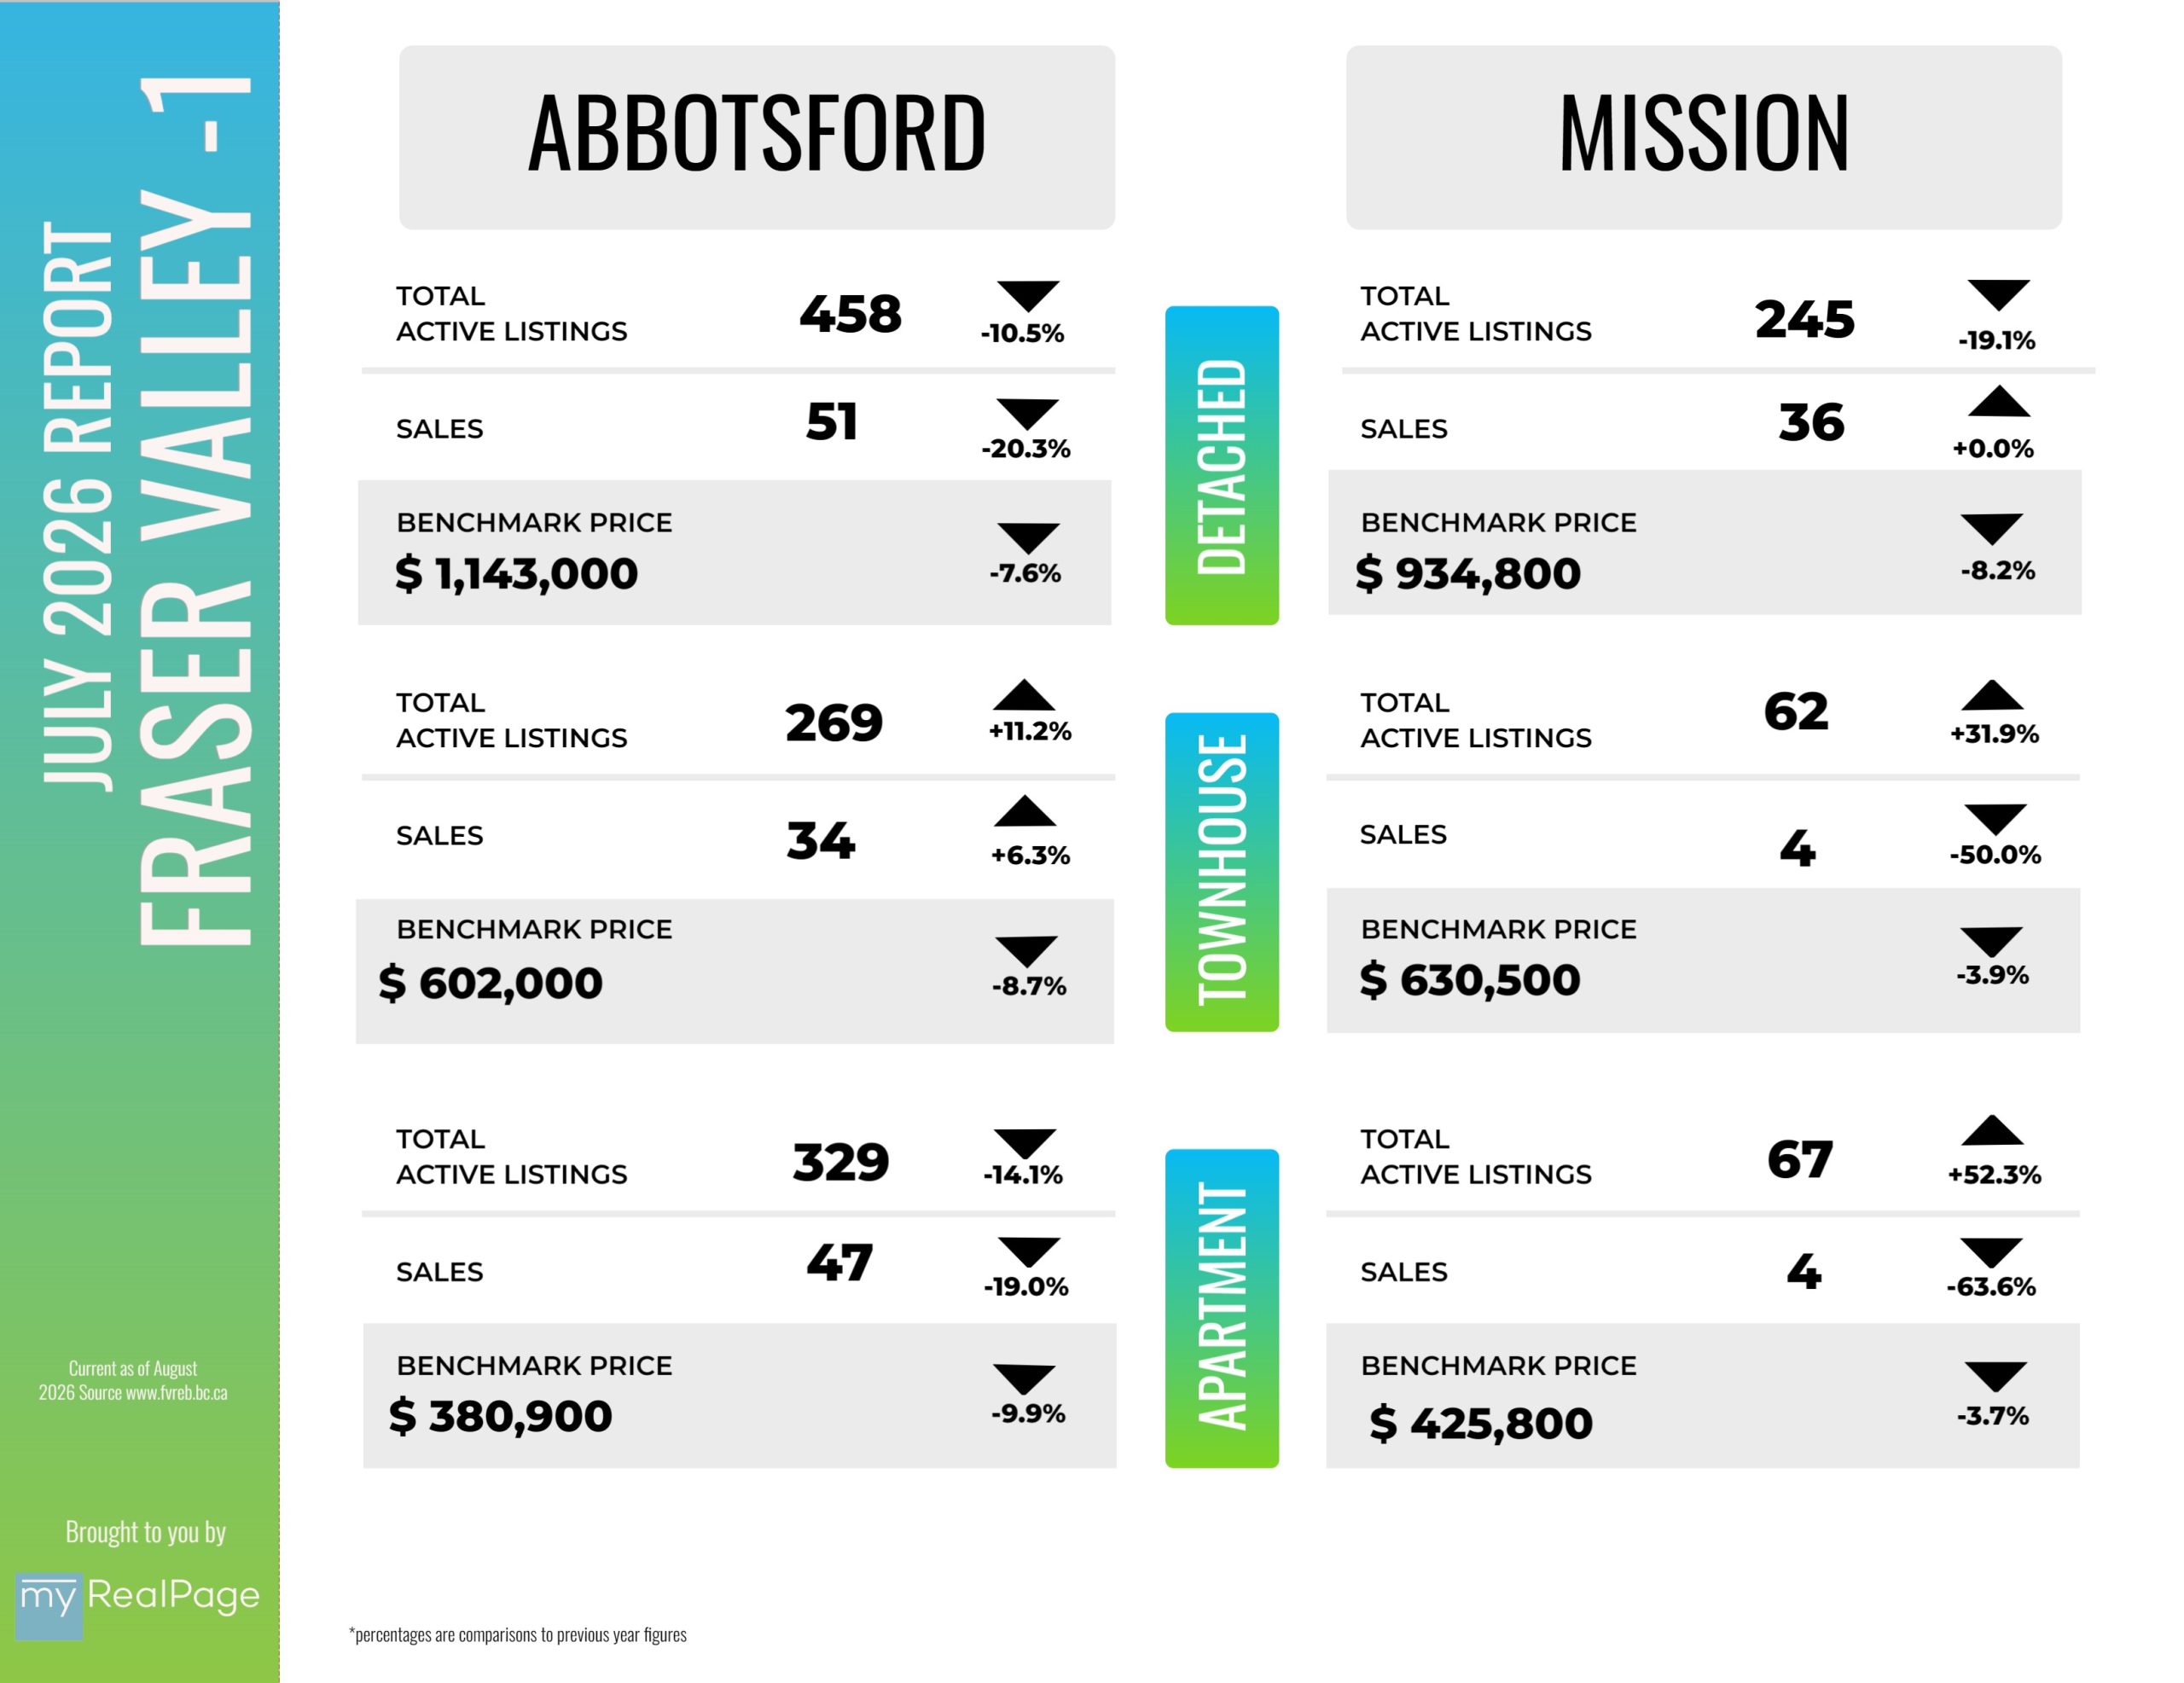
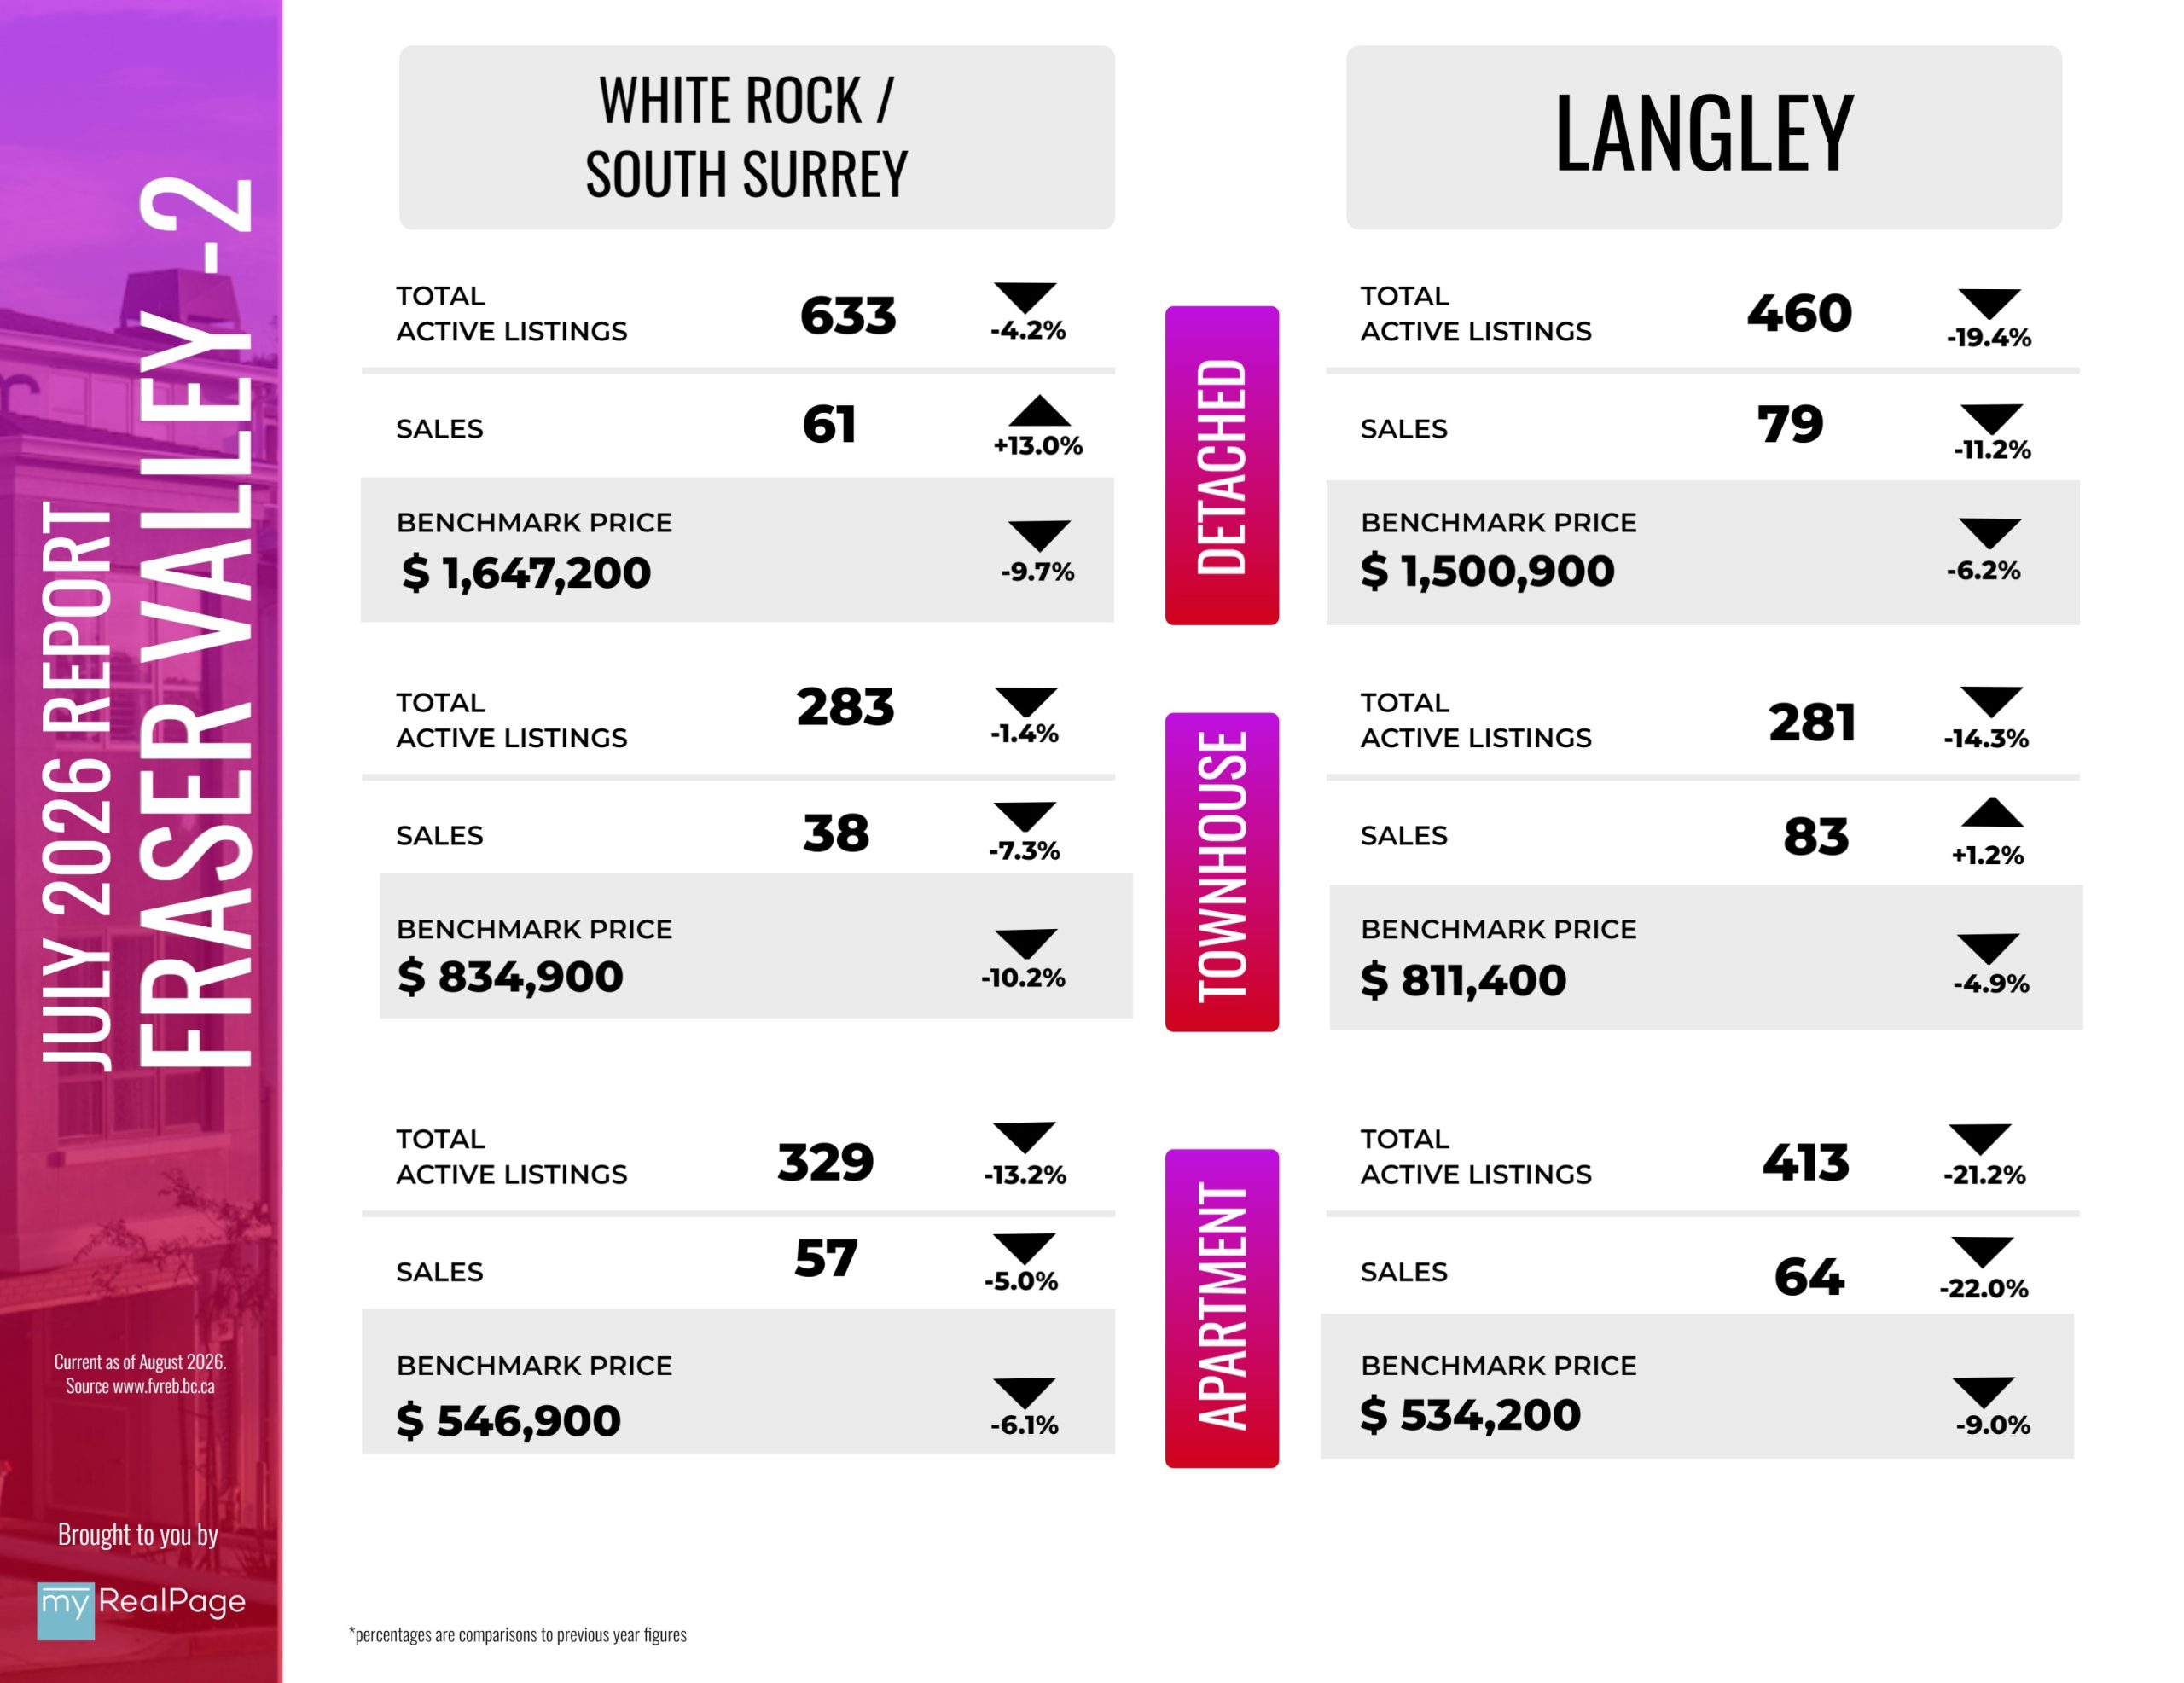
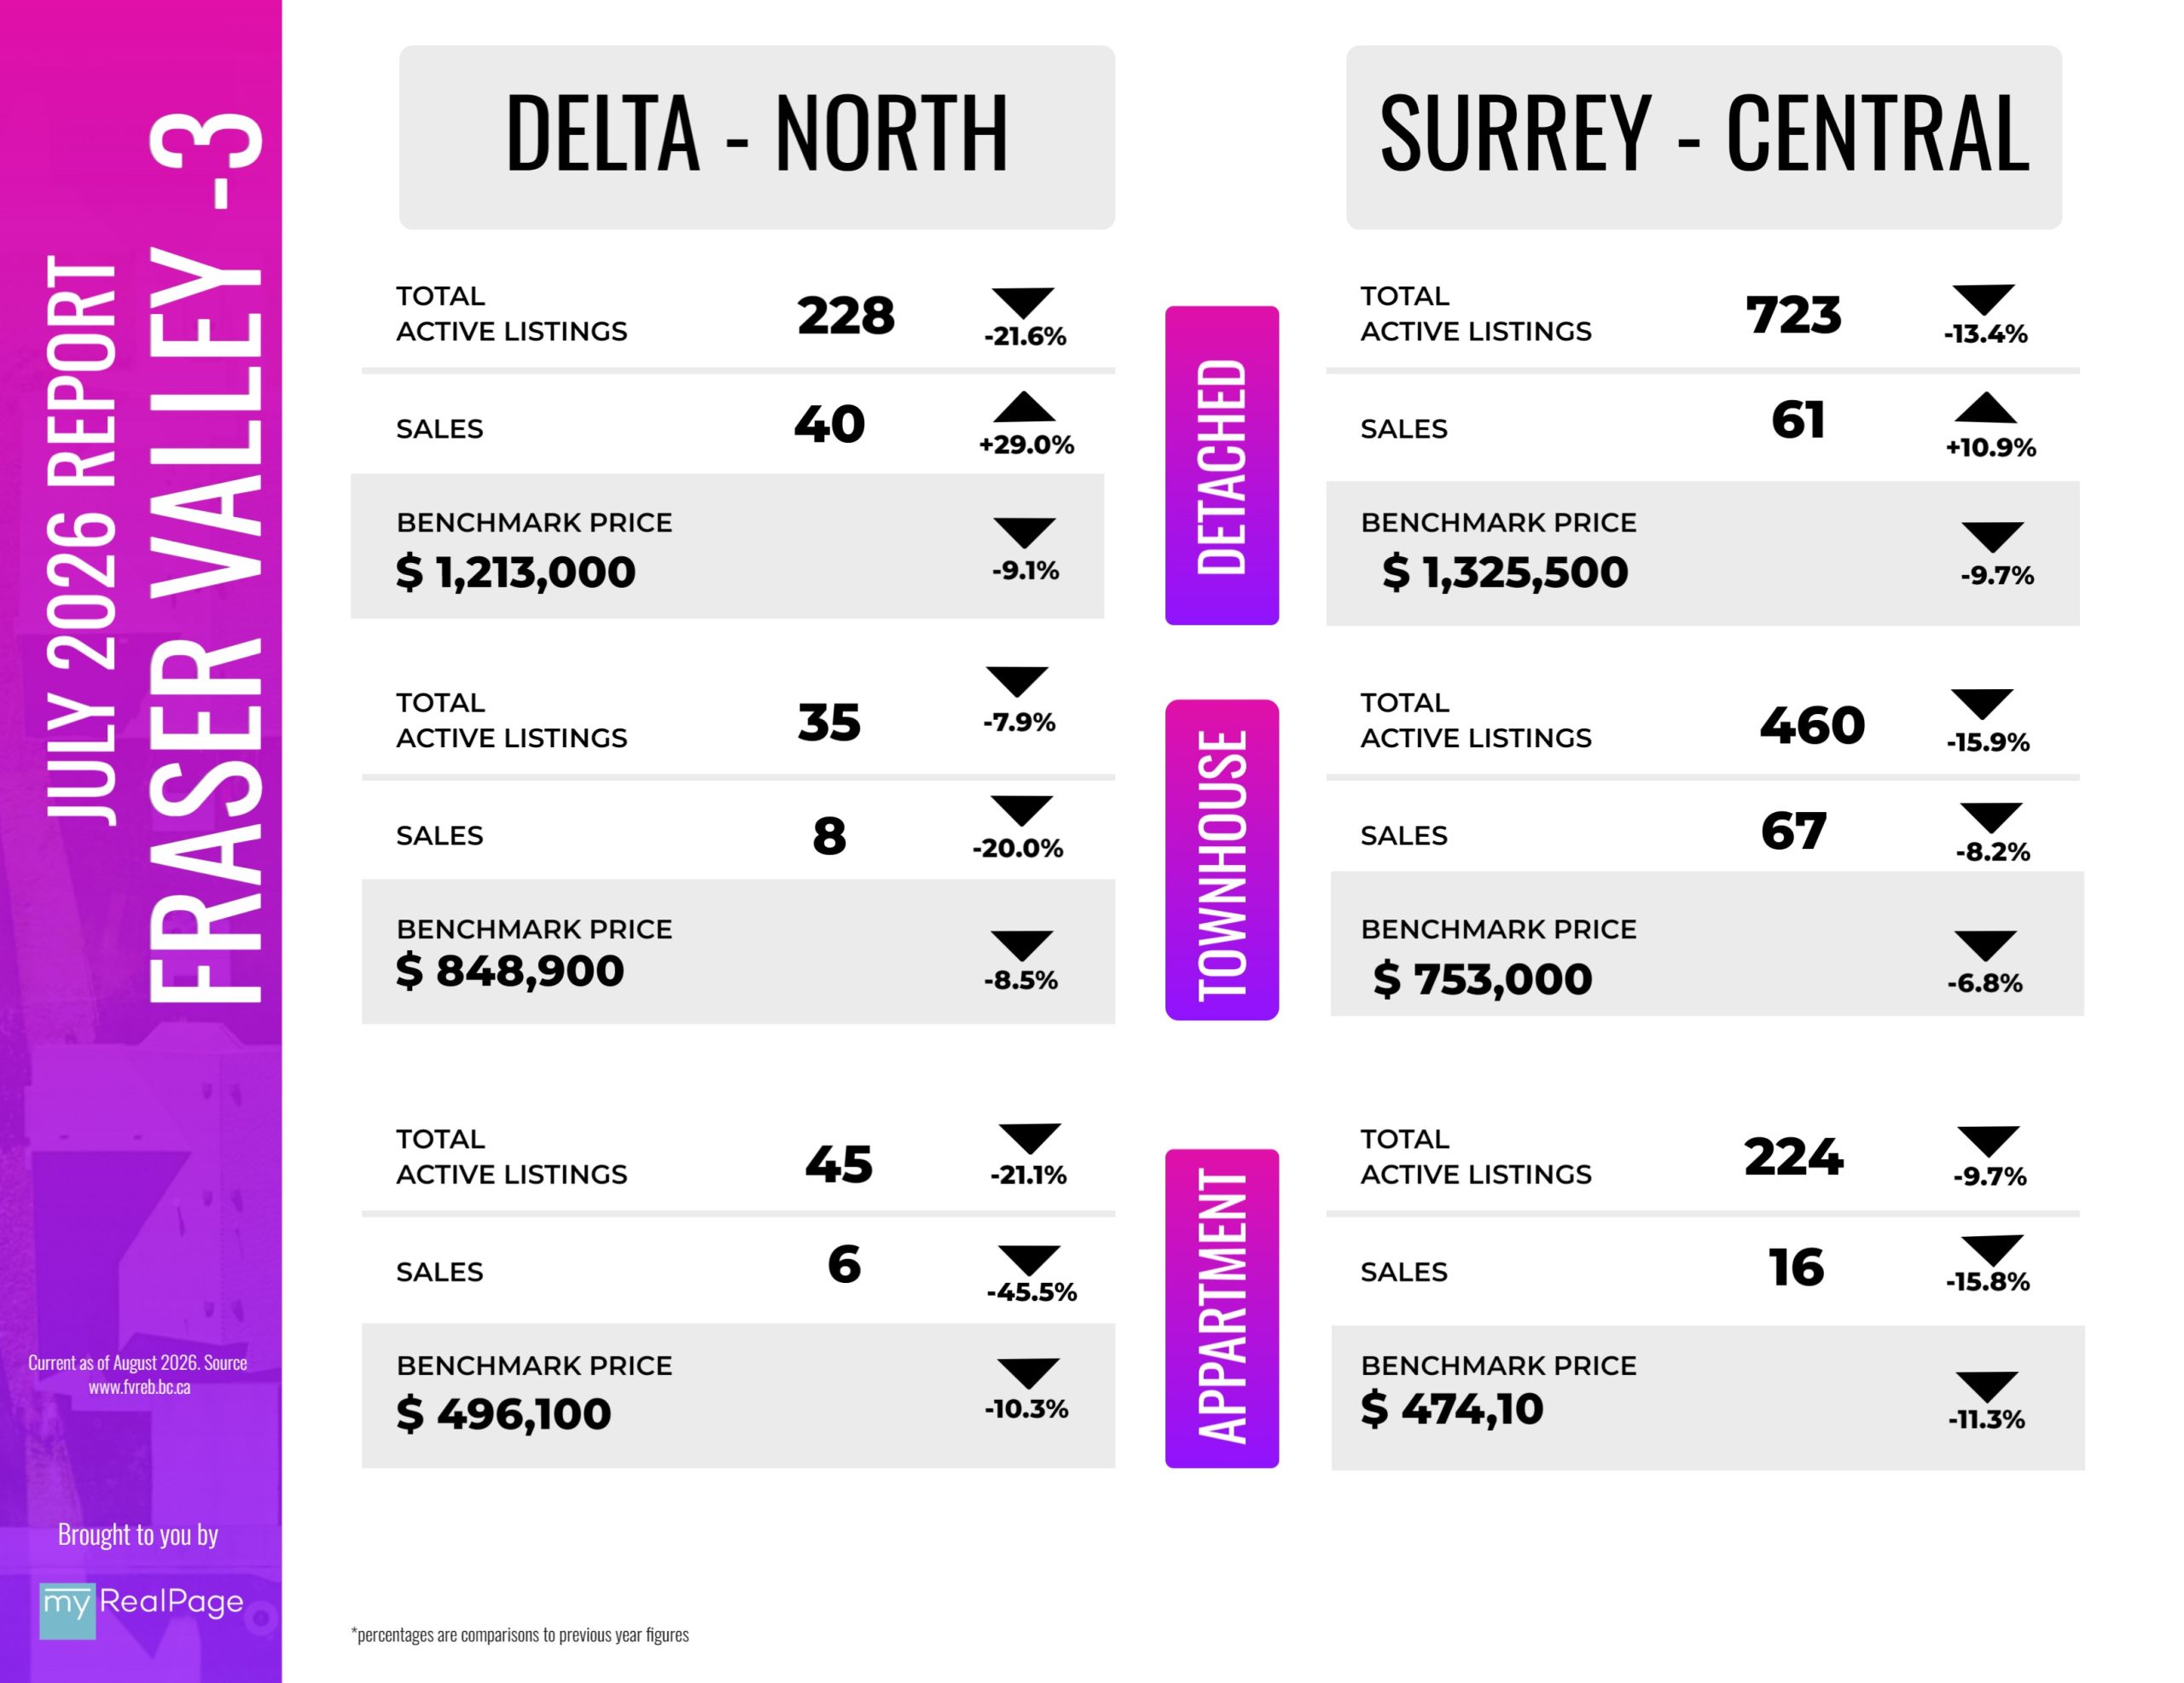
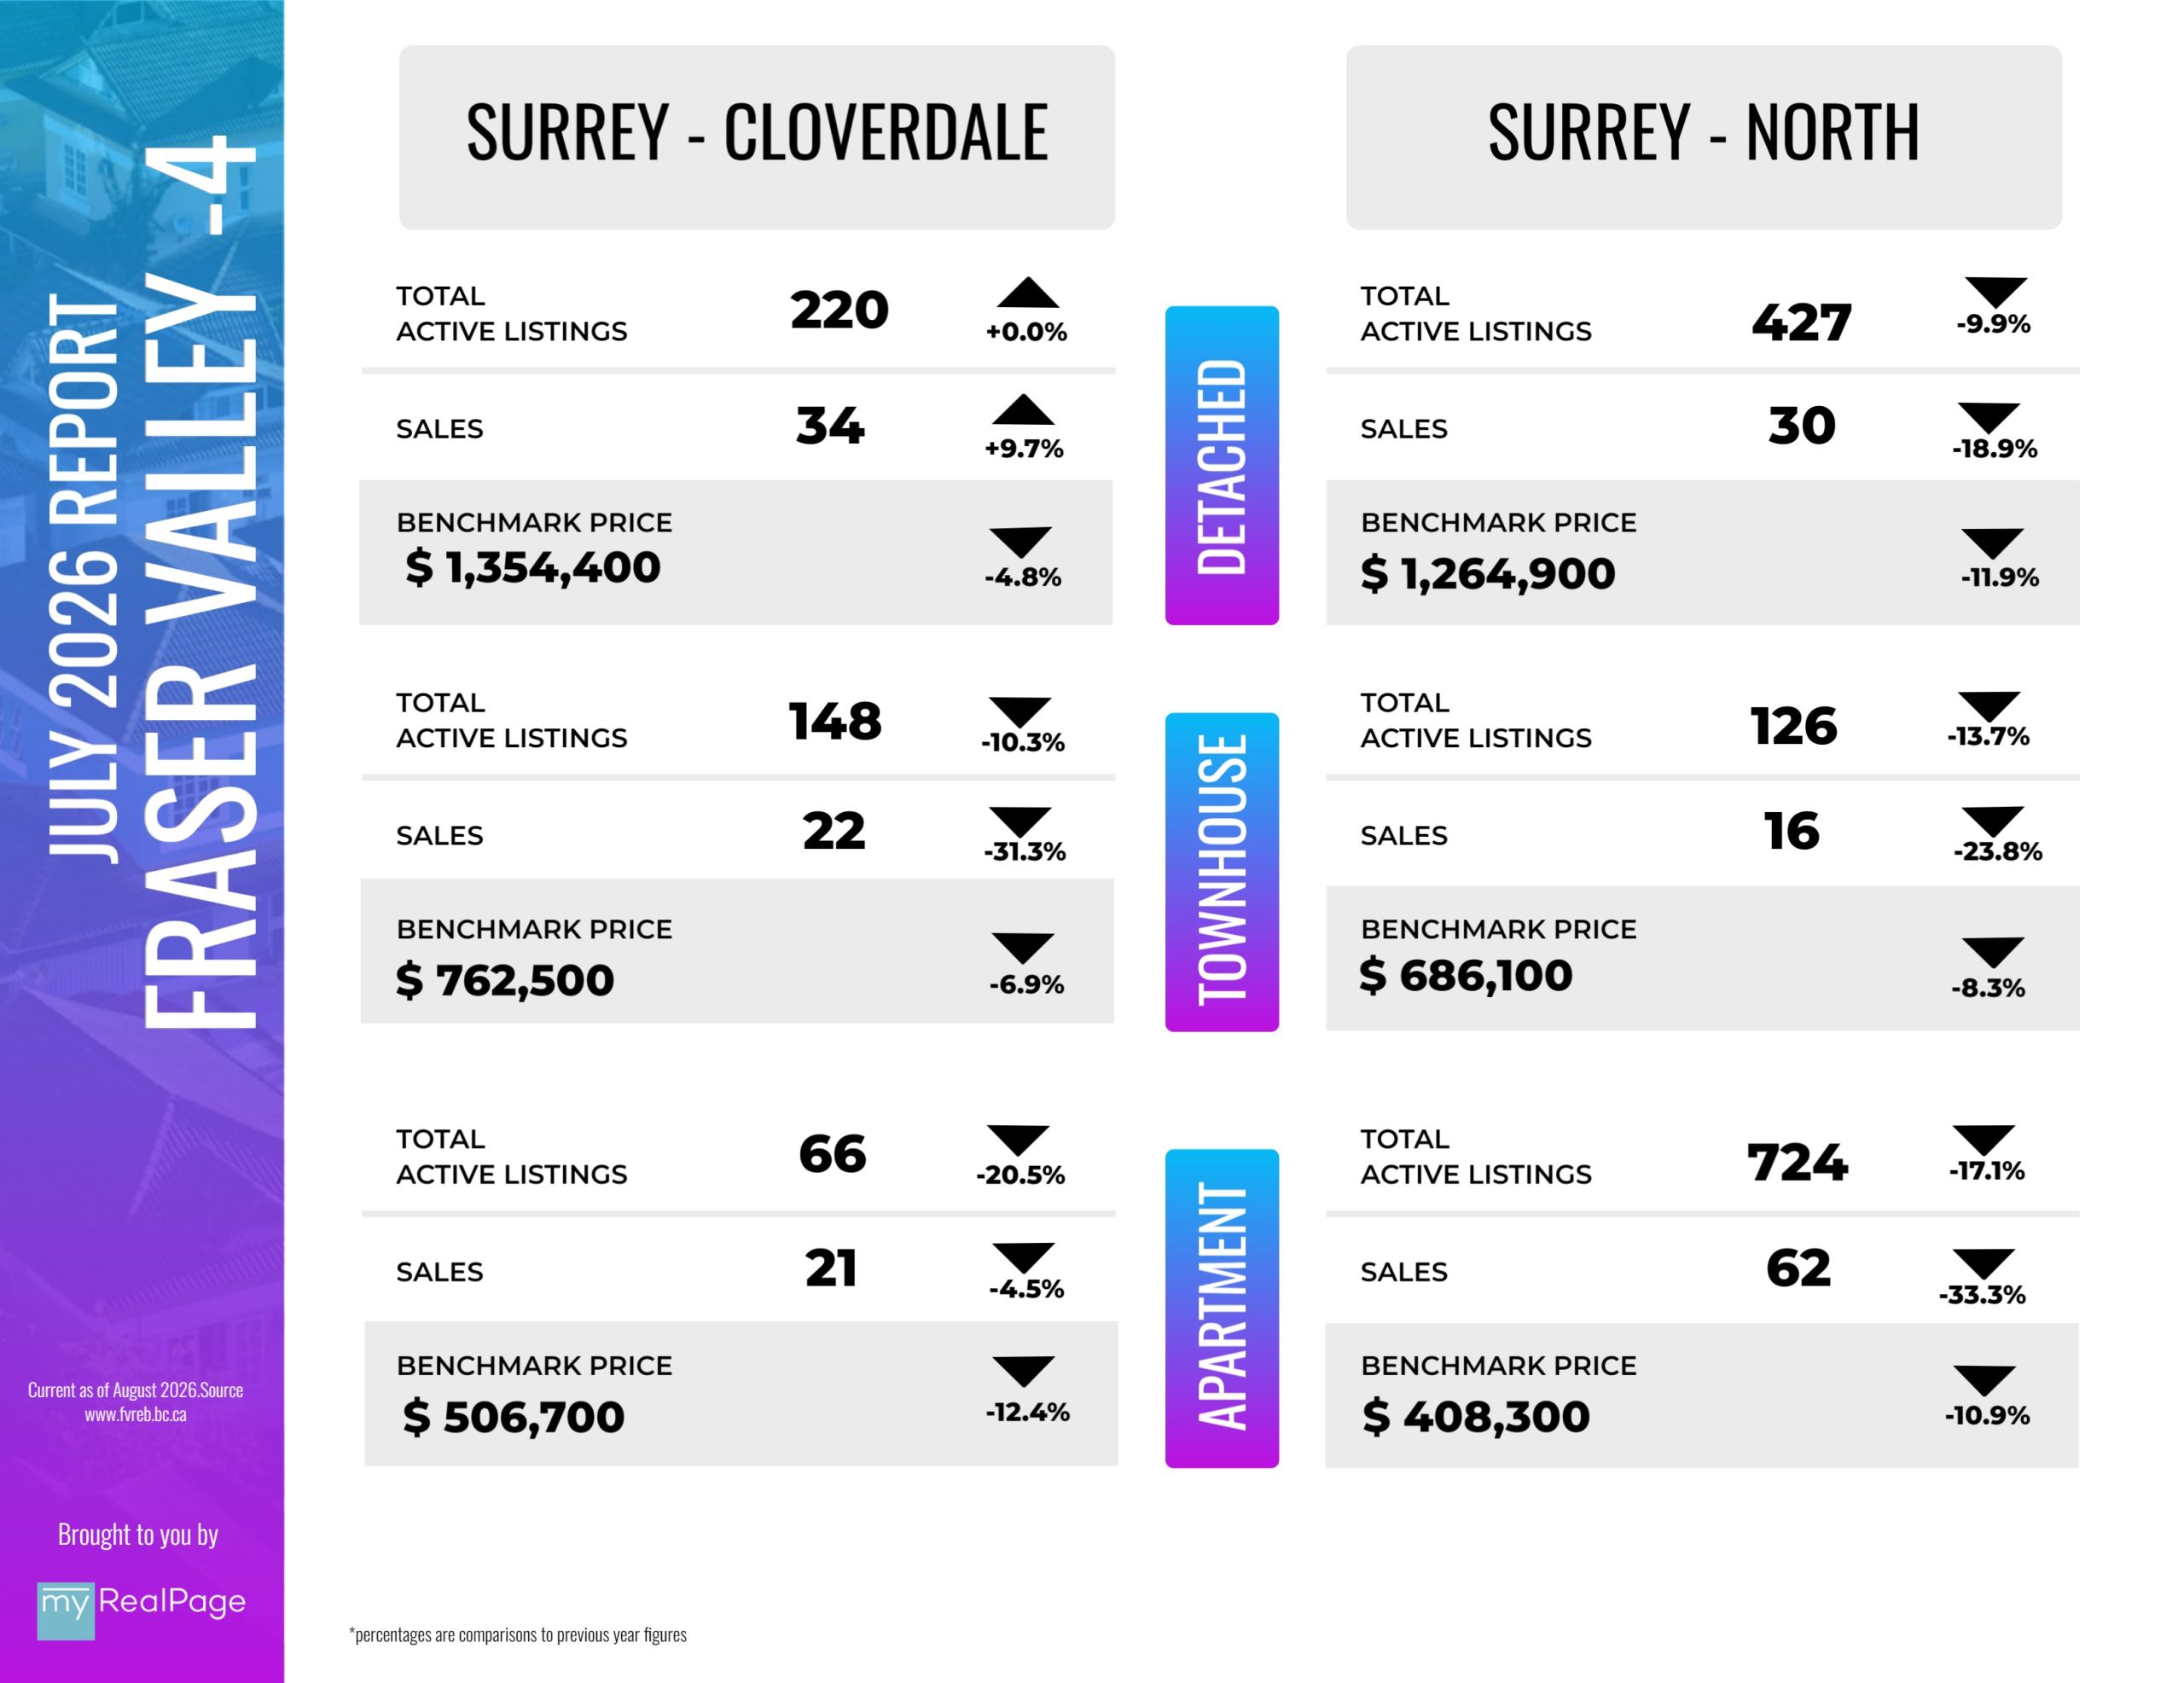
The following data is a comparison between July 2026 and July 2025 numbers, and is current as of August of 2026. For last month’s report, check out our previous infographic!
Or follow this link for all our FVREB Infographics!
These infographics cover current trends in Fraser Valley neighbourhoods that are within the FVREB. Click on the images for a larger view!
Download Printable Version – FVREB July 2026 Market Report
Last Updated on August 10, 2026 by myRealPage
