INFOGRAPHICS: February 2021 CREB City And Region Market Reports

Sellers’ market leads to rising prices
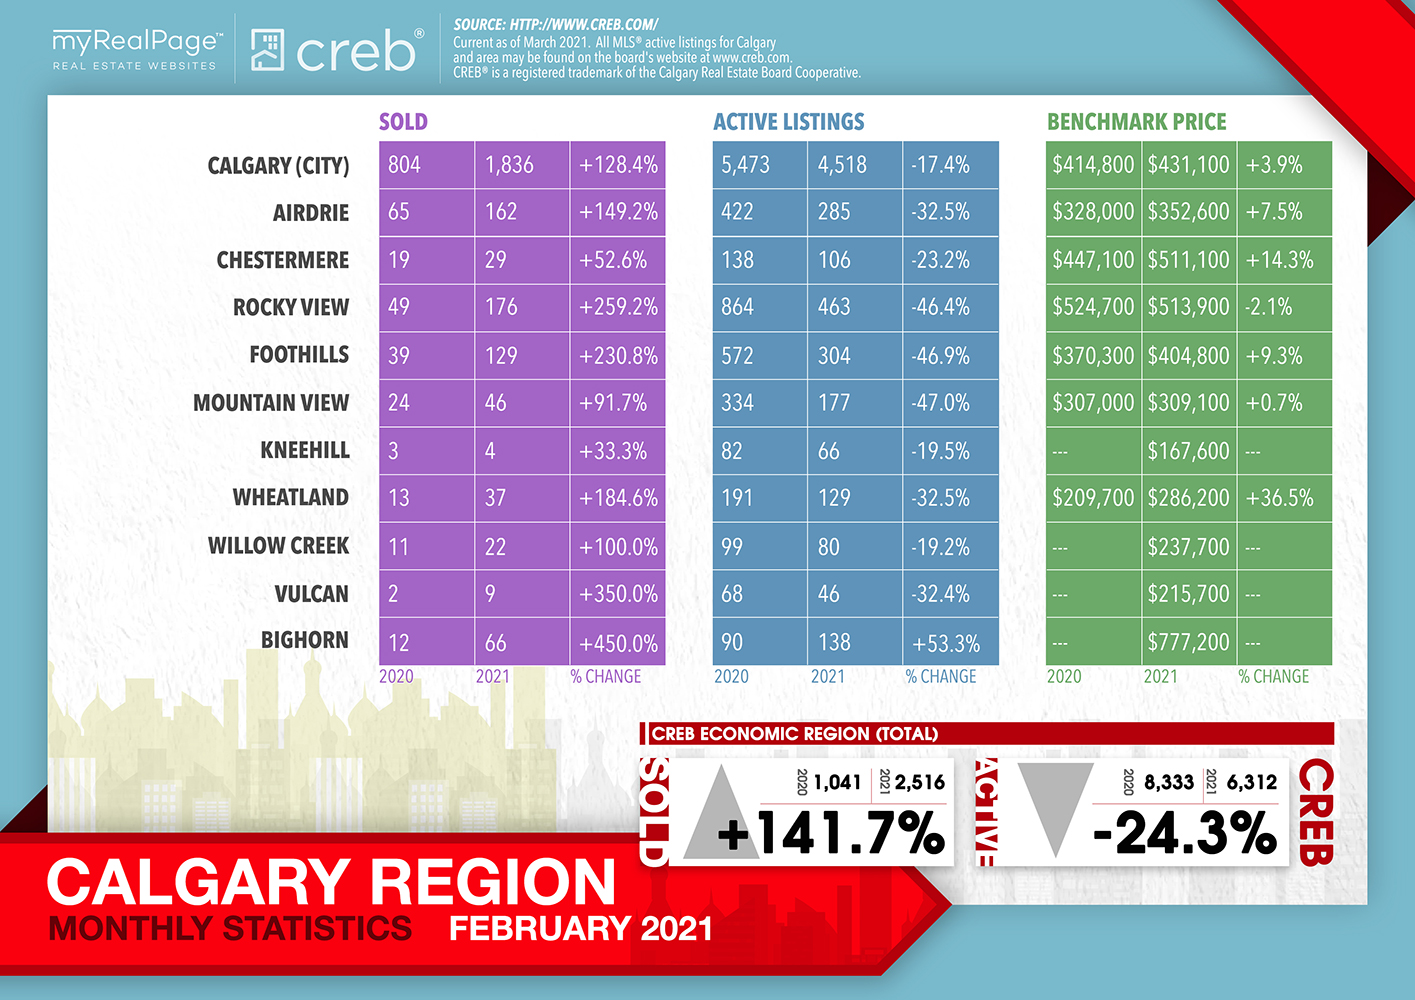
With gains in every price range, residential sales activity in February totalled 1,836 units. This reflects the best February since 2014.
“Despite continued COVID-19 restrictions, housing activity continues to improve. Much of the strong sales activity is expected to be driven by exceptionally low mortgage rates,” said CREB® chief economist Ann-Marie Lurie.
“Confidence is also likely improving as vaccine rollouts are underway. Additionally, some of the worst fears concerning the energy sector are easing with recent gains in energy prices.”
New listings also improved in February, but the gap between new listings and sales narrowed. This is causing the sales-to-new-listings ratio to rise to 65 per cent, keeping the months of supply well below three months.
Read the full report on the CREB website!
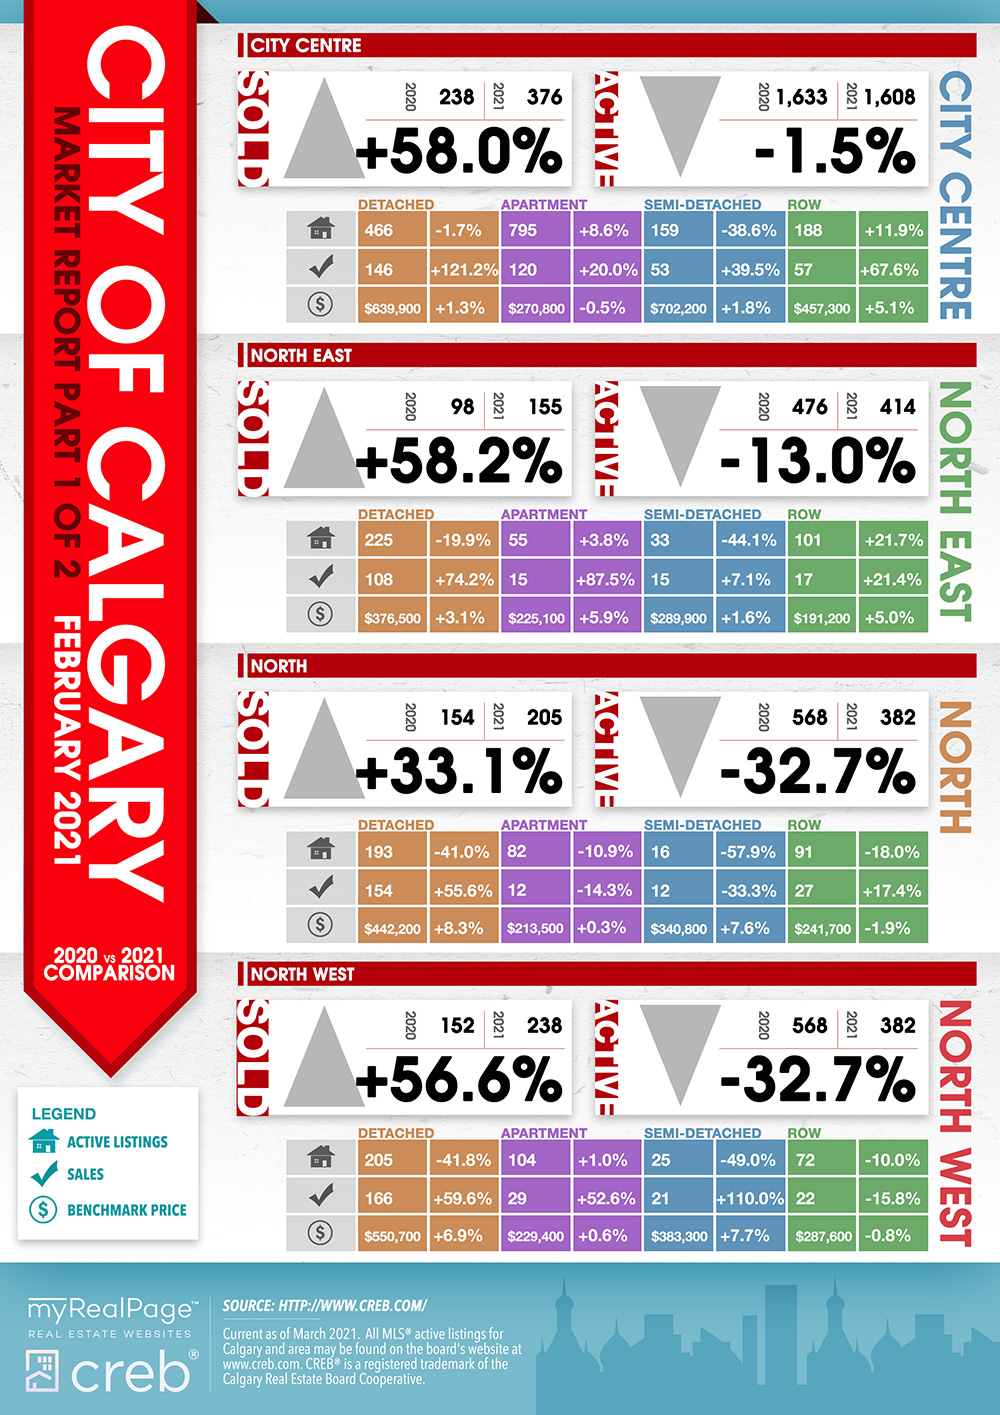
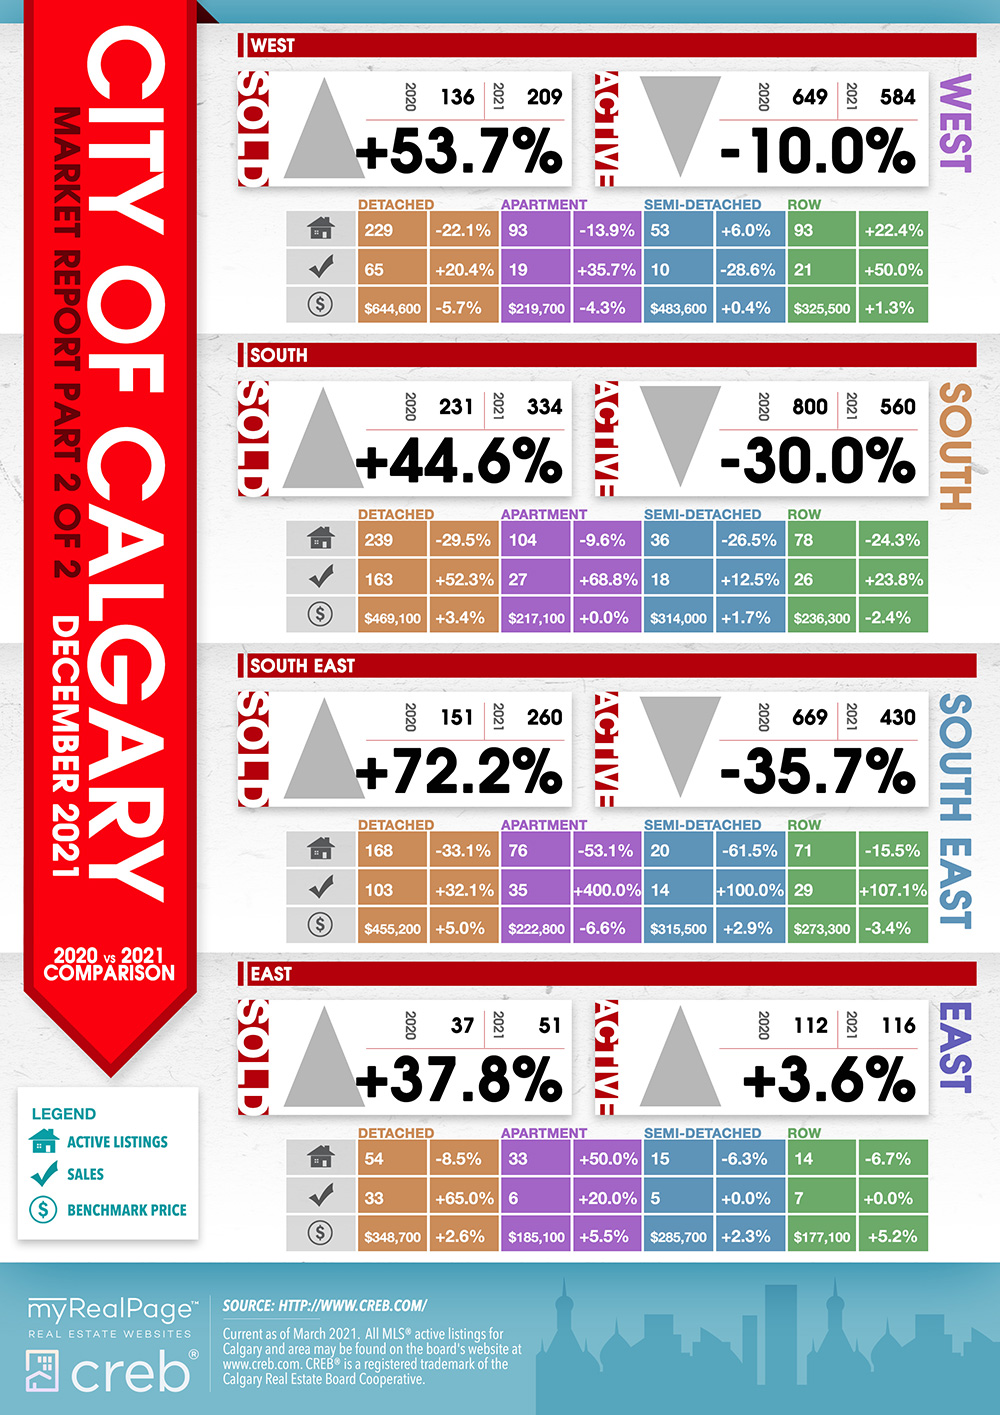
The following data is a comparison between February 2020 and February 2021 numbers, and is current as of March 2021. For last month’s numbers, check out our previous infographic.
Or follow this link for all our CREB Infographics!
Click on the images for a larger view! (Protip: Make sure to grab the printable PDF versions, too! It fits best when printed on A4-sized sheets, AND we’ve added an area on the sheet where you can attach your business card! 🙂 )
Download Printable Version – February 2021 CREB, City of Calgary Report
Download Printable Version – February 2021 CREB, Calgary Region Report
Last Updated on July 25, 2022 by myRealPage
