INFOGRAPHICS: January 2021 CREB City And Region Market Reports
January 2021: sales activity signals strong start to the year
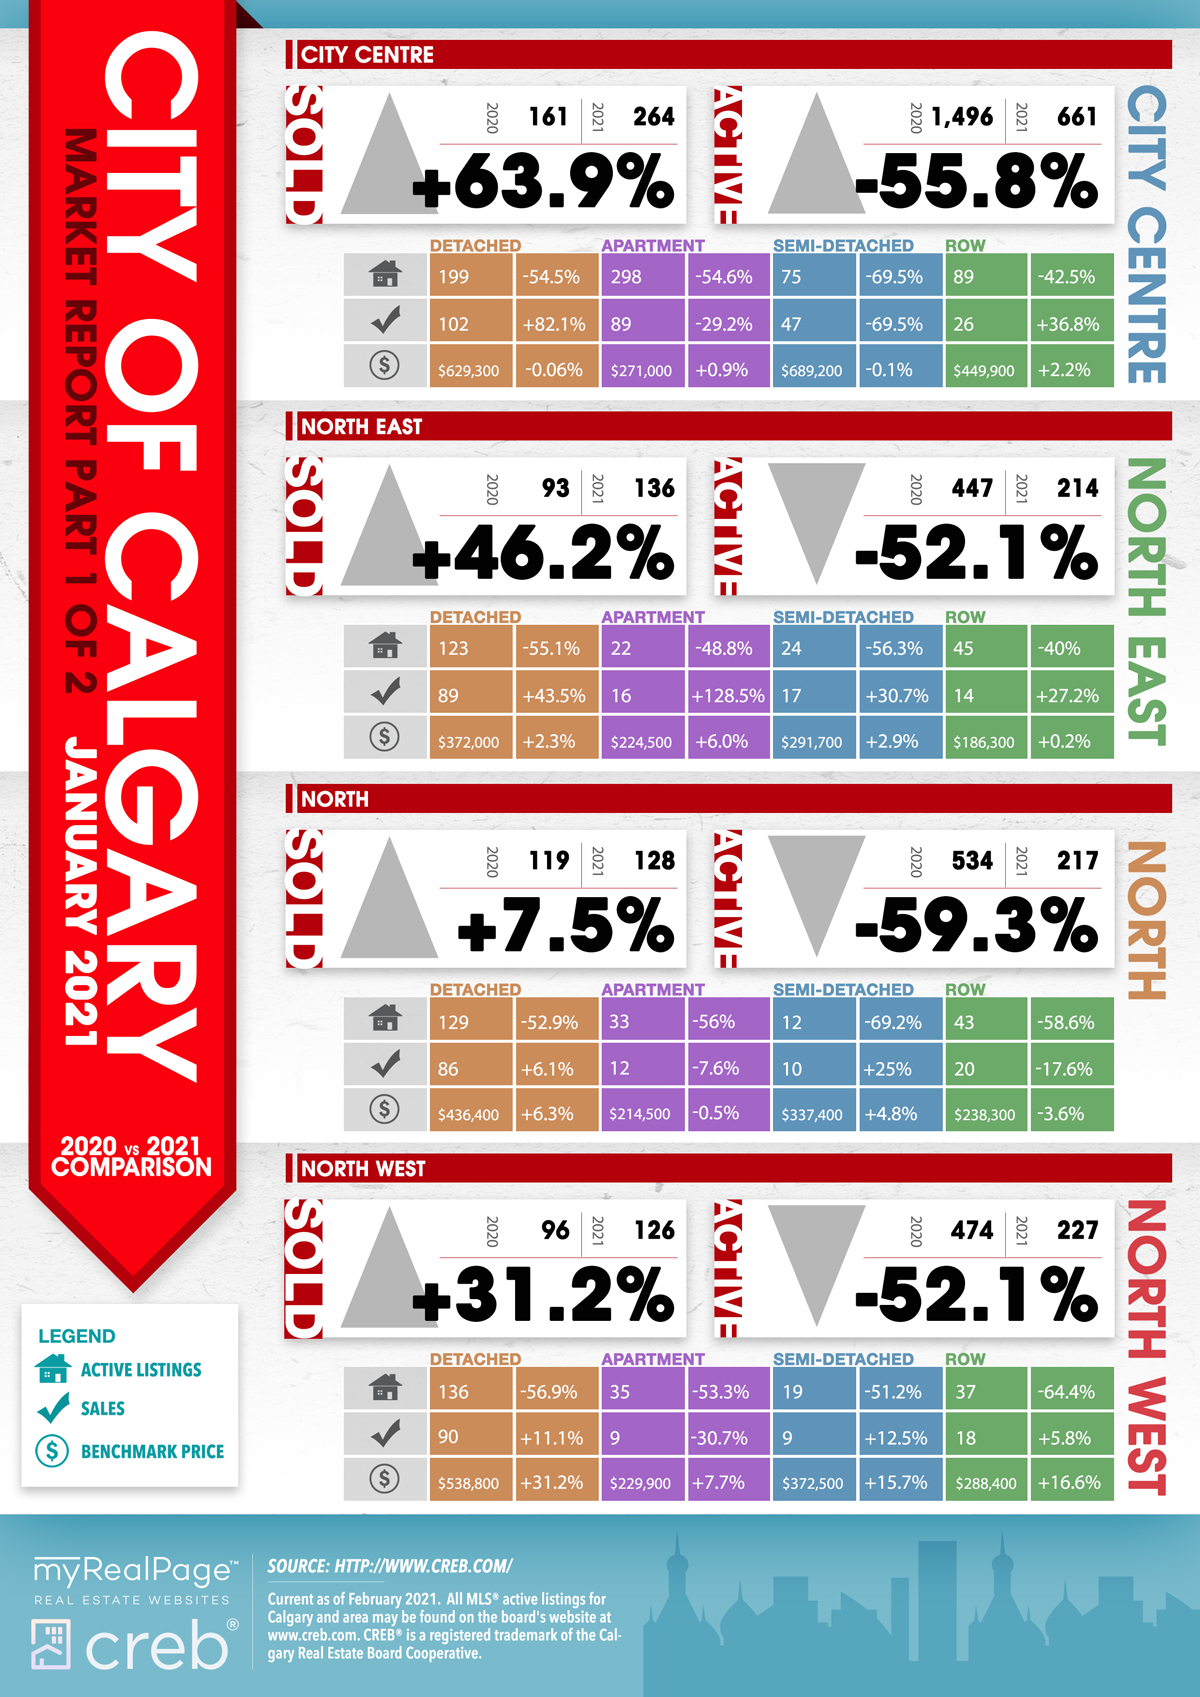
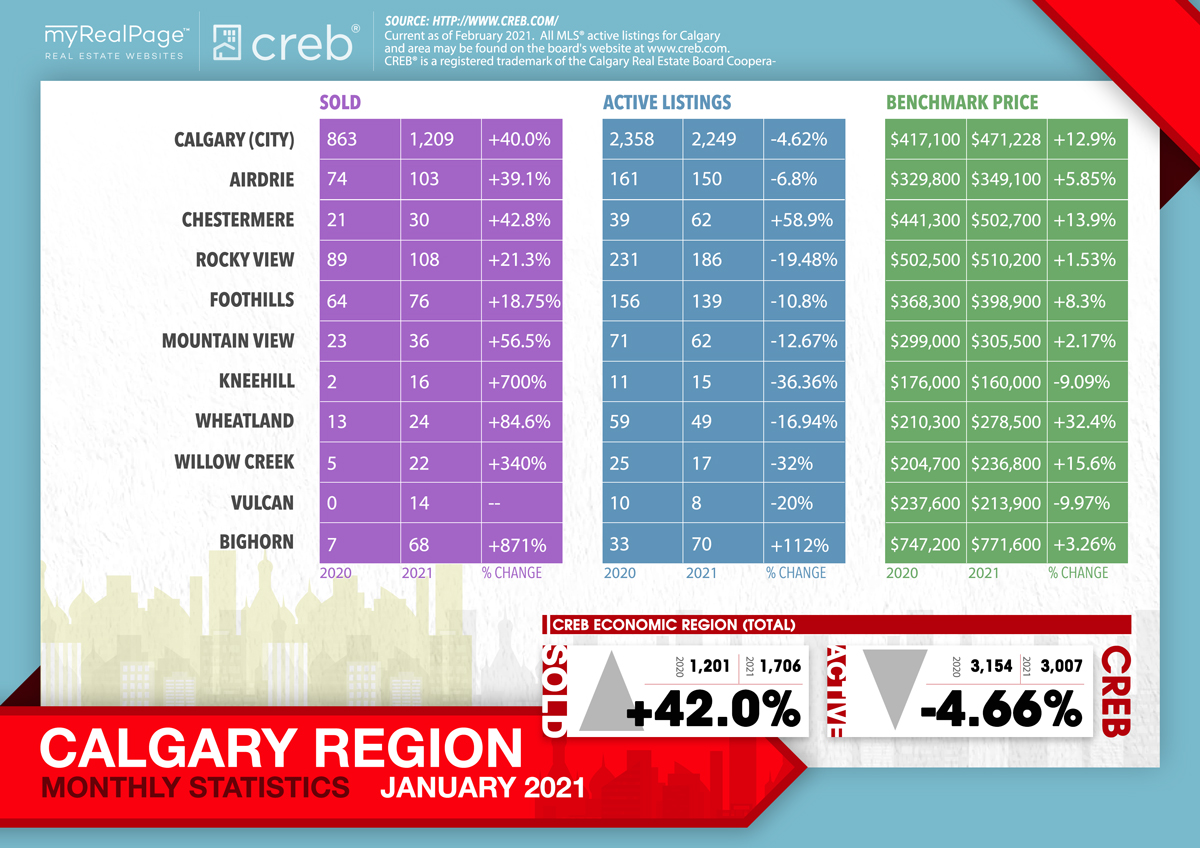
January sales were the highest they have been for the month since 2014, as housing market momentum from the end of 2020 carried over into the start of 2021.
Sales activity improved across all product types and across all price ranges.
“Discount lending rates are exceptionally low, which is likely attracting all types of buyers back into the market,” said CREB® chief economist Ann-Marie Lurie.
“New listings in the market were also slightly higher than what was available over the past two months, which is providing more options to purchasers.”
Read the full report on the CREB website.
The following data is a comparison between January 2021 and January 2020 numbers, and is current as of February 2021. For last month’s numbers, check out our previous infographic.
Or follow this link for all our CREB Infographics!
Click on the images for a larger view! (Protip: Make sure to grab the printable PDF versions, too! It fits best when printed on A4-sized sheets, AND we’ve added an area on the sheet where you can attach your business card! 🙂 )
Download Printable Version – January 2021 CREB, City of Calgary Report
Download Printable Version – January 2021 CREB Part 2, City of Calgary Report
Download Printable Version – January 2021 CREB, Calgary Region Report

Last Updated on July 25, 2022 by myRealPage
