INFOGRAPHICS: January 2023 FVREB Fraser Valley, South Surrey, Etc. Market Reports

Fraser Valley real estate sales record slowest annual start in ten years; January new listings lowest in over thirty years
The downward trend in Fraser Valley real estate sales continued in January as further interest rate hikes kept buyers sidelined.
With 626 transactions processed on the MLS®, sales were off by 12.6 per cent compared to last month and down by 52.2 per cent compared to this time last year. The last time January sales were this low was in 2013 at 617 sales.
“Buyers are understandably cautious, which explains the slow start to the year,” said Sandra Benz, President of the Fraser Valley Real Estate Board. “That said, the pent-up demand that has been building since the last quarter of 2022 will likely give rise to a sales uptick, especially if rate hikes subside, which we expect will be the case.”
Although new listings saw an increase of 128.3 per cent over last month to 1,833, they are at the lowest level of new supply for January since 1984. Active listings rose slightly up 5 per cent to 4,118 over December 2022 and up by 76.6 per cent compared to this time last year.
Read the full report on the FVREB website!
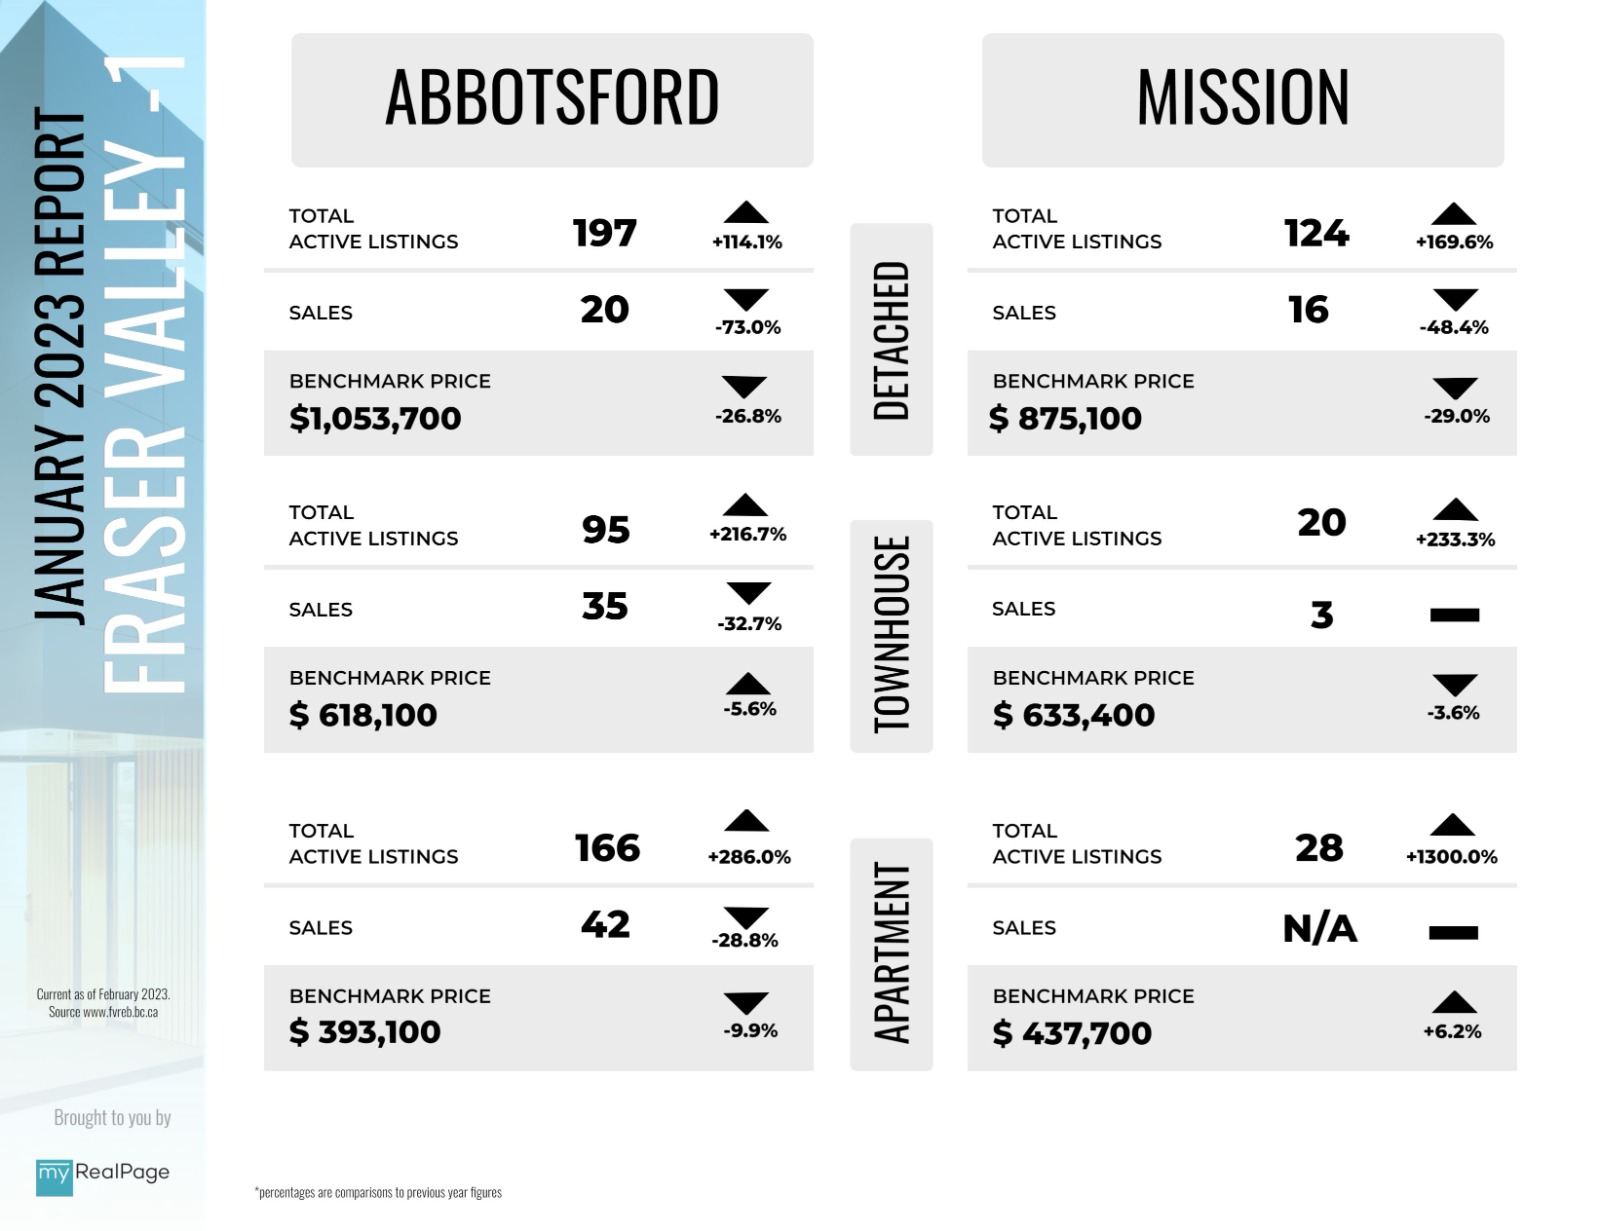
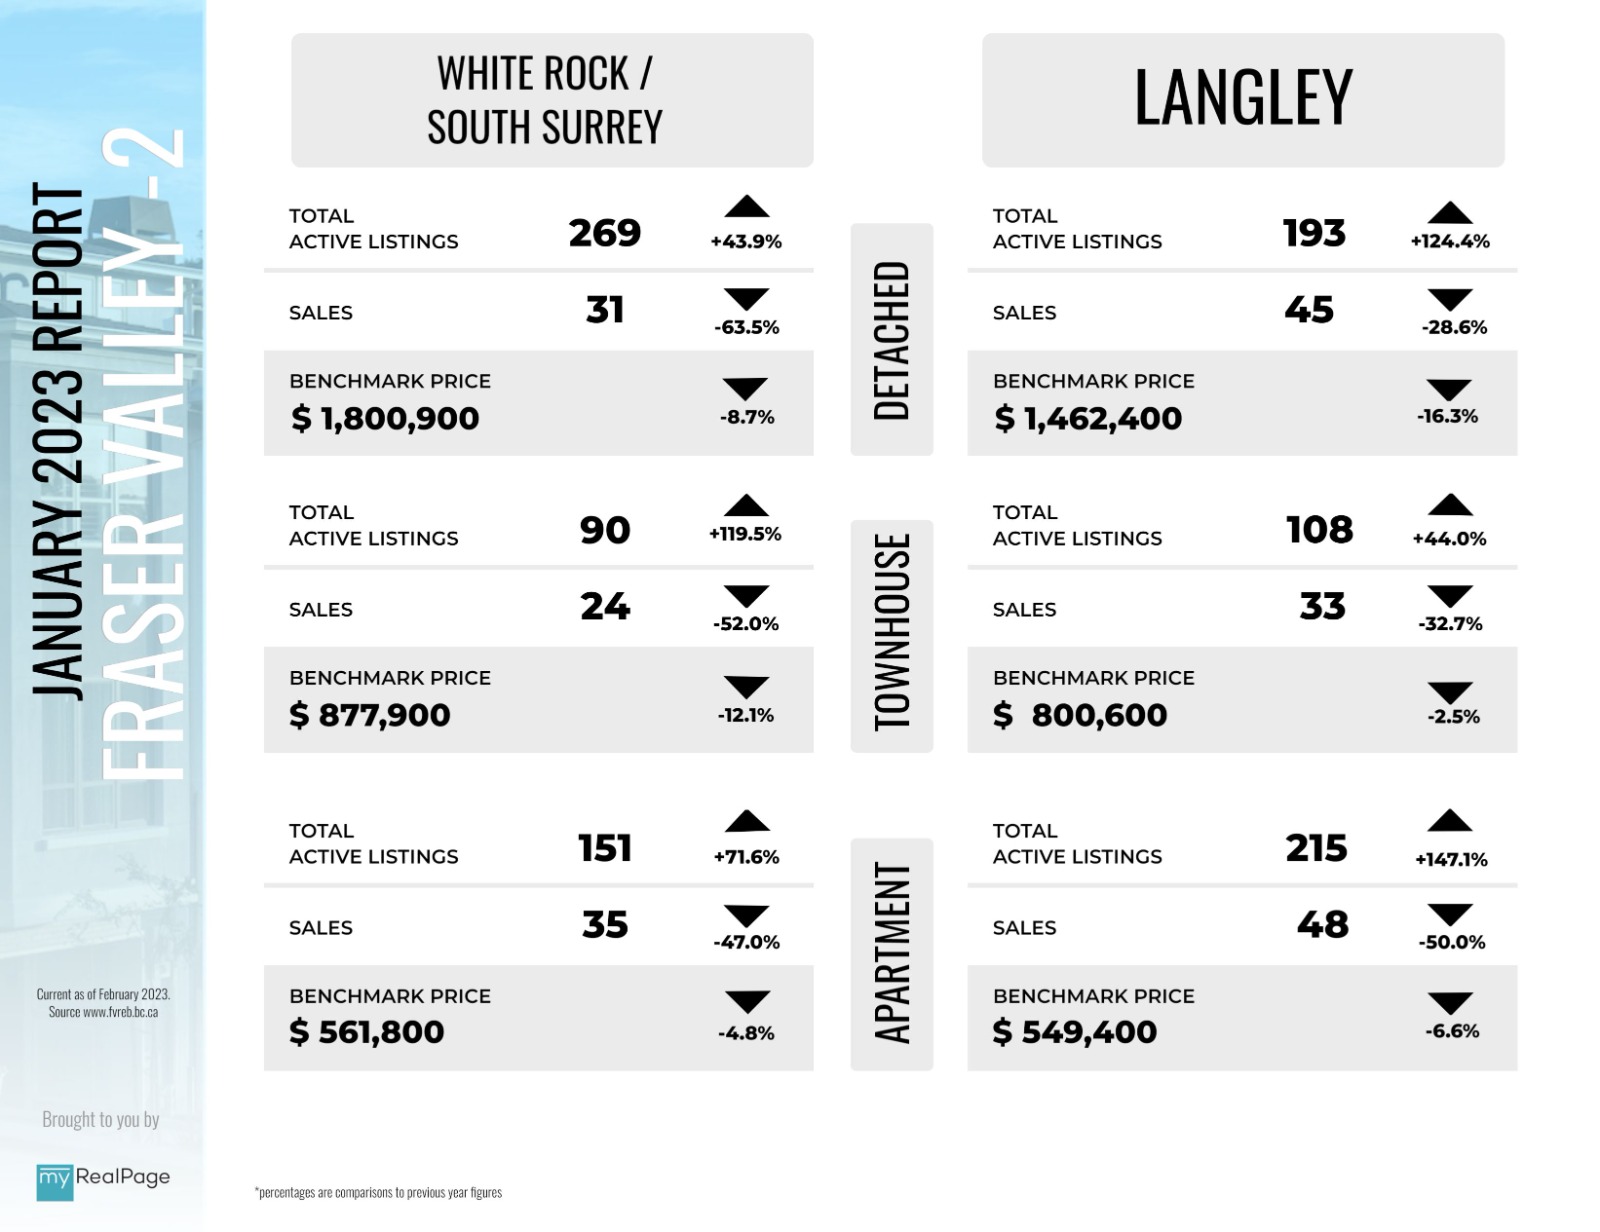
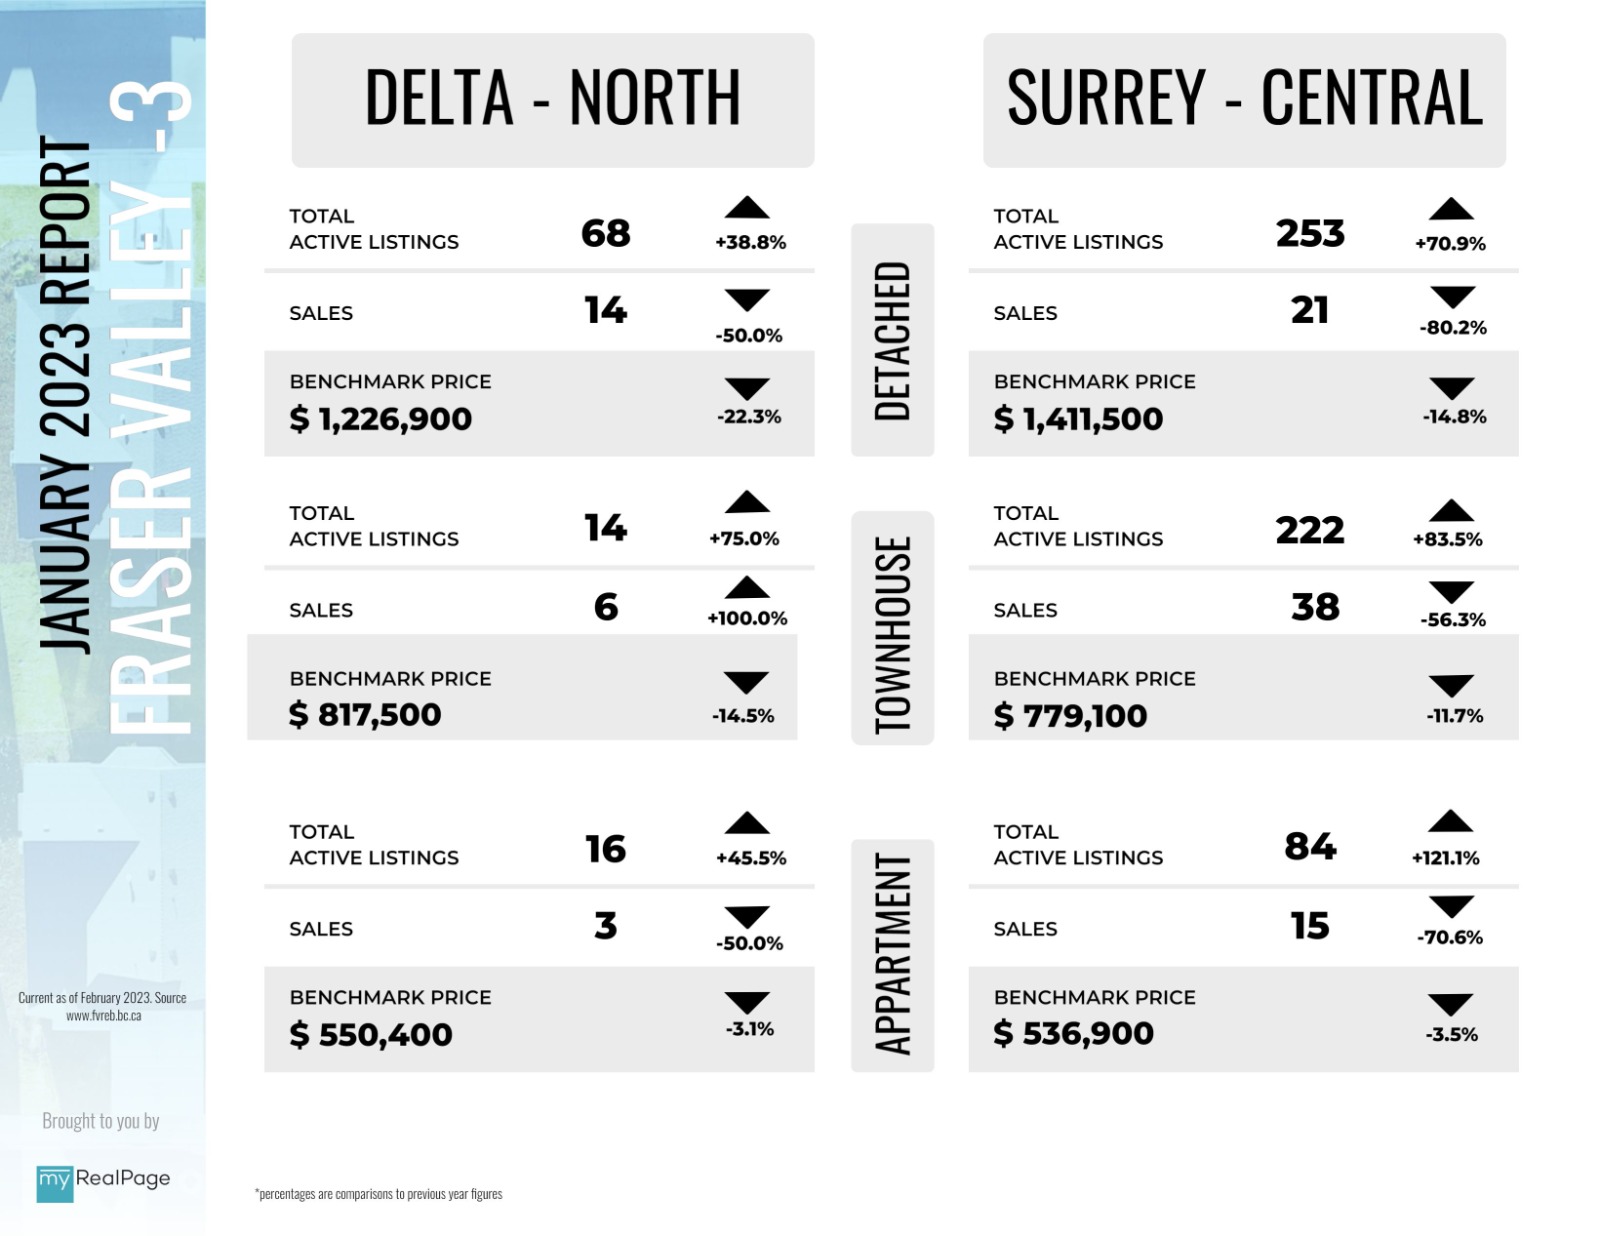
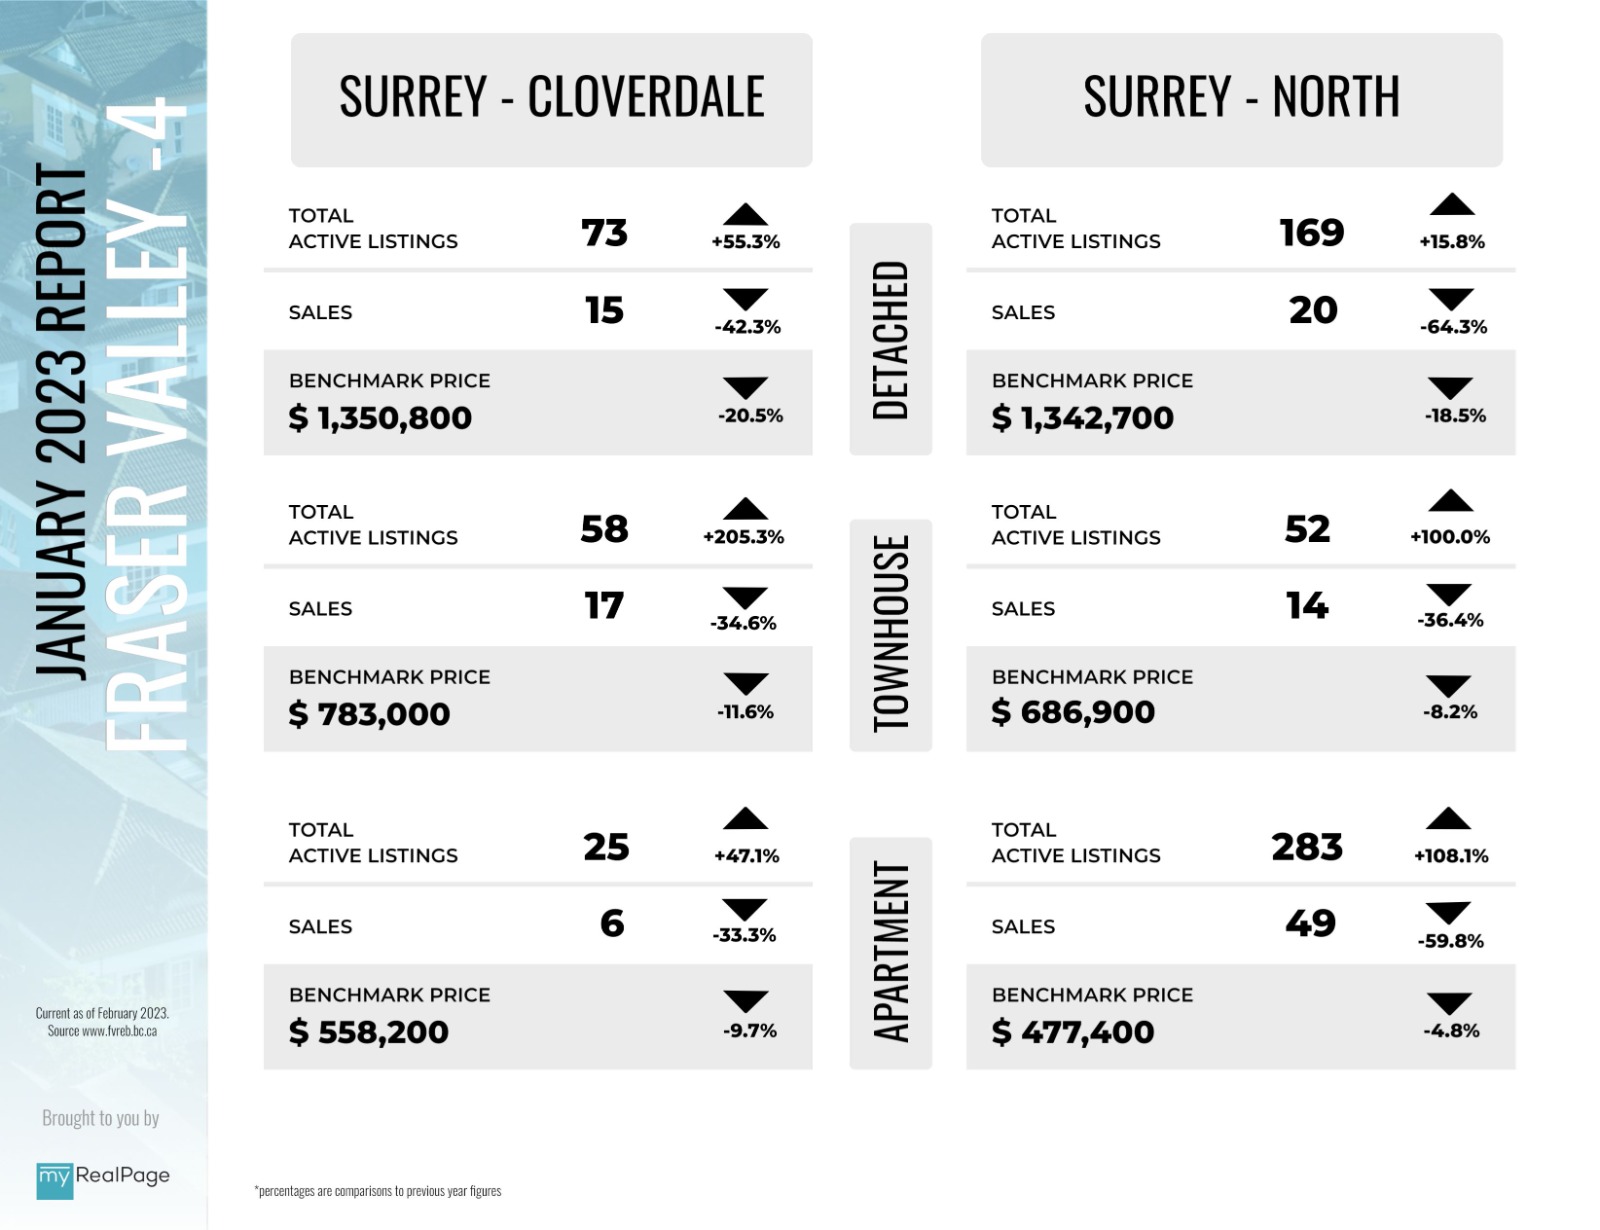
The following data is a comparison between January 2023 and January 2022 numbers, and is current as of February 2023. For last month’s report, check out our previous infographic!
Or follow this link for all our FVREB Infographics!
These infographics cover current trends in Fraser Valley neighbourhoods that are within the FVREB. Click on the images for a larger view!
Download Printable Version – FVREB January 2023 Market Report 1
Download Printable Version – FVREB January 2023 Market Report 2
Download Printable Version – FVREB January 2023 Market Report 3
Download Printable Version – FVREB January 2023 Market Report 4
Last Updated on February 3, 2023 by myRealPage
