INFOGRAPHICS: June 2019 FVREB Fraser Valley, South Surrey, Etc. Market Reports

Ready for summer? Here are this month’s market updates for the Fraser Valley Real Estate Board (FVREB).
As noted in their latest media release, both buyers and sellers are currently taking a wait-and-see approach in the Fraser Valley markets.
June’s property sales in the Fraser Valley were 29.3% below the 10-year sales average for June and were the second lowest total for the month since the year 2000. The number of new listings also decreased in June, coming in at 9.6% below the 10-year average for the number of listings received during that month.
The Fraser Valley Real Estate Board processed 1,306 sales of all property types on its Multiple Listing Service® (MLS®) in June, a 13.9% decrease compared to sales in May 2019, and a 10.1% decrease compared to the 1,452 sales in June of last year.
As stated by Board President Darin Germyn,
“The Fraser Valley market is still adjusting to the federal government’s new mortgage requirements and to the provincial government’s speculation and vacancy taxes. We’re seeing historically low levels for home purchases in our region, and yet at the same time we’re seeing some prospective sellers holding back on listing their homes; waiting to see what the market will do.
This has created a great opportunity for buyers in the Fraser Valley. Inventory overall is growing; prices of typical homes have decreased on average 6 to 10% over the past year and interest rates are still holding firm.
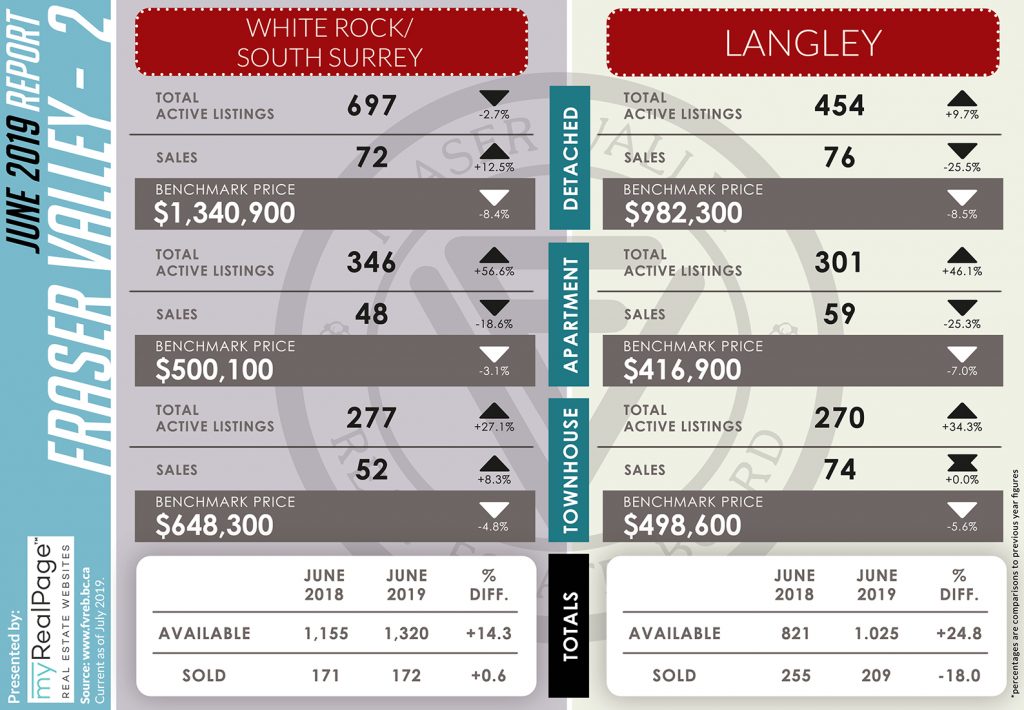
There is tremendous variation in the market depending on the property type and location. It’s currently a buyers’ market for detached homes in South Surrey/White Rock; but is leaning towards a sellers’ market for townhomes in Langley, so if you’re considering taking advantage of the market slowdown, first, talk to your REALTOR®.”
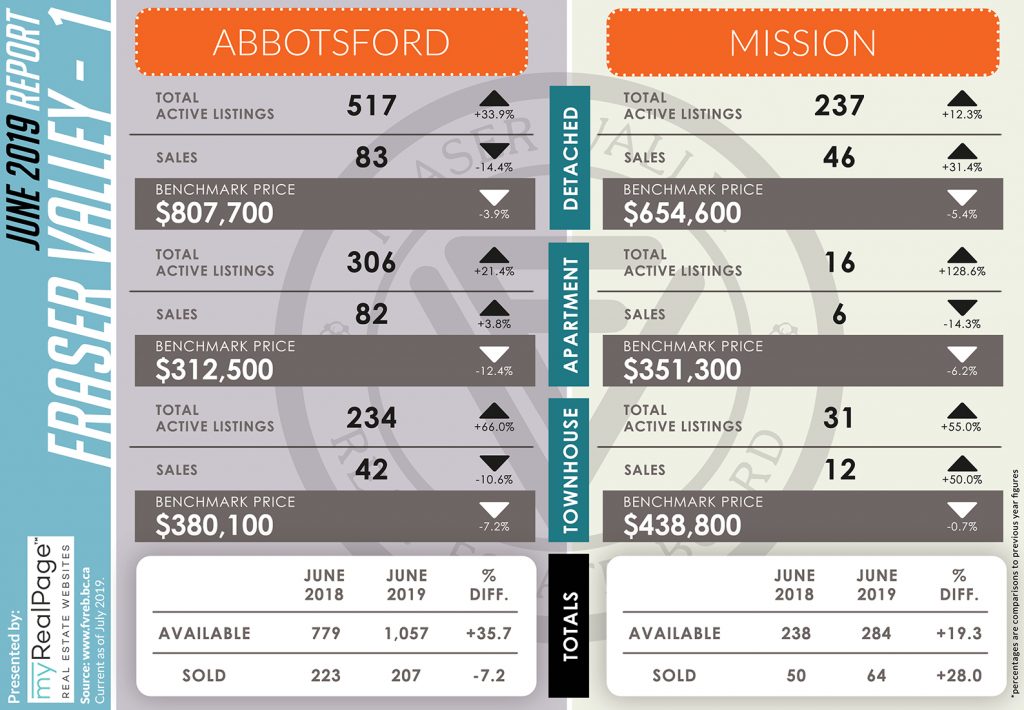
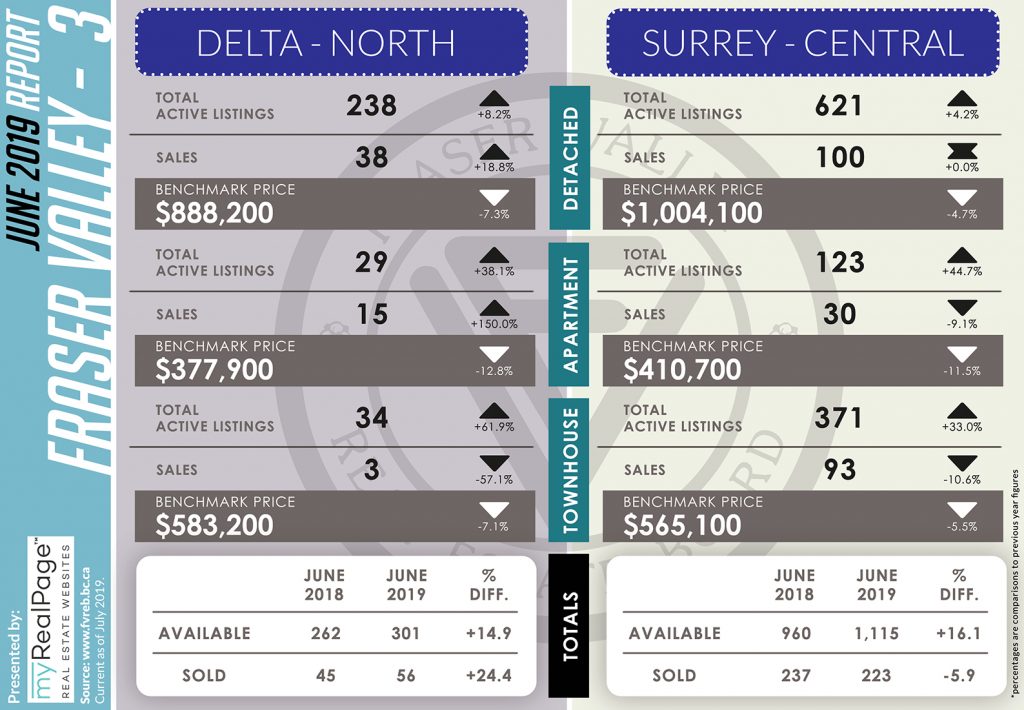
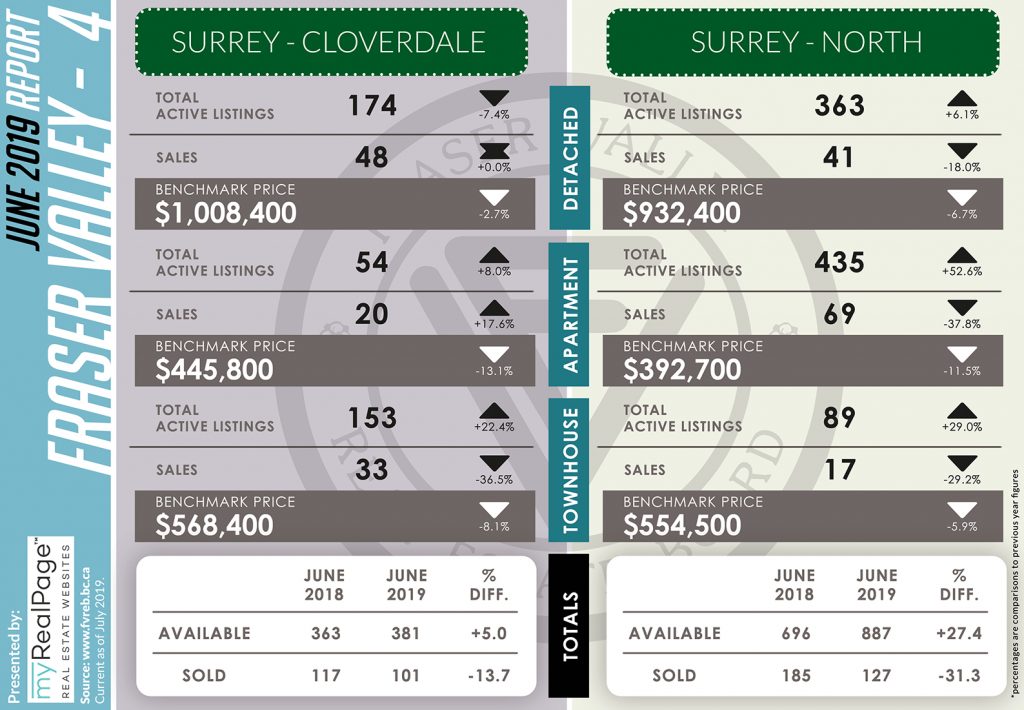
The following data is a comparison between June 2018 and June 2019 numbers, and is current as of July 2019. For last month’s report, check out our previous infographic!
Or follow this link for all our FVREB Infographics!
These infographics cover current trends in Fraser Valley neighbourhoods that are within the FVREB.
Click on the images for a larger view!
(Protip: Make sure to grab the printable PDF version, too! It fits best when printed on A4-sized sheets, AND we’ve added an area on the sheet where you can attach your business card! 🙂 )
Download Printable Version – FVREB June 2019 Market Report


