INFOGRAPHICS: June 2019 TREB Toronto Market Reports
Summer is starting out strong for the Toronto area! Here’s the latest real estate market updates for areas covered by the Toronto Real Estate Board (TREB)!
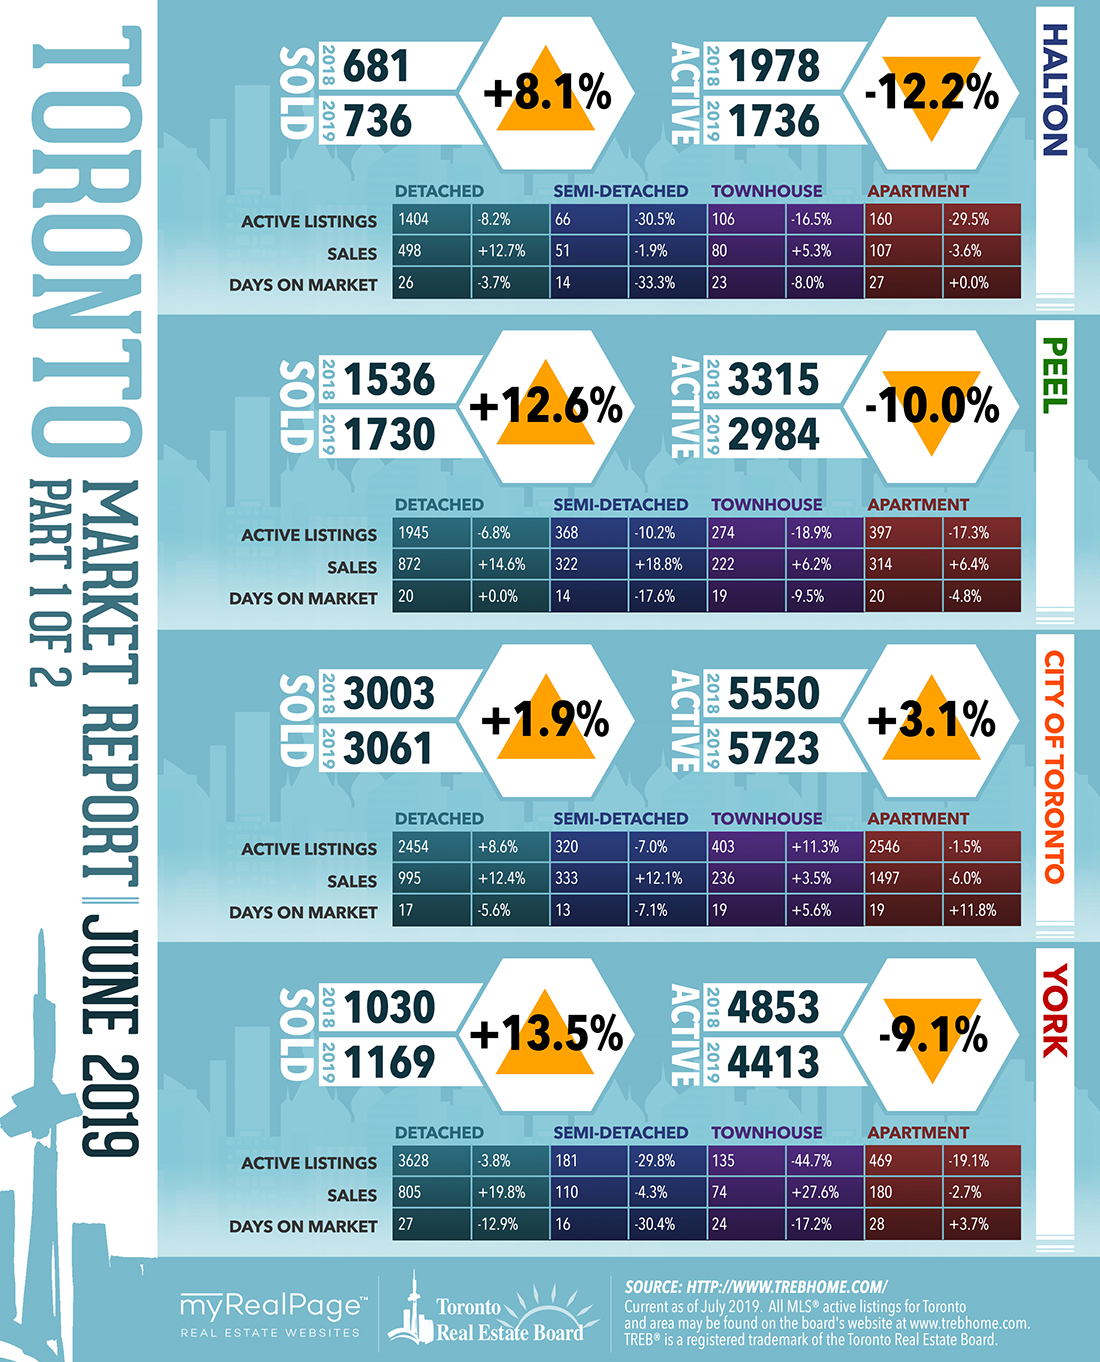
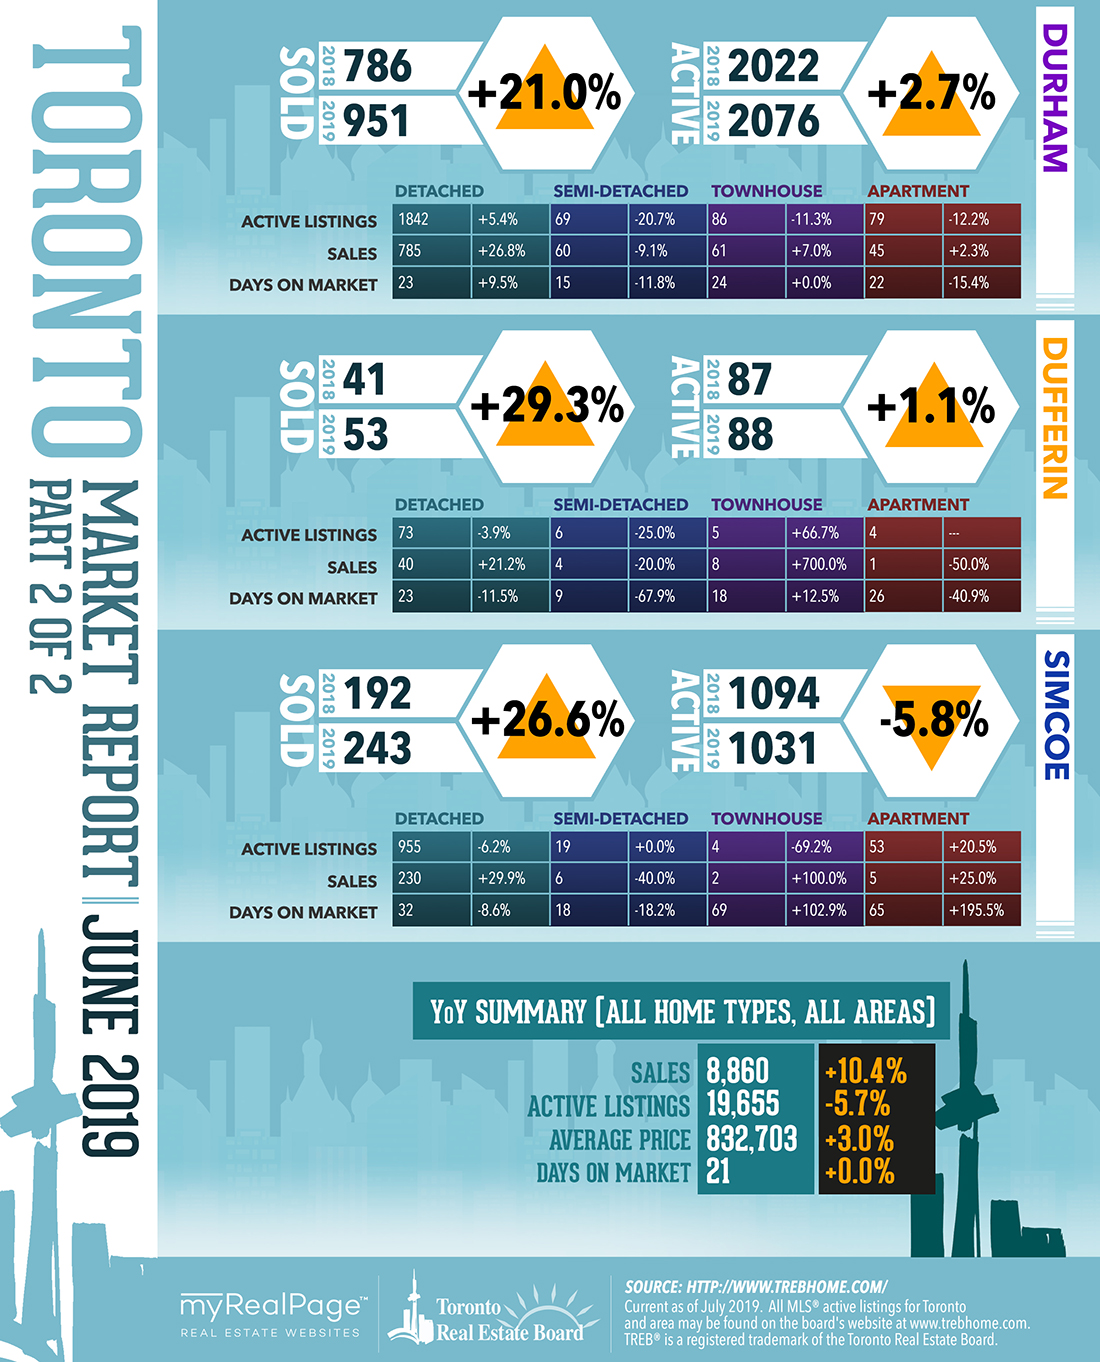
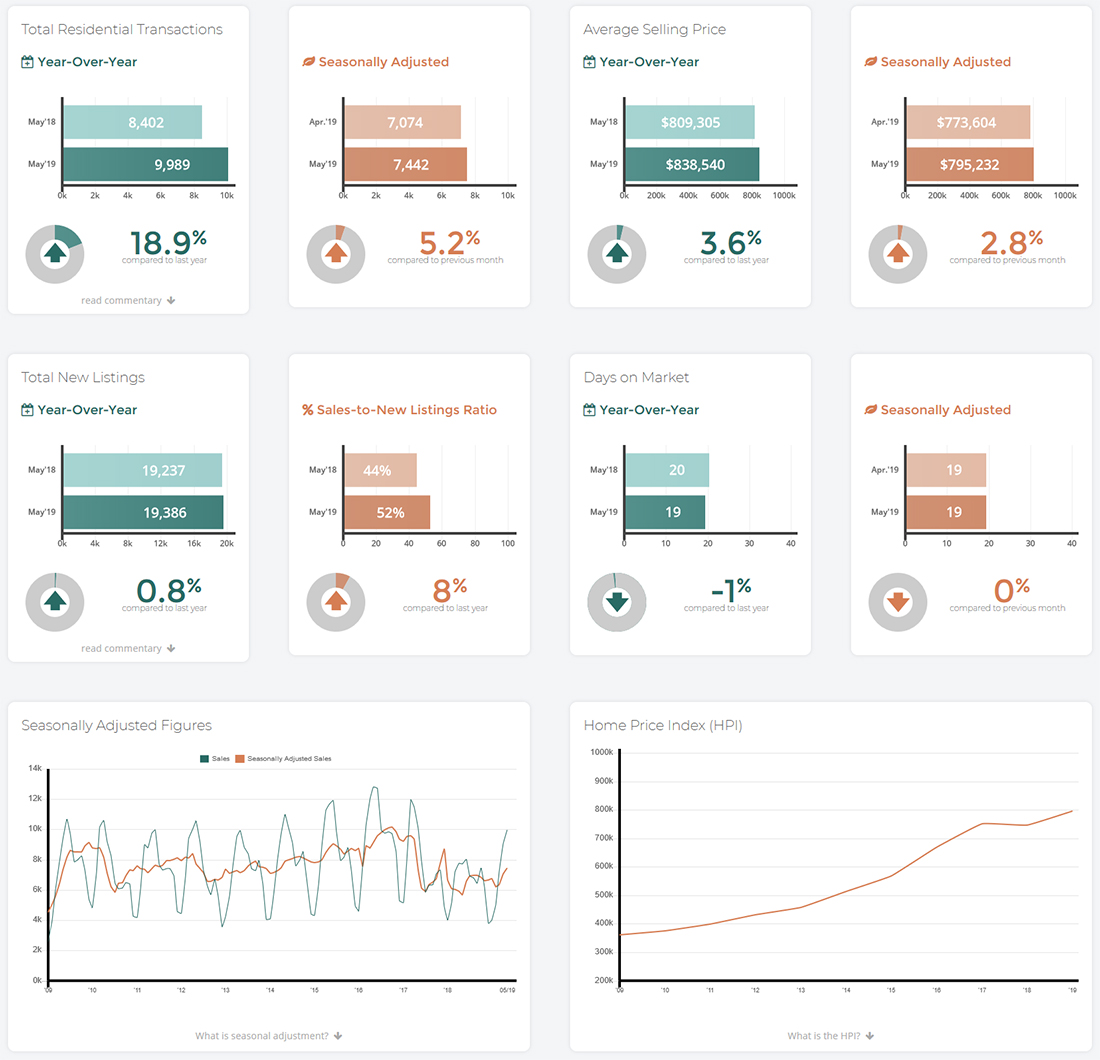
In their most recent market report, Greater Toronto Area REALTORS® reported 8,860 sales through TREB’s MLS® System in June 2019, representing a 10.4% increase compared to June 2018. Over the same time period, total new listings remained at a similar level for the month of June and active listings at month-end were down by 5.7%.
Sales and new listings statistics for the first half of 2019 compared to the same period in 2018 painted a similar story to that of June. Sales were up by 8.5%, while new listings were up by less than 1%. This shows that sales accounted for a greater share of listings compared to last year, which means that competition between buyers increased, resulting in renewed price growth in many segments of the market.
 As remarked on by the new President of the Toronto Real Estate Board, Michael Collins,
“As I start my term as President of the Toronto Real Estate Board, I am proud to say that the Greater Toronto Area continues to grow, in terms of employment, population and overall diversity. As people are attracted to our region from all around the world, they obviously need a place to live.
Over the next year, as demand for ownership and rental housing continues to grow, my hope is that we will see more movement from policy makers on two fronts: alleviating the constrained supply of housing and providing more flexibility around demand-side policies, including the OSFI two percentage point mortgage stress test and allowable amortization periods on insured mortgages.”
Jason Mercer, TREB’s Chief Market Analyst also adds,
“Buyers started moving off the sidelines in the spring, as evidenced by strong year-over-year price growth throughout the second quarter.
However, because we saw virtually no change in the number of new listings, market conditions tightened and price growth picked up, especially for more higher density home types, which, on average, are less-expensive than traditional detached houses and therefore provide more affordable housing options under the new OSFI stress test regime.”
Last but not least, TREB CEO John DiMichele also notes,
“While some home buyers may have adjusted to the OSFI stress test by looking to more affordable housing options, this could present an issue over the longer term because we aren’t adding a meaningful amount of new mid-density housing supply to bridge the gap between condominium apartments and detached houses.
Finding ways to add more mid-density housing types to existing neighbourhoods and new developments needs to be a key component of municipal, provincial and federal housing plans and policies moving forward.”
UPDATE: In January 2020, TREB has since rebranded to TRREB, the Toronto Regional Real Estate Board.
The following data is a comparison between June 2018 and June 2019 numbers, and is current as of July 2019. For last month’s numbers, check out our previous infographic!
Or follow this link for all our TREB Infographics!
Click on the images for a larger view!
(Protip: Make sure to grab the printable PDF versions, too! It fits best when printed on A4-sized sheets, AND we’ve added an area on the sheet where you can attach your business card! 🙂 )
Download Printable Version – June 2019 TREB, Toronto Market Report
(Image Source: TREBhome.com)
Last Updated on July 25, 2022 by myRealPage
