INFOGRAPHICS: June 2020 VIREB Vancouver Island Market Reports

Housing Market Rebounds in June
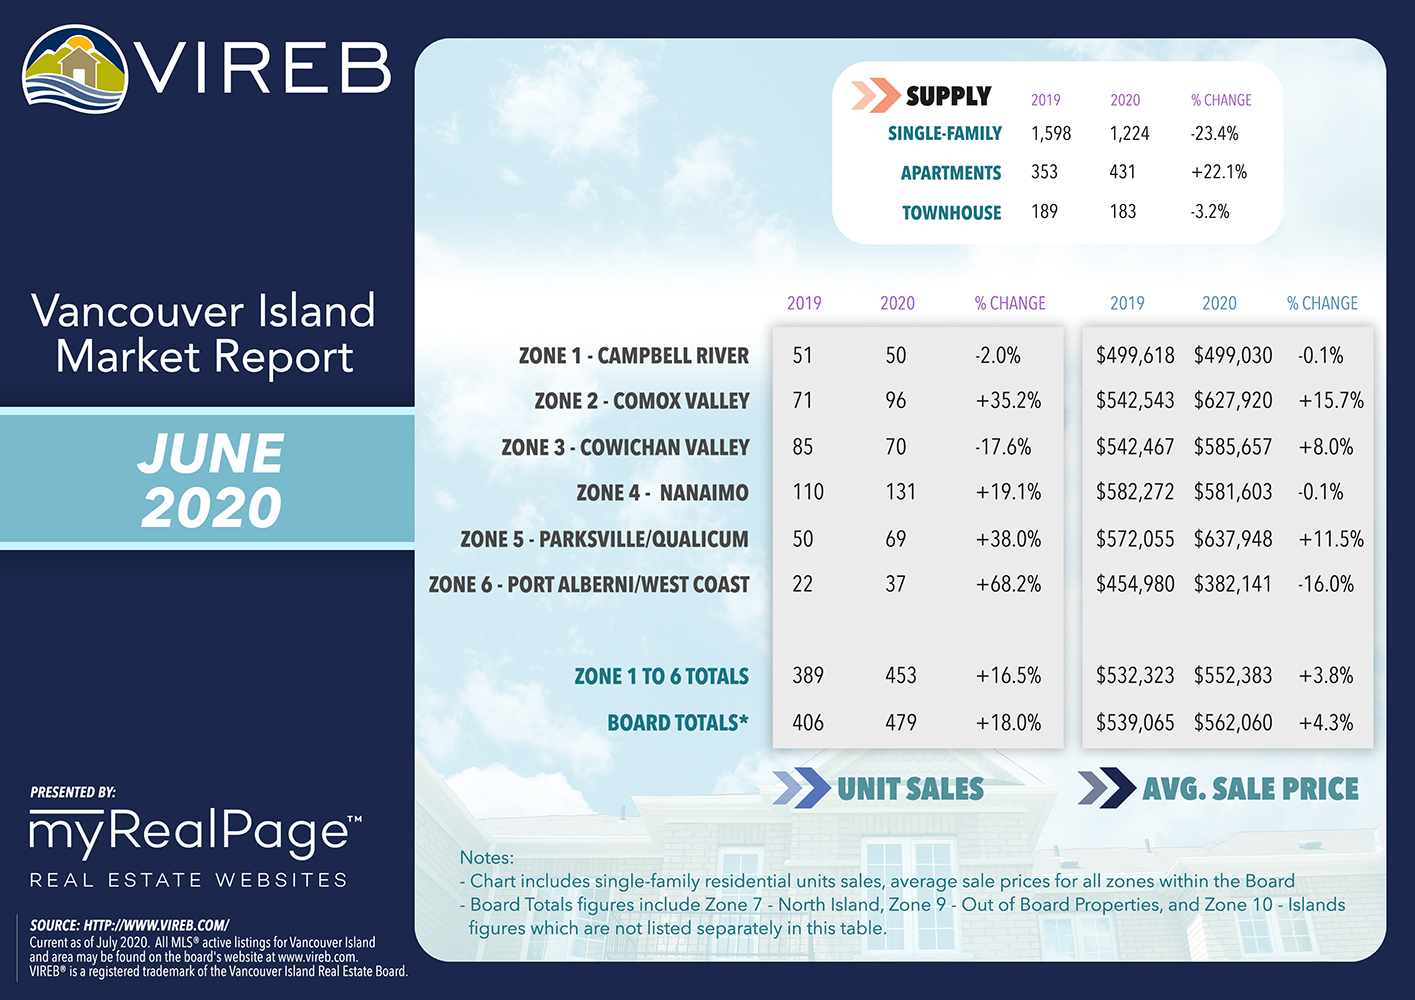
The COVID-19 effect on VIREB’s housing market seemingly wore off in June, with sales rebounding significantly from May and posting year-over-year increases in most markets.
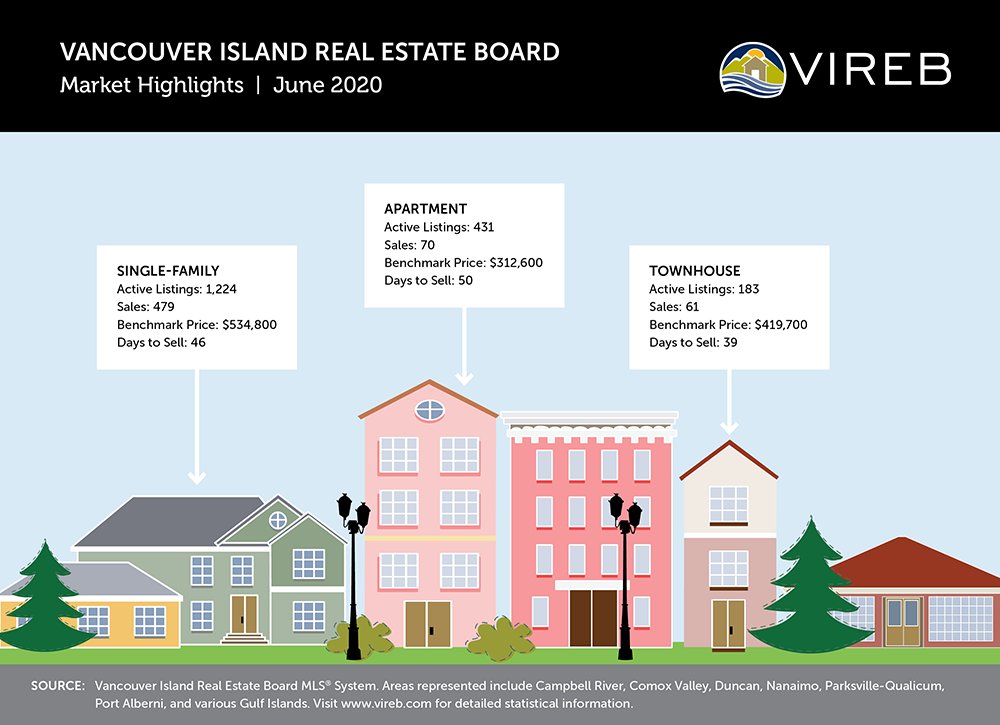
Last month, 479 single-family homes sold on the Multiple Listing Service® (MLS®) System compared to 246 in May 2020 and 406 one year ago. Sales of apartments increased by 3% year over year but were 59% higher than in May. Townhouse sales rose by 3% year over year and were up by 118% from May 2020.
Read the full report on the VIREB website!
The following data is a comparison between June 2019 and June 2020 numbers, and is current as of July 2020. Click here to check out last month’s infographics.
You can also view all our VIREB infographics by clicking here.
Click on the images for a larger view! (Protip: Make sure to grab the printable PDF versions, too! It fits best when printed on A4-sized sheets, AND we’ve added an area on the sheet where you can attach your business card! 🙂 )
Download Printable Version – June 2020 VIREB Market Report
Last Updated on July 25, 2022 by myRealPage
