INFOGRAPHICS: March 2020 VREB Victoria Market Reports

It’s been a challenging past few weeks for everyone, and we sincerely hope that everyone is safe and well. For now, here are the latest monthly figures for areas covered by the Victoria Real Estate Board (VREB)!
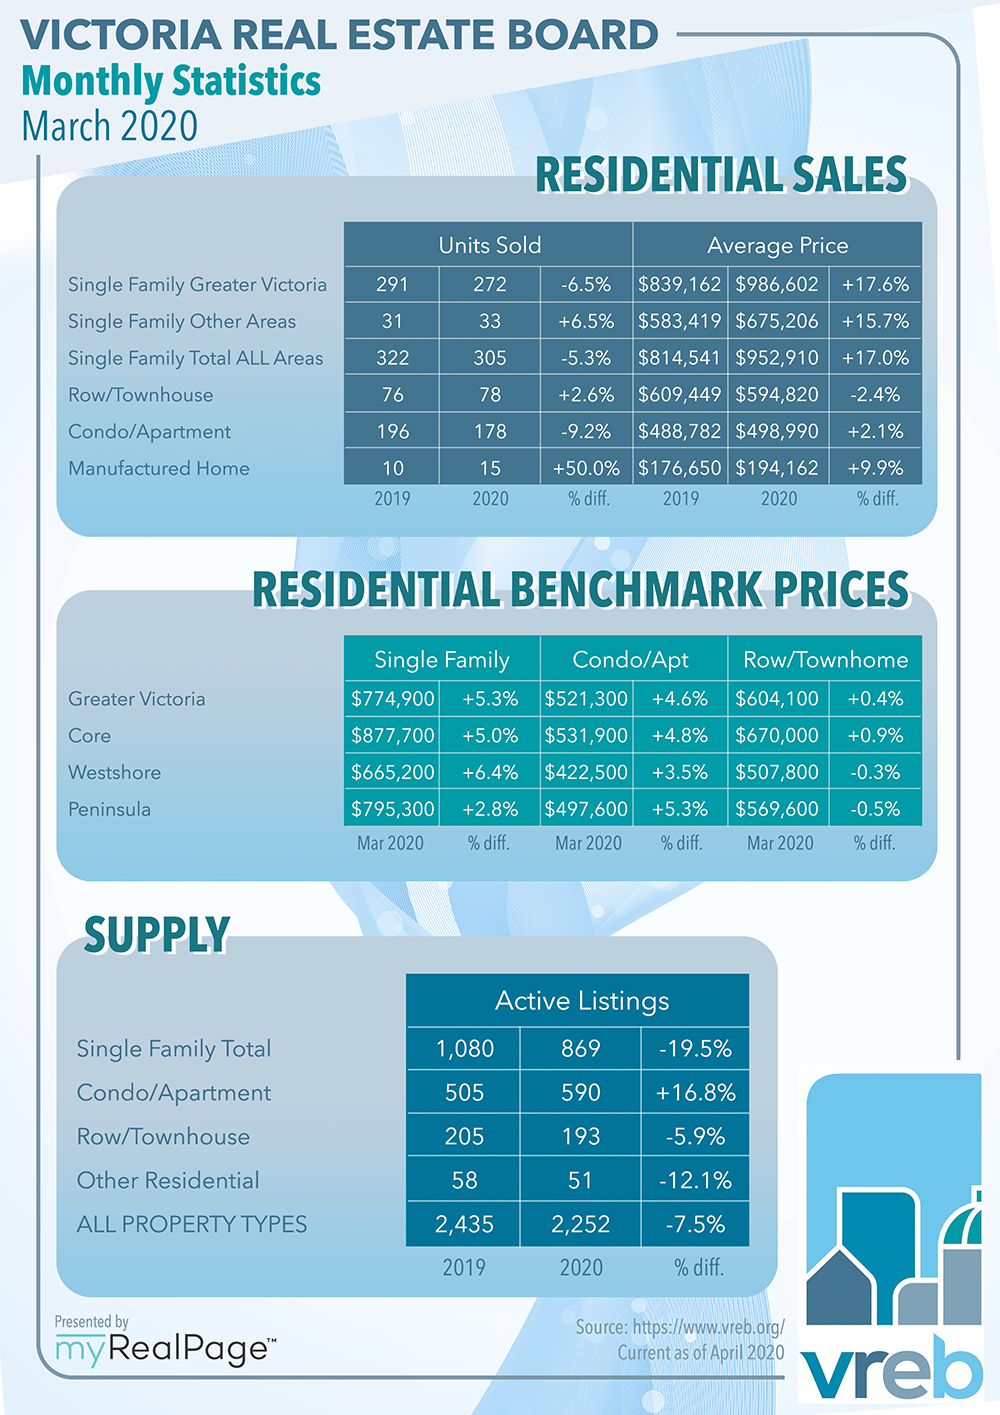
As noted on their latest media release, a total of 608 properties sold in the Victoria Real Estate Board region this March, 5% fewer than the 640 properties sold in March 2019 but 8% more than the previous month of February 2020. Sales of condominiums were down 9.2% from March 2019 with 178 units sold. Sales of single family homes decreased 5.3% from March 2019 with 305 sold.
There were 2,252 active listings for sale on the Victoria Real Estate Board Multiple Listing Service® at the end of March 2020, 7.5% fewer properties than the total available at the end of March 2019 but a 5.9% increase from the 2,127 active listings for sale at the end of February 2020.
As per Victoria Real Estate Board President Sandi-Jo Ayers,
“Last month, we stated that we saw the spring market kicking off. The start of March continued that trend and we saw higher year over year sales for the first weeks of the month – spring had officially sprung with multiple offers, new listings and sales. And then the world changed. Since the COVID-19 pandemic was declared, we have tracked a predictable downturn of sales in our market. Moving forward it is hard to predict what our spring market will look like, but it will likely be very different than recent years as our entire community slows down to stay healthy.
Right now, it is not business as usual. Our REALTORS® are working to ensure that services for clients who need them are delivered in a healthy, safe and secure way. Our industry is working with government stakeholders to make sure that transactions that were underway before the pandemic was declared are protected and that homeowners are able to complete sales and purchases. This is a time to ensure our clients are safeguarded as well as to ensure that our community stays healthy. Many Realtors are leveraging new technologies including video home tours and virtual showings. Our message is – if you need us, we are here.”
The following data is a comparison between March 2019 and March 2020 numbers, and is current as of April 2020. Click here to check out last month’s figures!
Follow this link for all our Victoria Board monthly infographics!
Click on the images for a larger view!
(Protip: Make sure to grab the printable PDF versions, too! It fits best when printed on A4-sized sheets, AND we’ve added an area on the sheet where you can attach your business card! 🙂 )
Download Printable Version – March 2020 VREB, Victoria Market Report
Last Updated on July 25, 2022 by myRealPage
