INFOGRAPHICS: March 2022 CREB City And Region Market Reports

Record high sales seen again in March
For the second month in a row, sales activity not only reached a monthly high but also hit new all-time record highs for any given month. Gains occurred across all property types as they all hit new all-time record highs.
An increase in new listings this month helped support the growth in sales activity. However, inventories have remained relatively low, ensuring the market continues to favour the seller.
“While supply levels have improved from levels seen over the past four months, inventory levels are still well below what we traditionally see in March, thanks to stronger than expected sales activity,” said CREB® Chief Economist Ann-Marie Lurie. “With just over one month of supply in the market, the persistently tight market conditions continue to place significant upward pressure on prices.”
With an unadjusted benchmark price of $518,600 this month, the monthly gain increased by another four per cent. After three consecutive gains, prices have risen by nearly $55,000 since December and currently sit nearly 18 per cent higher than last year’s levels.
Read the full report on the CREB website!
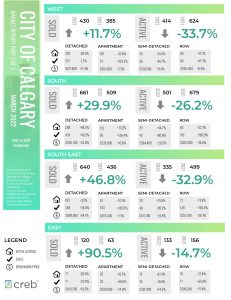
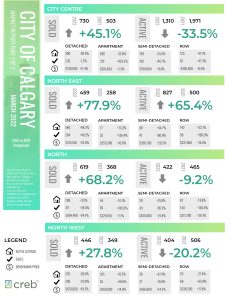
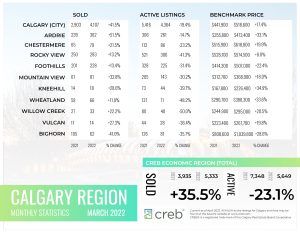
The following data is a comparison between March 2022 and March 2021 numbers, and is current as of April 2022. For last month’s numbers, check out our previous infographic.
Or follow this link for all our CREB Infographics!
Click on the images for a larger view!
Download Printable Version – March 2022 CREB, City of Calgary Report Part 1
Download Printable Version – March 2022 CREB, City of Calgary Report Part 2
Download Printable Version – March 2022 CREB, Calgary Region Report
Last Updated on November 28, 2023 by myRealPage


