INFOGRAPHICS: February 2022 CREB City And Region Market Reports

Sales continue to surge as listings rise
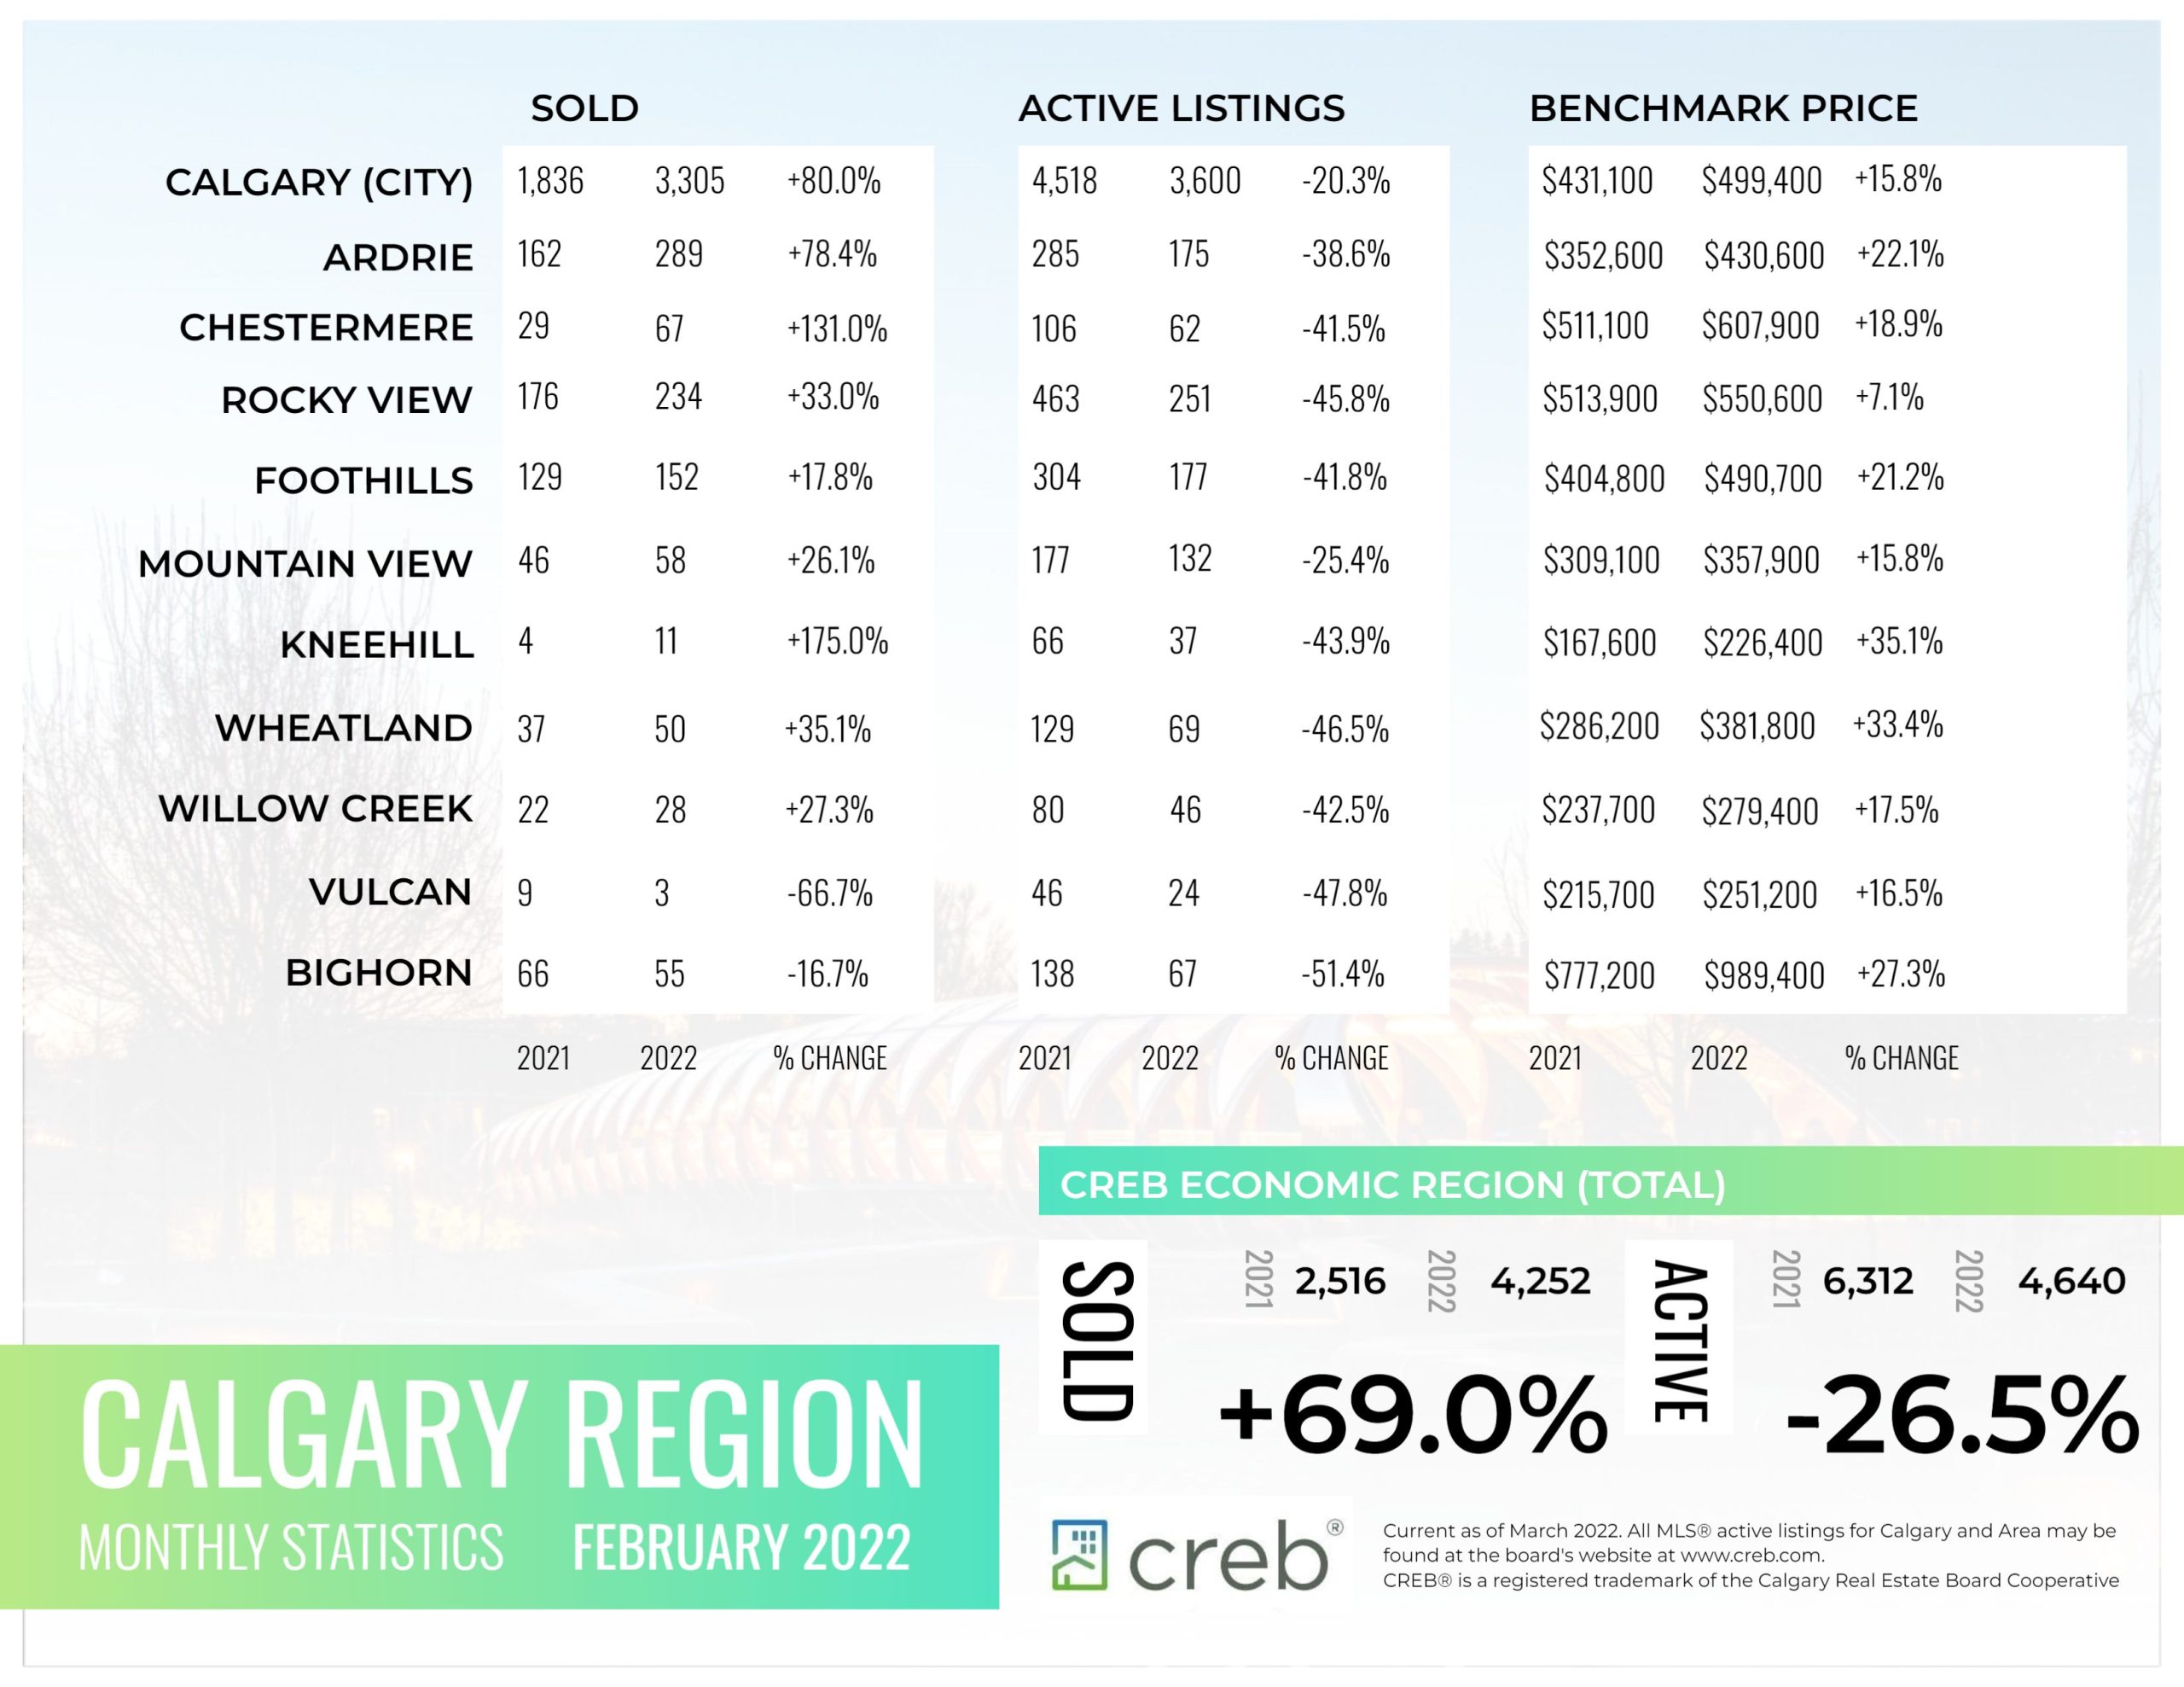
Thanks to a surge in new listings, sales activity reached a record high for the month of February with 3,305 sales. The rise in new listings caused adjusted inventories to rise above last months levels. However, with only one month of supply, the market continues to favour the seller.
“Sales have been somewhat restricted by the lack of supply choice in the market. While sellers did respond with a record level of new listings this month, the demand has been so strong that the housing market continues to remain undersupplied causing further price gains,” said CREB® Chief Economist Ann-Marie Lurie.
The total residential benchmark price for the city rose by nearly six per cent over January levels and was over 16 per cent higher than levels recorded last February. Much of the growth has been driven by the detached segment of the market which has not seen conditions this tight in over 15 years.
Read the full report on the CREB website!
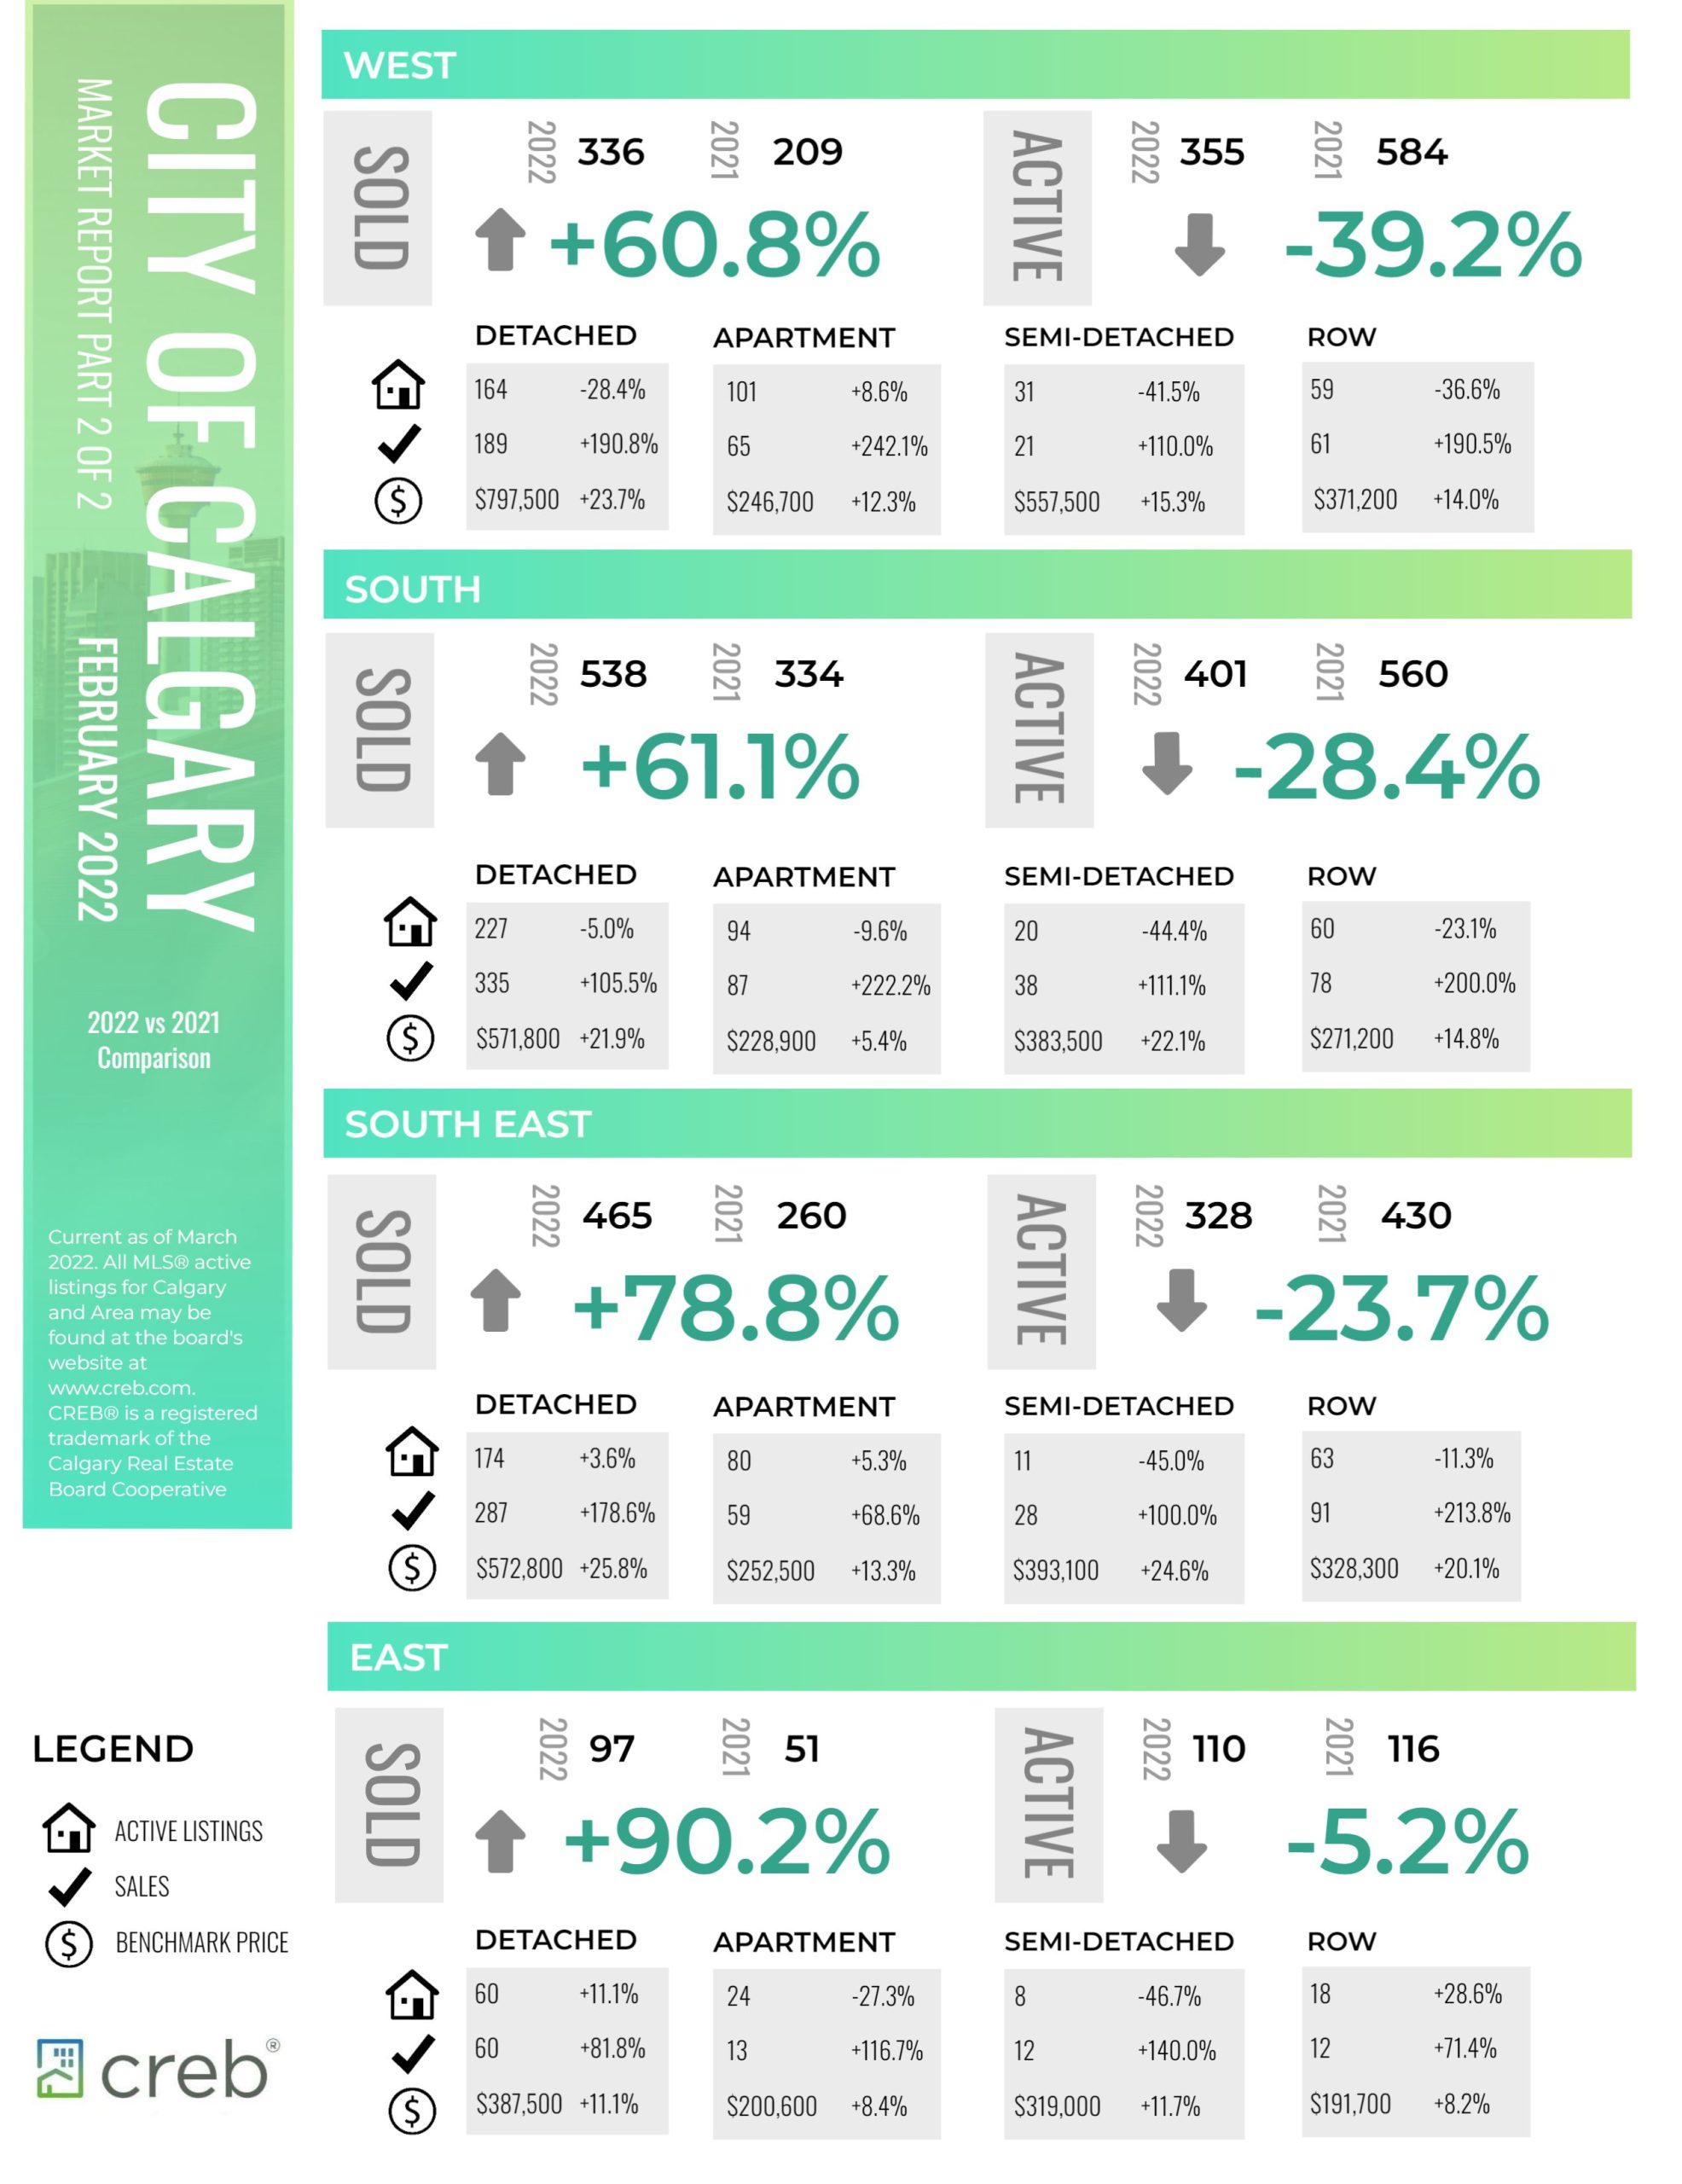
The following data is a comparison between February 2022 and February 2021 numbers, and is current as of March 2022. For last month’s numbers, check out our previous infographic.
Or follow this link for all our CREB Infographics!
Click on the images for a larger view!
Download Printable Version – February 2022 CREB, City of Calgary Report Part 1
Download Printable Version – February 2022 CREB, City of Calgary Report Part 2
Download Printable Version – February 2022 CREB, Calgary Region Report

Last Updated on November 28, 2023 by myRealPage
