INFOGRAPHICS: May 2018 FVREB Fraser Valley, South Surrey, etc. Market Reports

You asked, and we heard you!
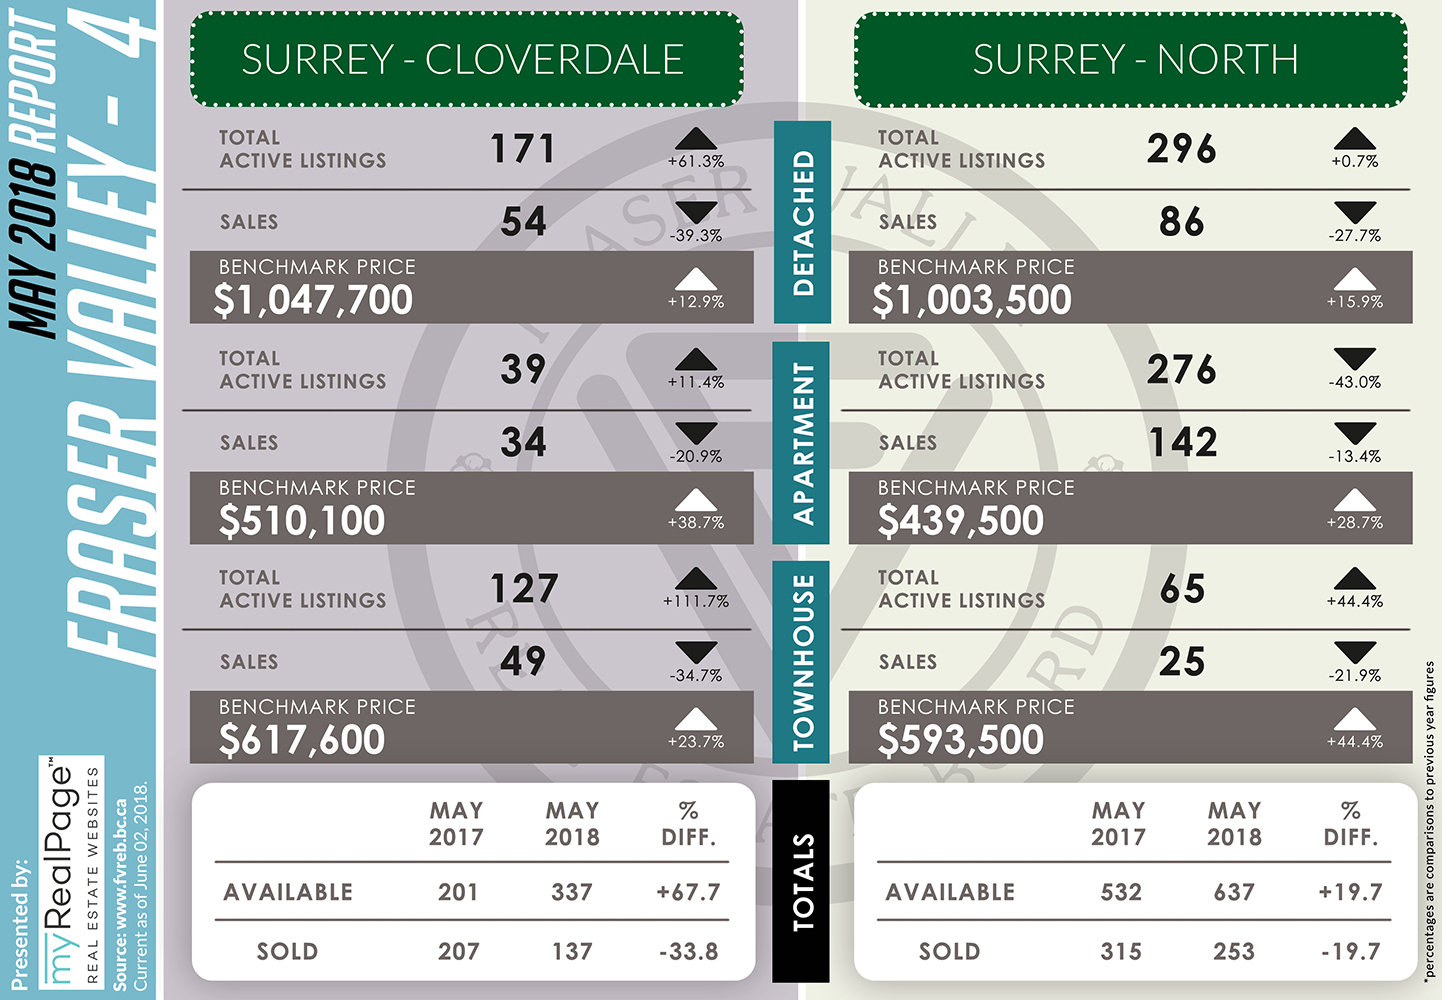
This month, we’re also presenting a new set of infographics to give you an update on how the Fraser Valley real estate market is doing.
According to the latest statistics and press release issued by the Fraser Valley Real Estate Board (FVREB), both sales and inventory have reached their highest points of the year so far. FVREB President John Barbisan has remarked that this is “the most inventory” that FVREB has had in two years, but that as the market begins to settle, it should open up “opportunities for buyers and less pressure to make fast decisions.”
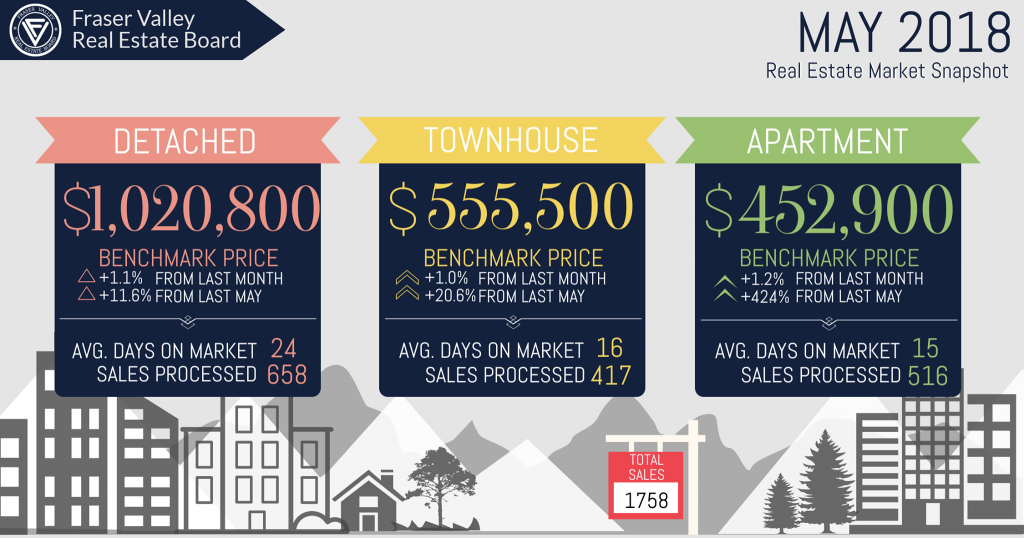
He also emphasizes that sales continue to be strong and that sellers can still look forward to plenty of potential, as long as they are equipped with the proper knowledge and understanding of the market. He then encourages everyone to consult with a REALTOR® “for informed perspective on what’s happening in your community and what your best options are.”
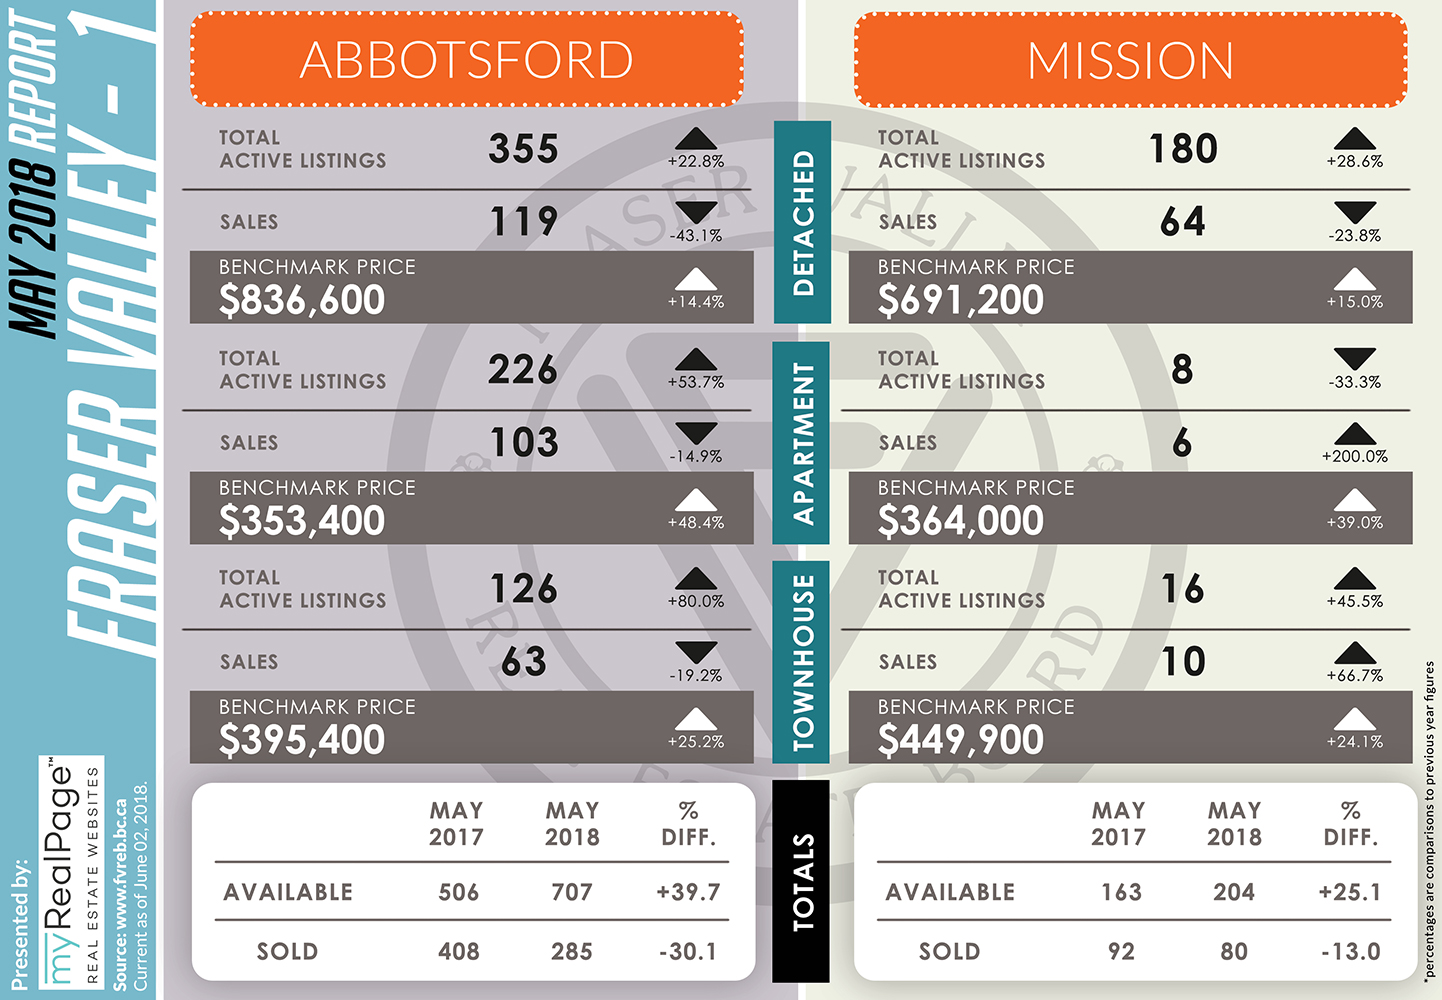
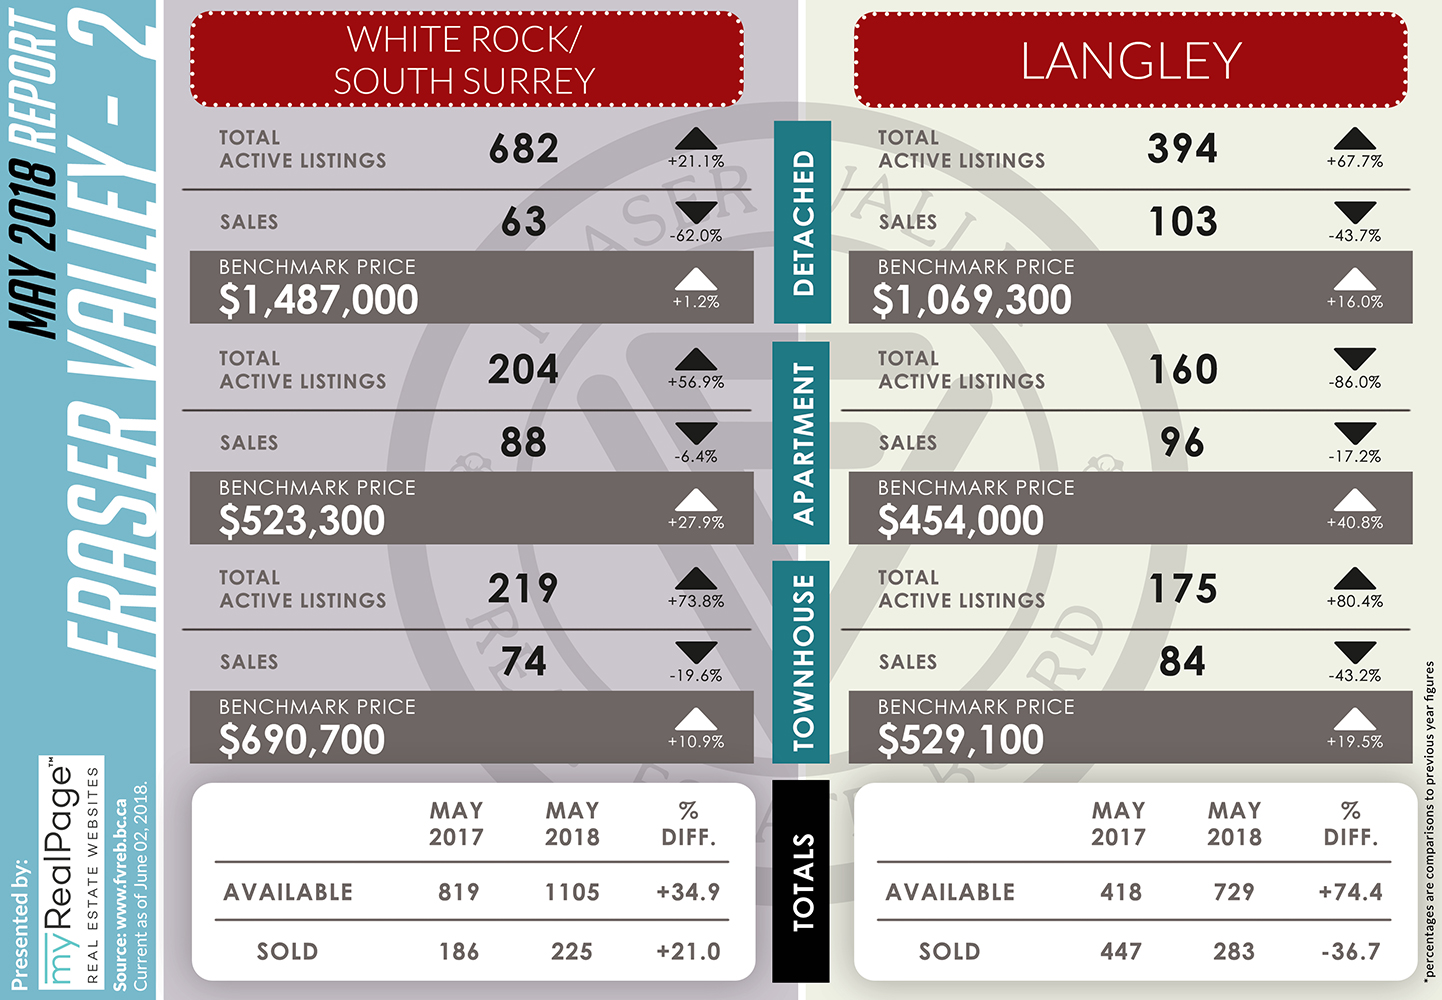
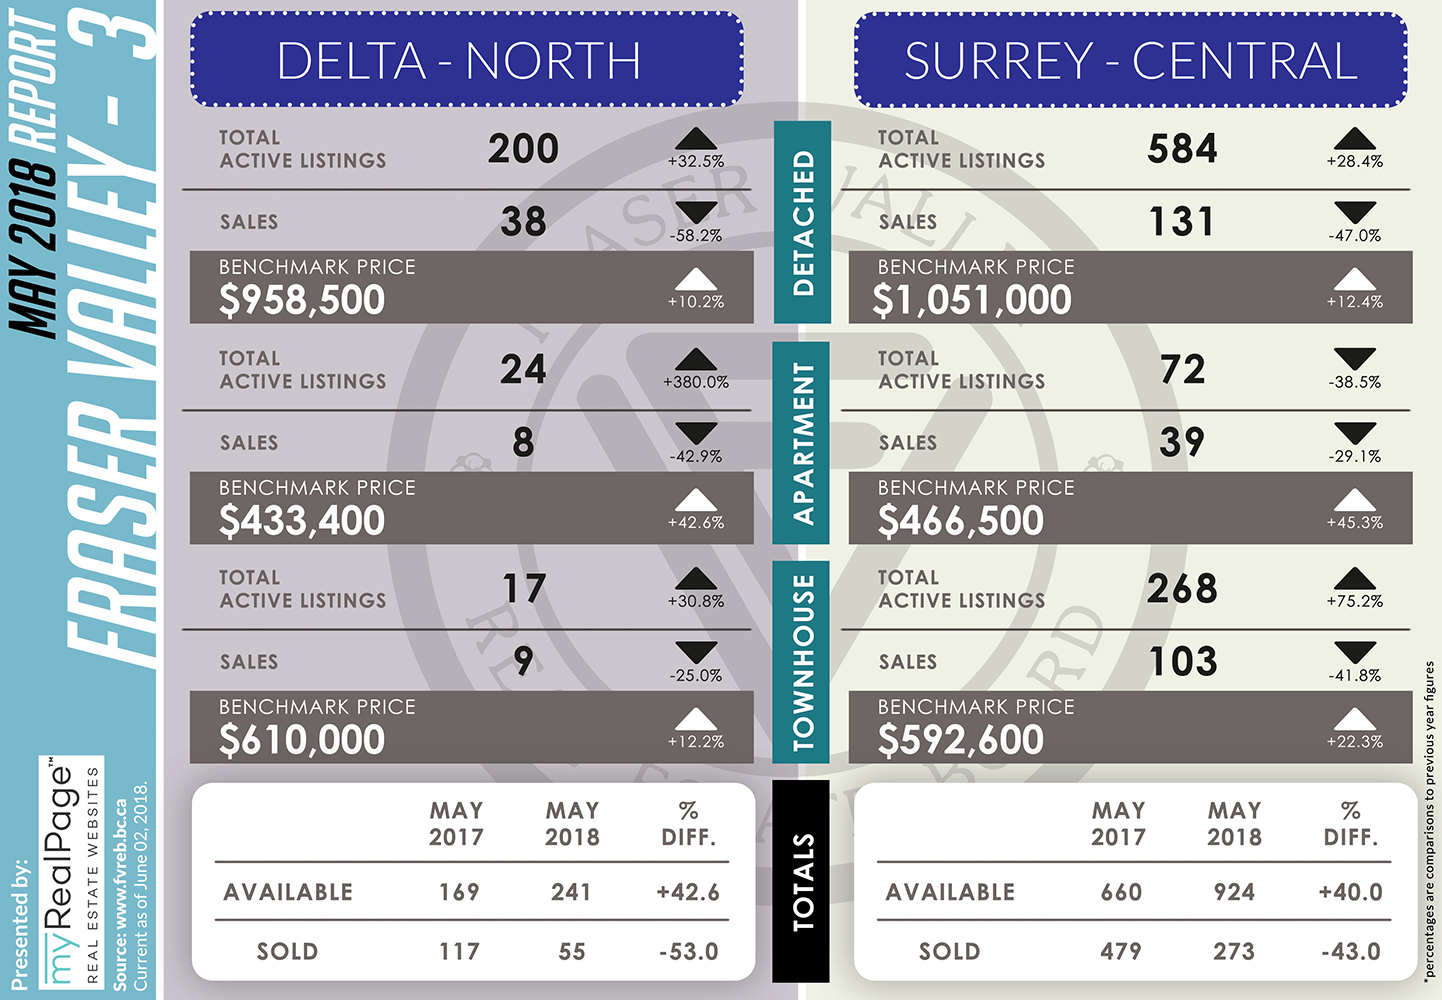
The following data is a comparison between May 2017 and May 2018 numbers, and is current as of June 2, 2018.
Or follow this link for all our FVREB Infographics!
These infographics cover current trends in Fraser Valley neighbourhoods that are within the FVREB.
Click on the images for a larger view!
(Protip: Make sure to grab the printable PDF version, too! It fits best when printed on A4-sized sheets, AND we’ve added an area on the sheet where you can attach your business card! 🙂 )
Download Printable Version – FVREB May 2018 Market Report
Last Updated on July 25, 2022 by myRealPage
