INFOGRAPHICS: May 2019 REBGV Greater Vancouver Market Reports

June is upon us, and as always, here’s our monthly market update for areas covered by the Real Estate Board of Greater Vancouver (REBGV)!
According to their most recent market update, May has seen modest increase in home sales while housing supply reaches a five-year high.
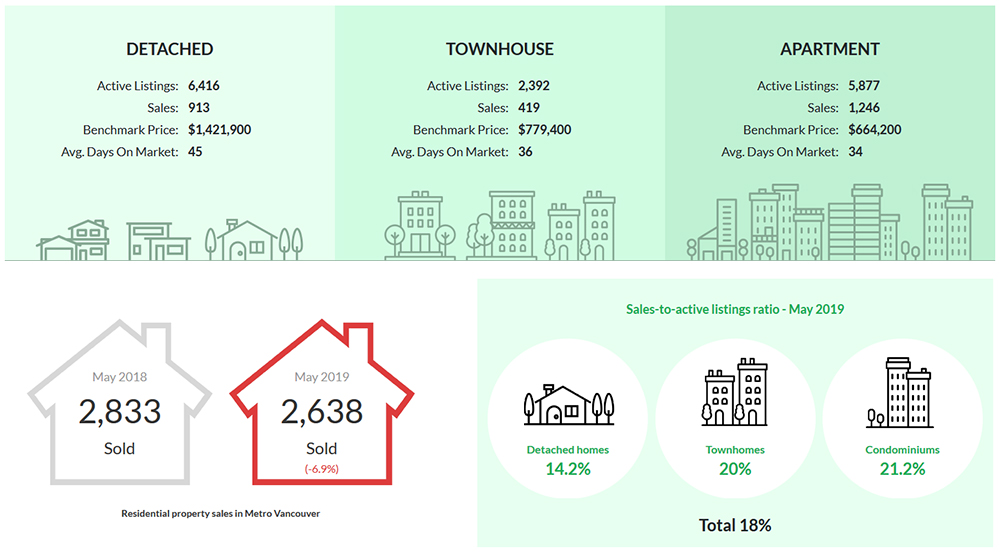
REBGV reports that residential home sales in the region totalled 2,638 in May 2019, a 6.9% decrease from the 2,833 sales recorded in May 2018, and a 44.2% increase from the 1,829 homes sold in April 2019. May sales were 22.9% below the 10-year May sales average and was the lowest total for the month since 2000.
The total number of homes currently listed for sale on the MLS® system in Metro Vancouver is 14,685, a 30% increase compared to May 2018 (11,292).
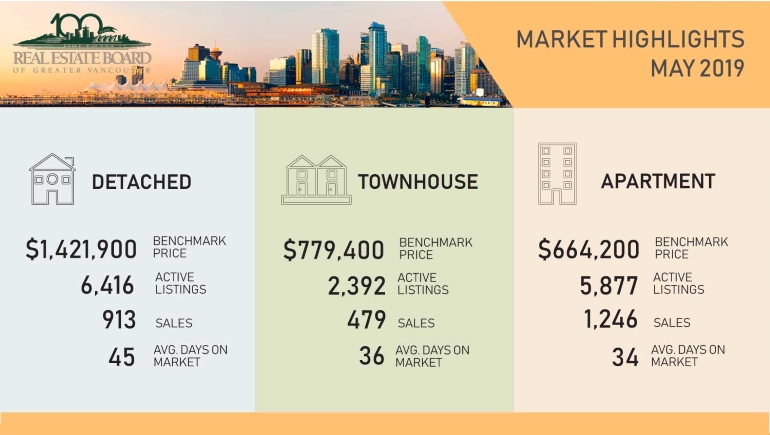
Sales of detached homes in May 2019 reached 913, a 1.4% decrease from the 926 detached sales recorded in May 2018. Sales of apartment homes reached 1,246 in May 2019, a 12.9% decrease compared to the 1,431 sales in May 2018. Lastly, attached home sales in May 2019 totalled 479, a 0.6% increase compared to the 476 sales in May 2018.
As noted by REBGV president Ashley Smith,
“High home prices and mortgage qualification issues caused by the federal government’s B20 stress test remain significant factors behind the reduced demand that the market is experiencing today.
Whether you’re a buyer looking to make an offer or a seller looking to list your home, getting your pricing right is the key in today’s market. To be competitive, it’s important to work with your local REALTOR® to assess and understand the latest trends in your neighbourhood and property type of choice.”
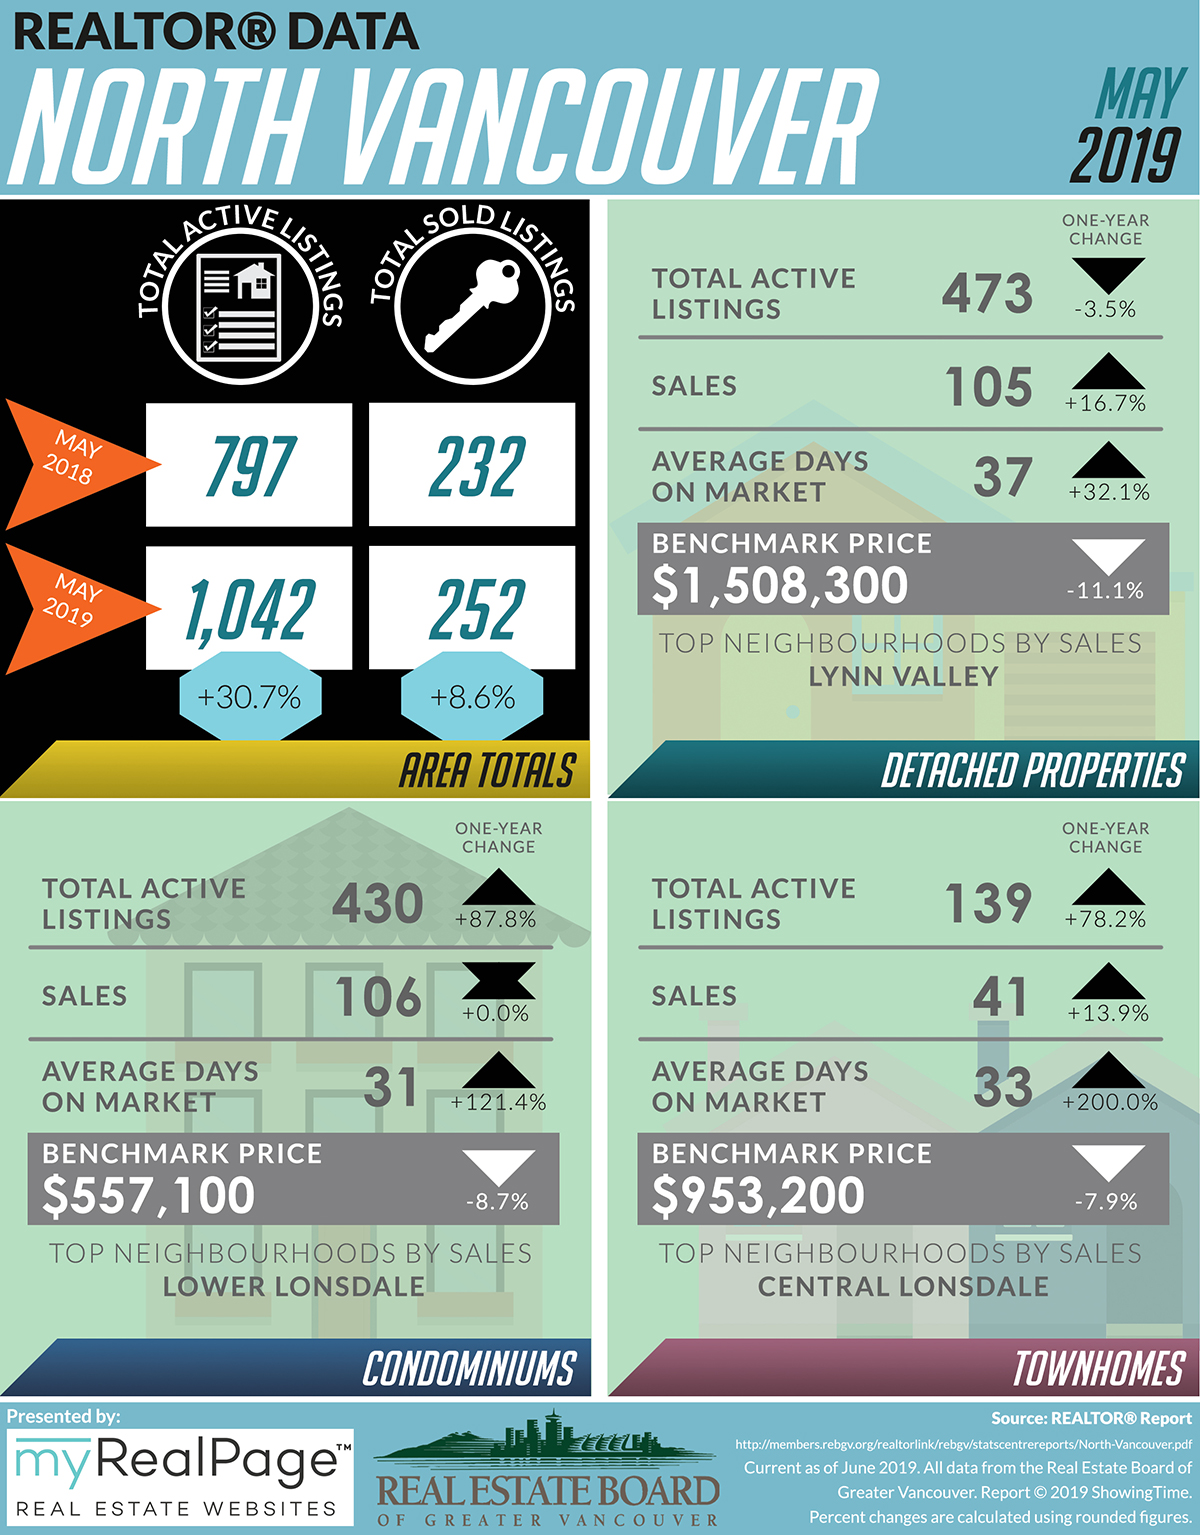
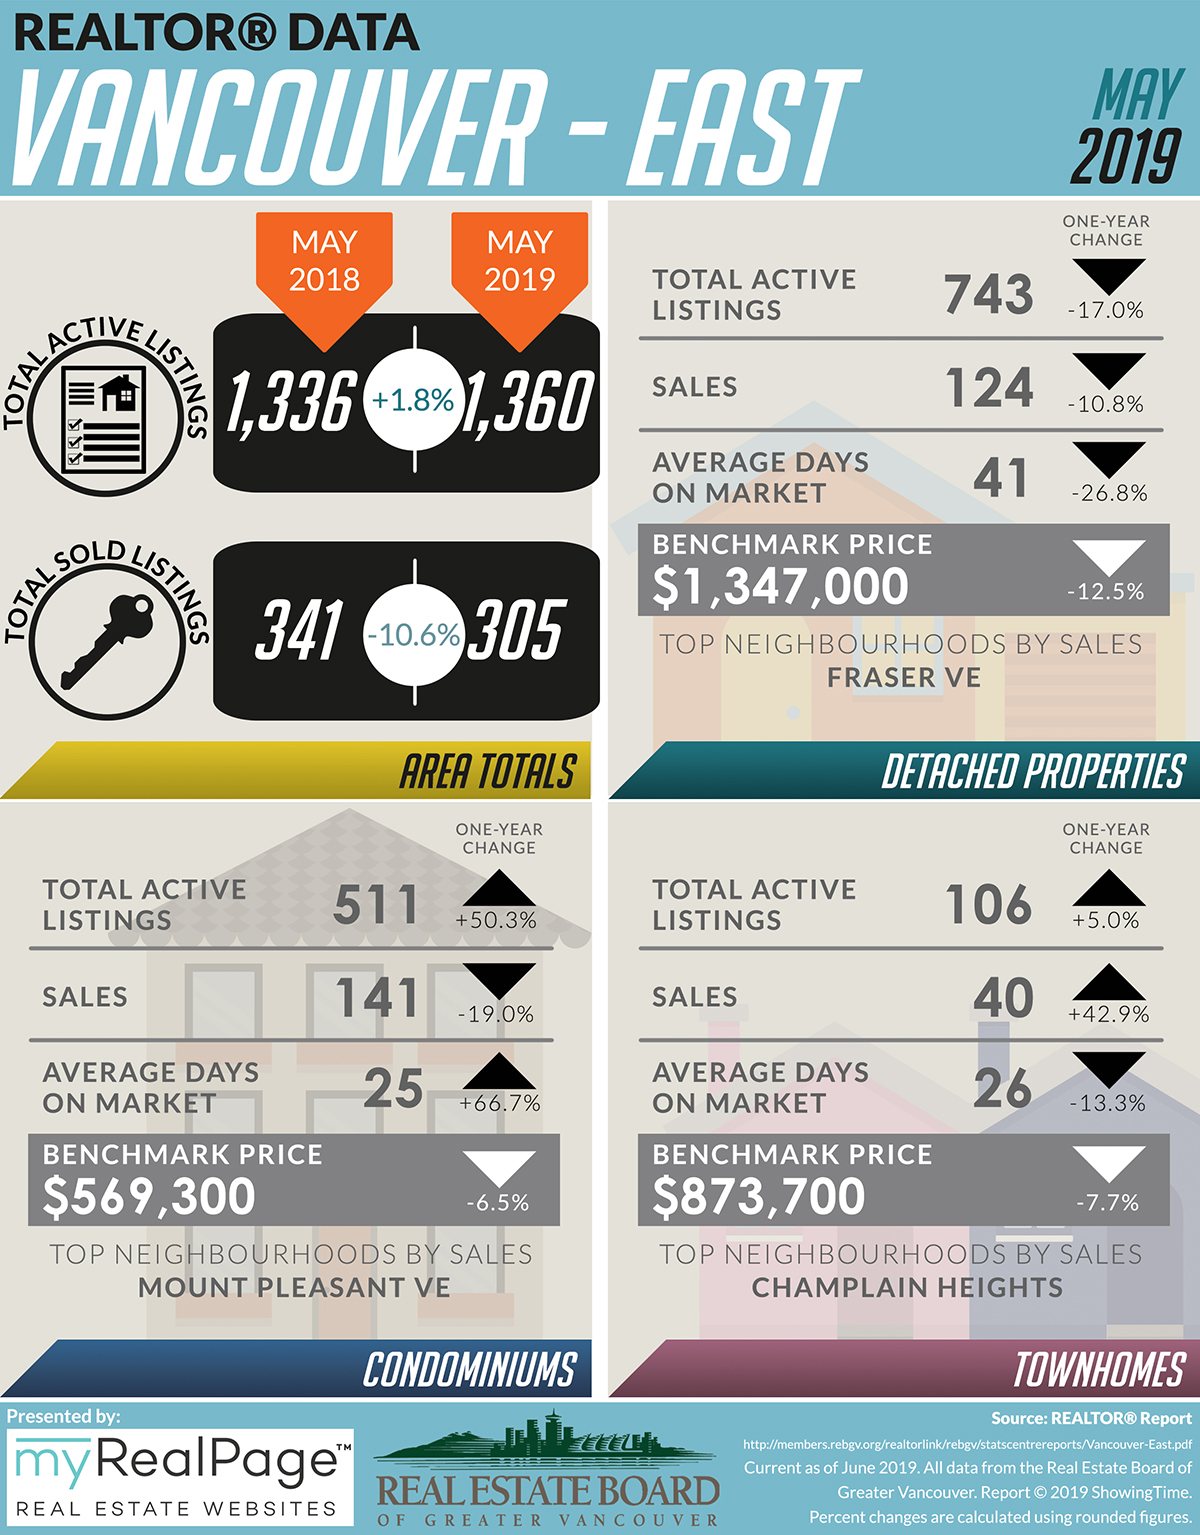
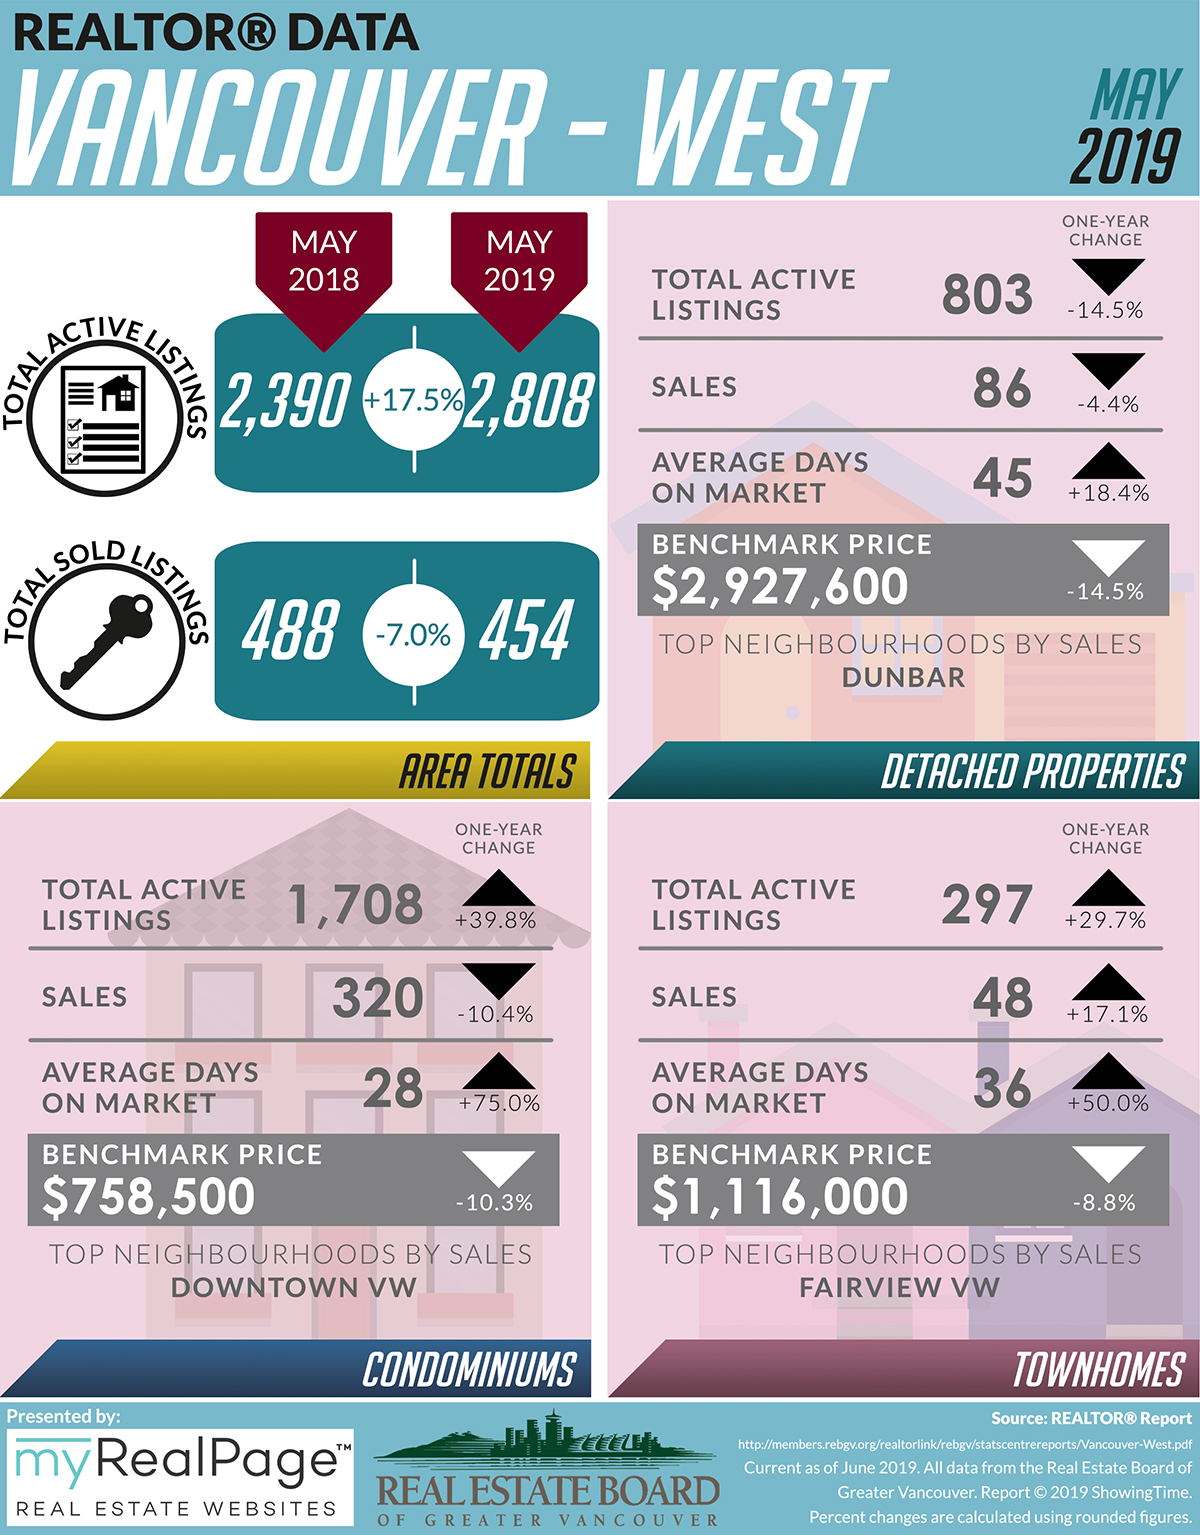
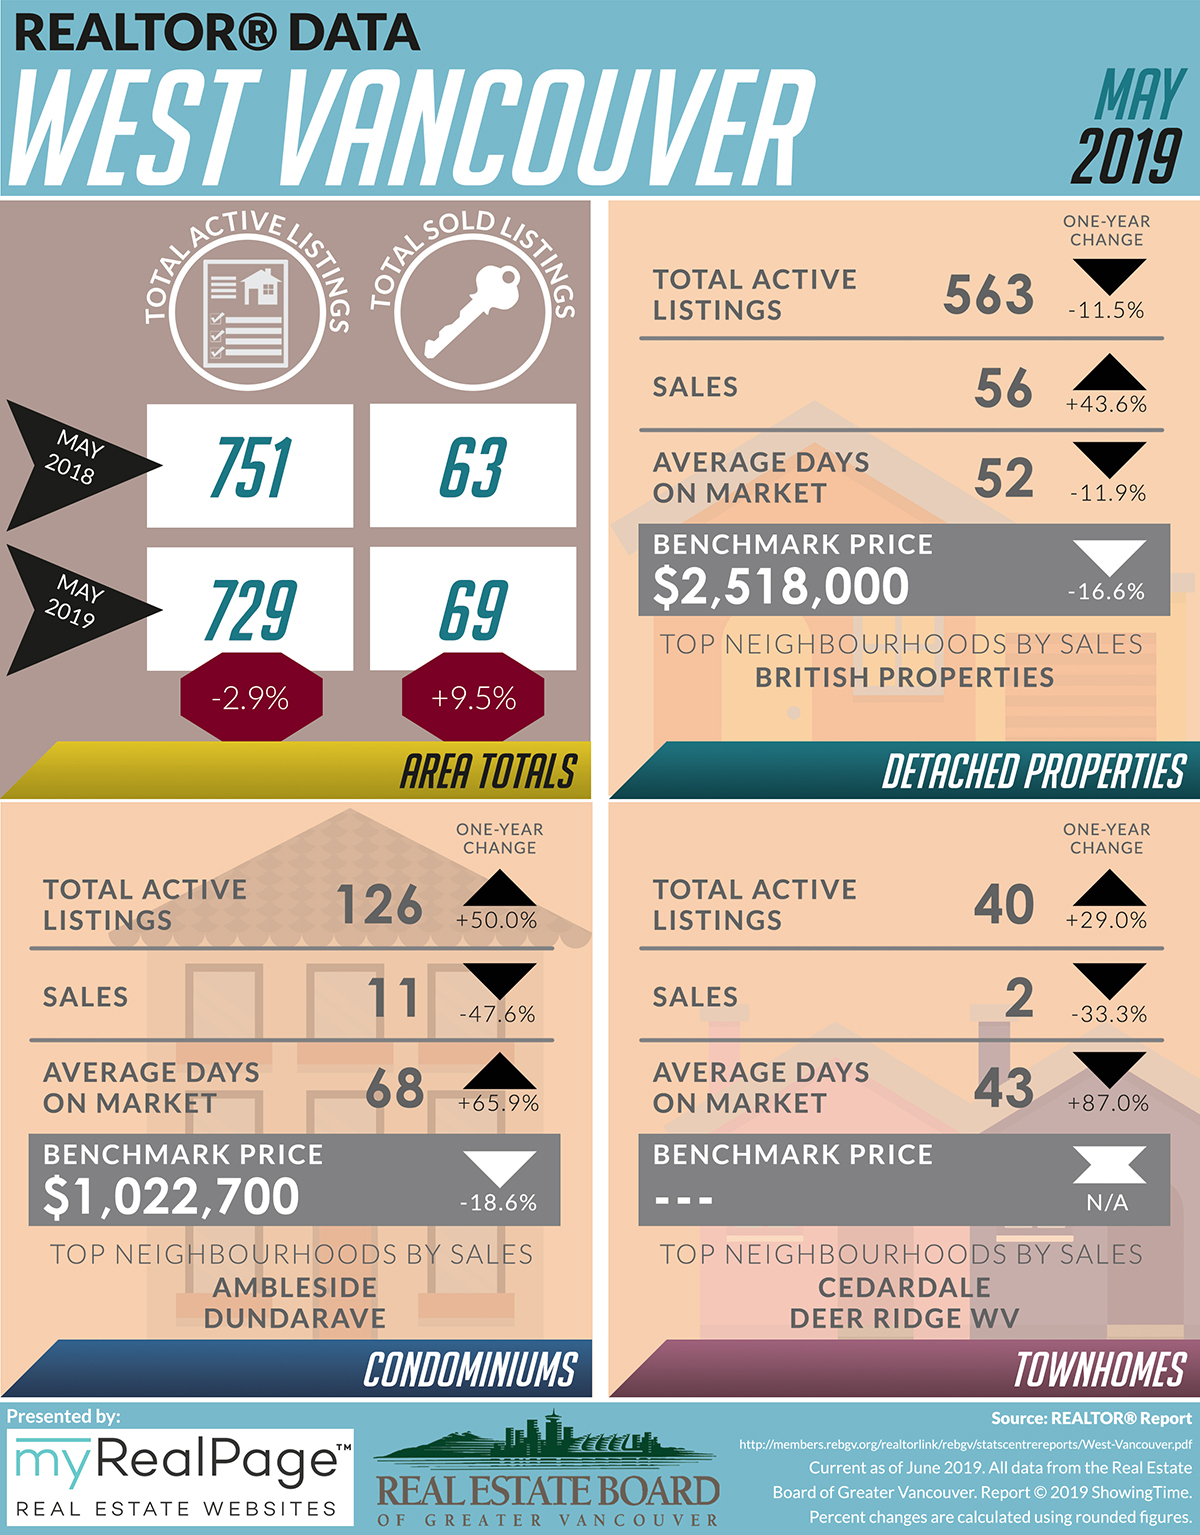
The following data is a comparison between May 2018 and May 2019 numbers, and is current as of June 2019. For last month’s update, you can check out our previous post for April 2019 data.
Or follow this link for all our REBGV Infographics!
These infographics cover current trends in North Vancouver, West Vancouver, Vancouver East, and Vancouver West.
Click on the images for a larger view!
(Protip: Make sure to grab the printable PDF versions, too! It fits best when printed on A4-sized sheets, AND we’ve added an area on the sheet where you can attach your business card! 🙂 )
Download Printable Version – REBGV May 2019 Data Infographics
(Image Source: REBGV.org)
(Image Source: REBGV Twitter)
Last Updated on July 25, 2022 by myRealPage
