INFOGRAPHICS: May 2022 FVREB Fraser Valley, South Surrey, Etc. Market Reports

Home prices soften as Fraser Valley housing market cools amid lower sales and higher inventory
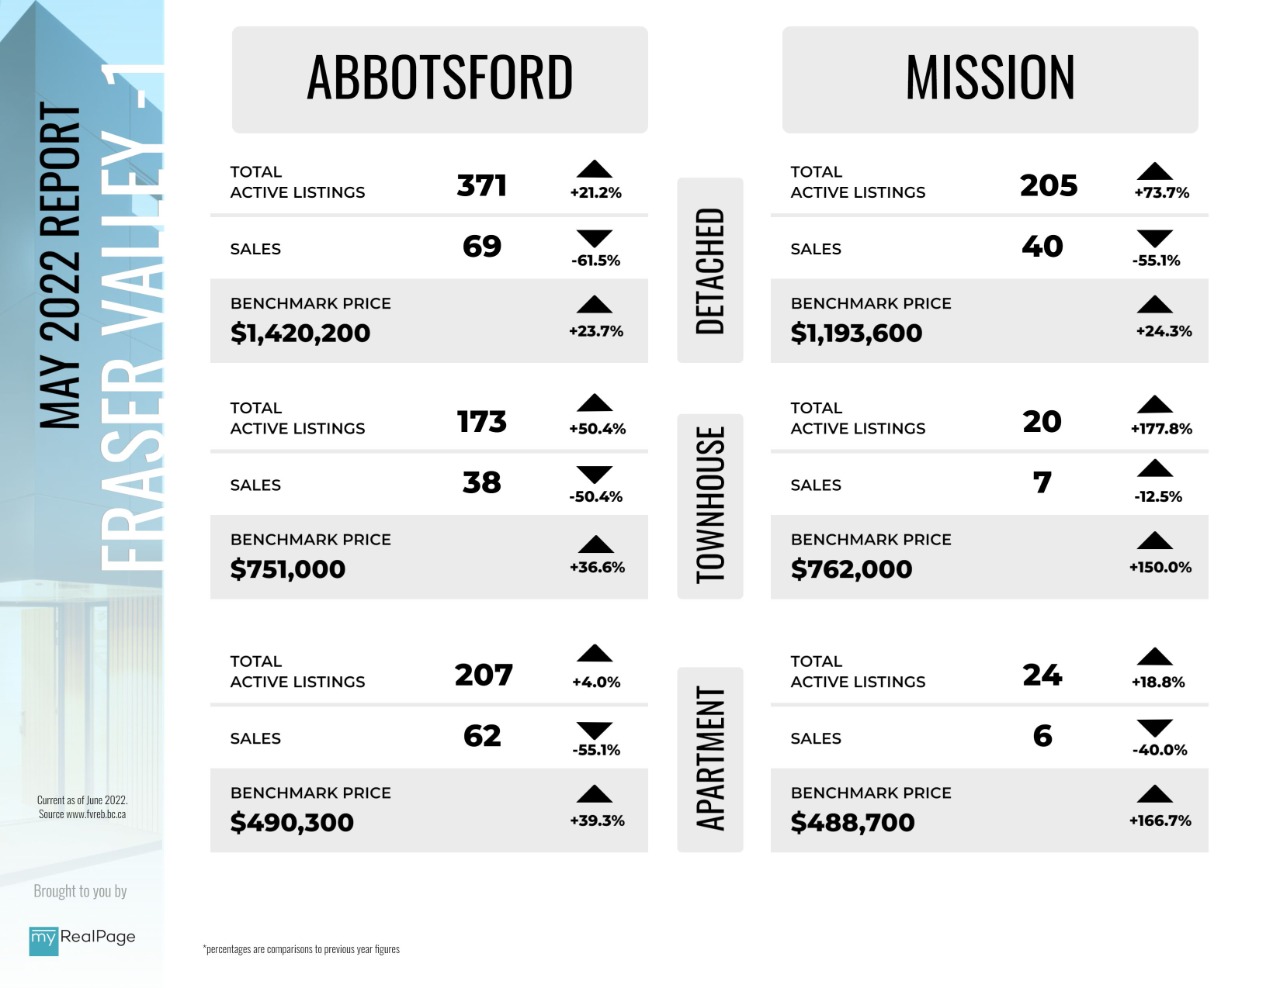
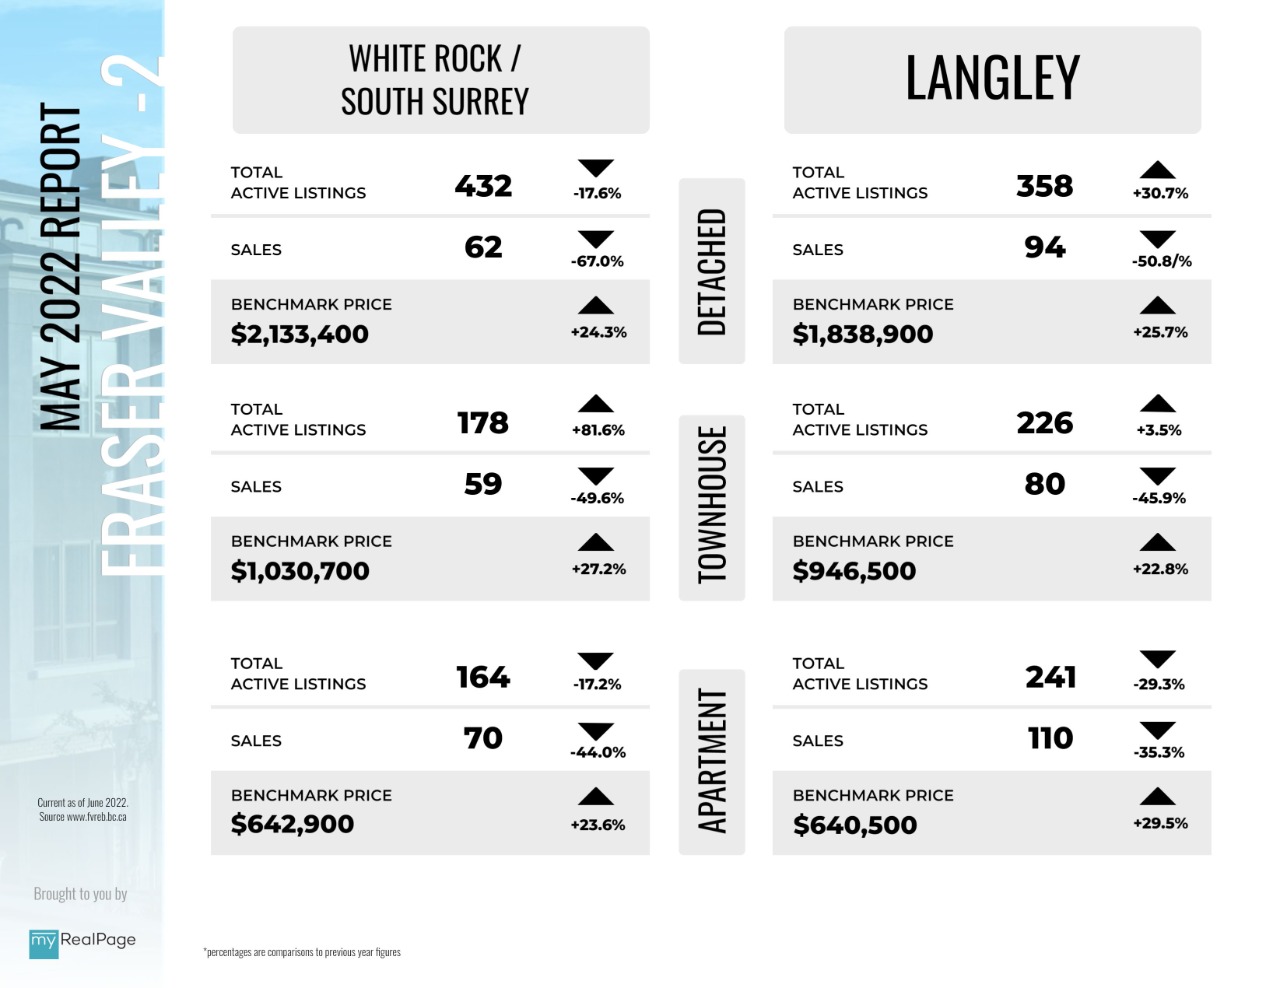
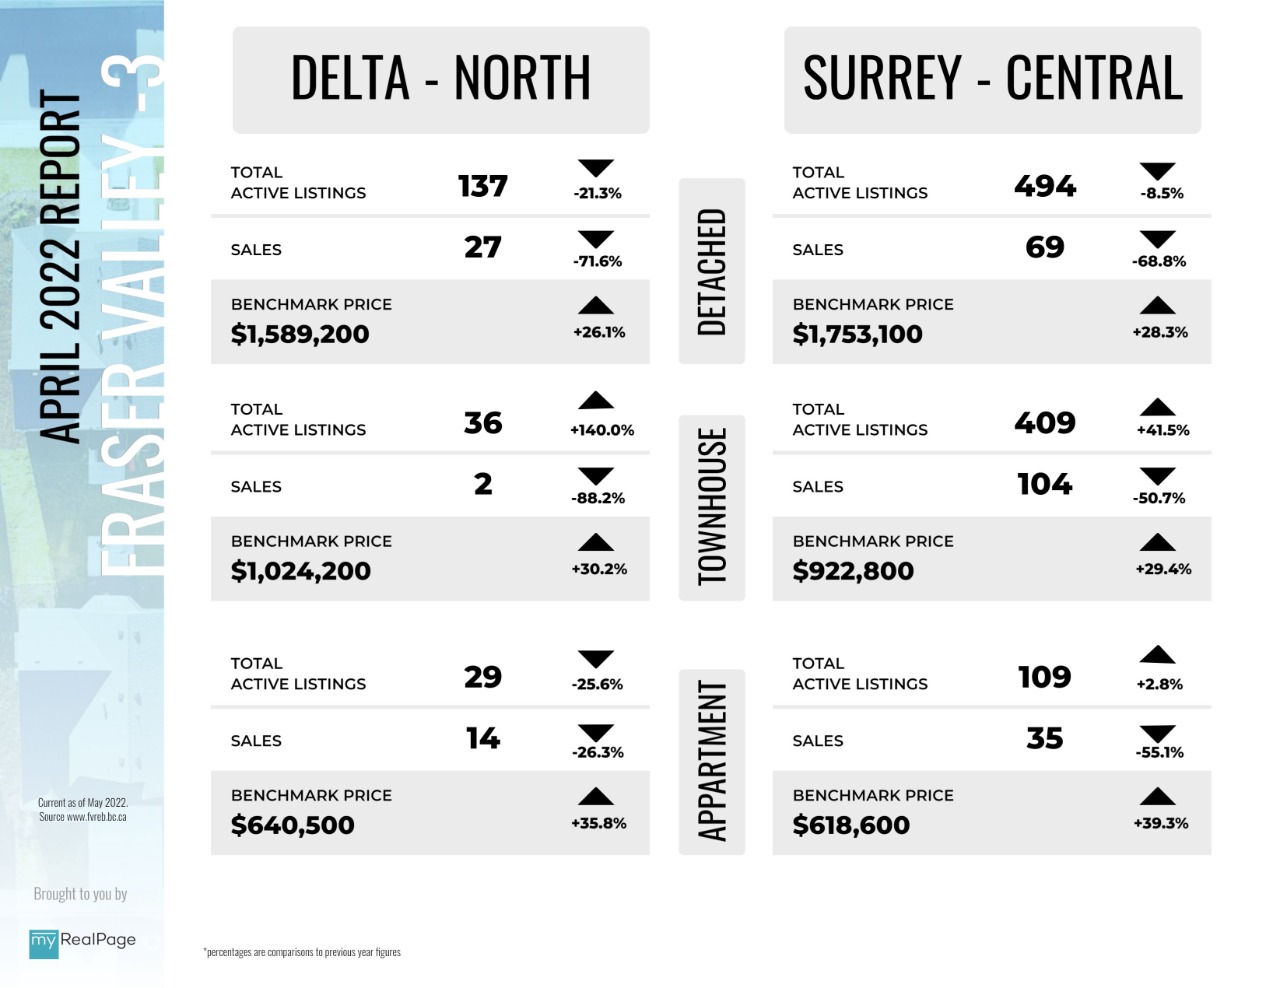
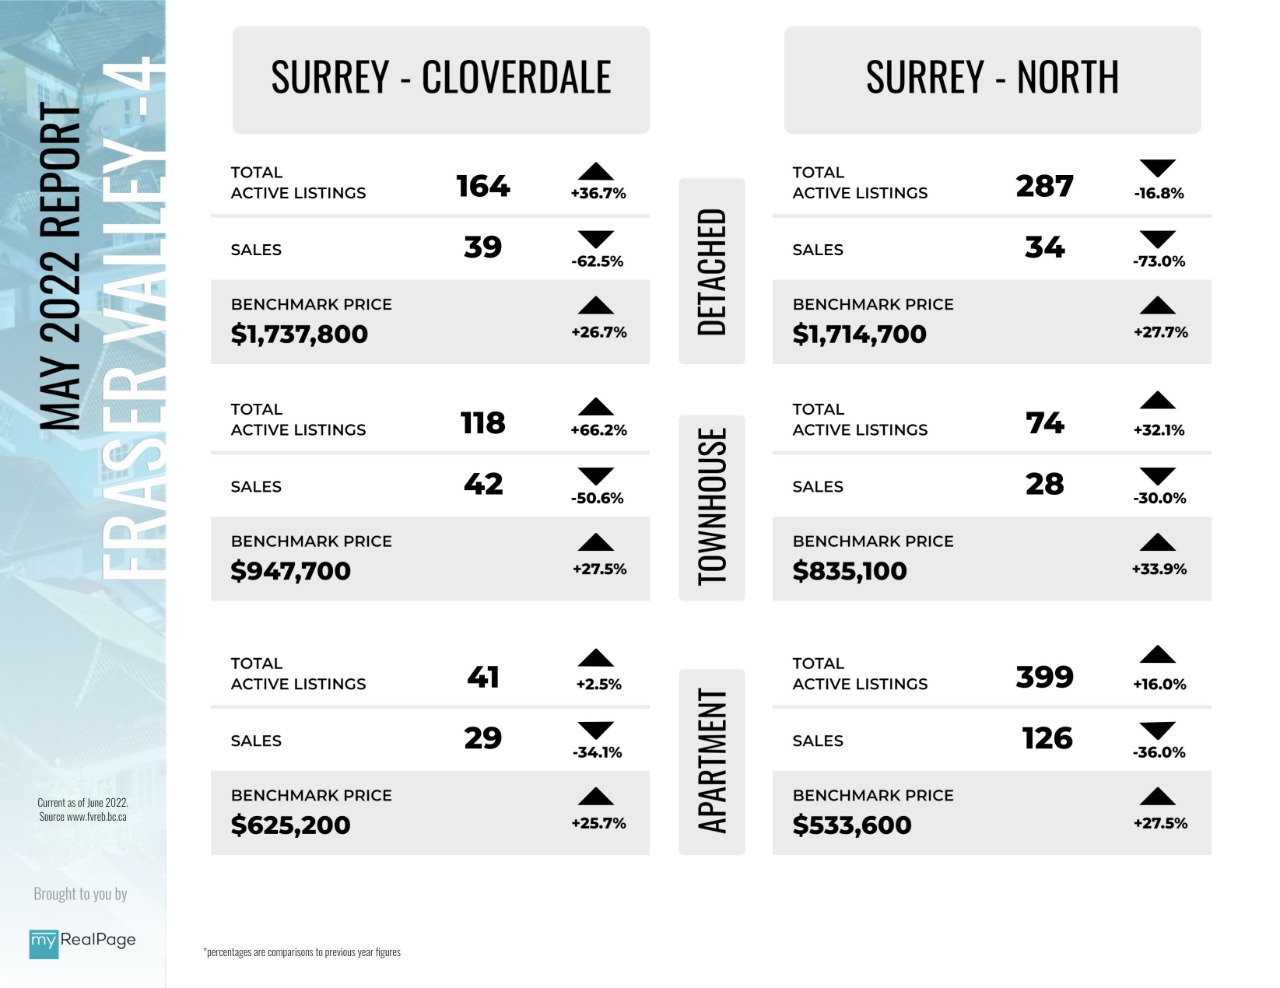
As property sales continue to fall in the Fraser Valley and active listings continue to grow, the region is edging towards more balanced levels not seen since the pre-pandemic period.
Sales of all property types in May were 1,360, down 16.9 per cent from April’s 1,637; and down 53.9 per cent compared to May of 2021.
At the same time, active listings (the number of properties available for sale at a given moment during the month, in this case at the end of May) have more than tripled since December 2021. At the end of May, actives sat at 6,183, up 5.4 per cent year-over-year, and an increase of 14.8 per cent compared to April 2022.
The sales-to-active-listings ratio measures whether the market is balanced (12% to 20%) or favours either buyers (less than 12%) or sellers (greater than 20%). In May, the ratio for Fraser Valley all property types combined was 22 per cent, comparable to pre-pandemic conditions in early 2020. By comparison, during the pandemic, the ratio peaked at 92 per cent, indicating a strong seller’s market.
Read the full report on the FVREB website!
The following data is a comparison between May 2022 and May 2021 numbers, and is current as of June 2022. For last month’s report, check out our previous infographic!
Or follow this link for all our FVREB Infographics!
These infographics cover current trends in Fraser Valley neighbourhoods that are within the FVREB. Click on the images for a larger view!
Download Printable Version – FVREB May 2022 Market Report 1
Download Printable Version – FVREB May 2022 Market Report 2
Download Printable Version – FVREB May 2022 Market Report 3
Download Printable Version – FVREB May 2022 Market Report 4
Last Updated on July 25, 2022 by myRealPage
