INFOGRAPHICS: October 2018 FVREB Fraser Valley, South Surrey, Etc. Market Reports

After sales have reportedly hit their lowest point last September, the Fraser Valley Real Estate Board (FVREB) has announced on their latest press release that they are seeing a slight improvement to overall home sales within the FVREB.
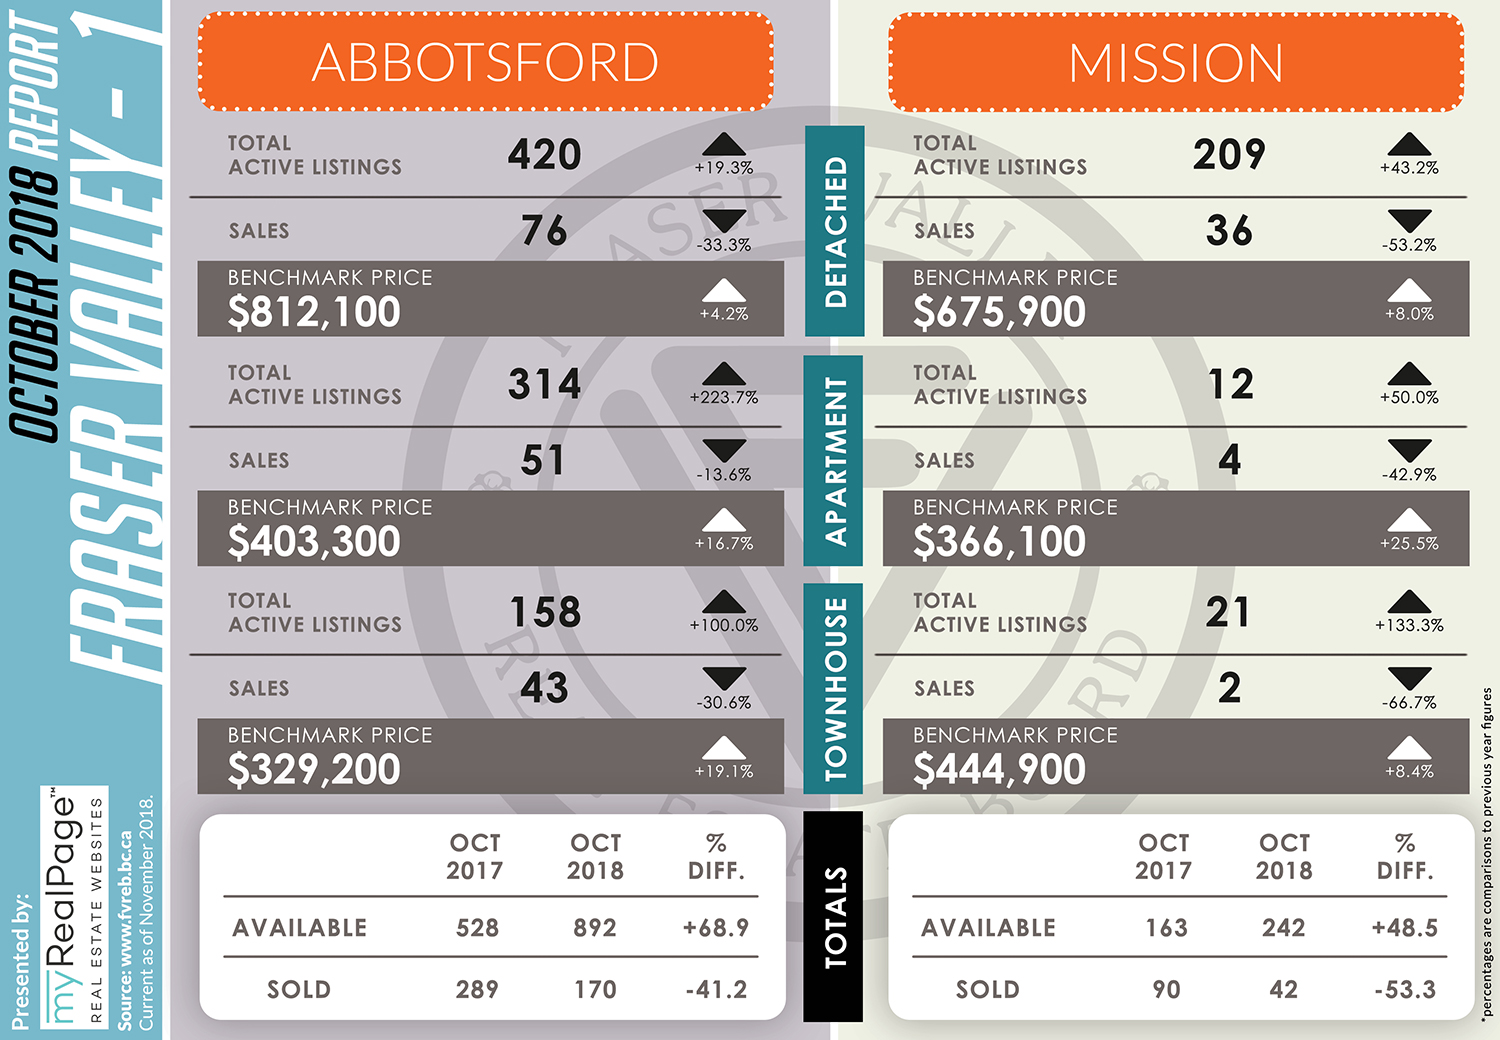
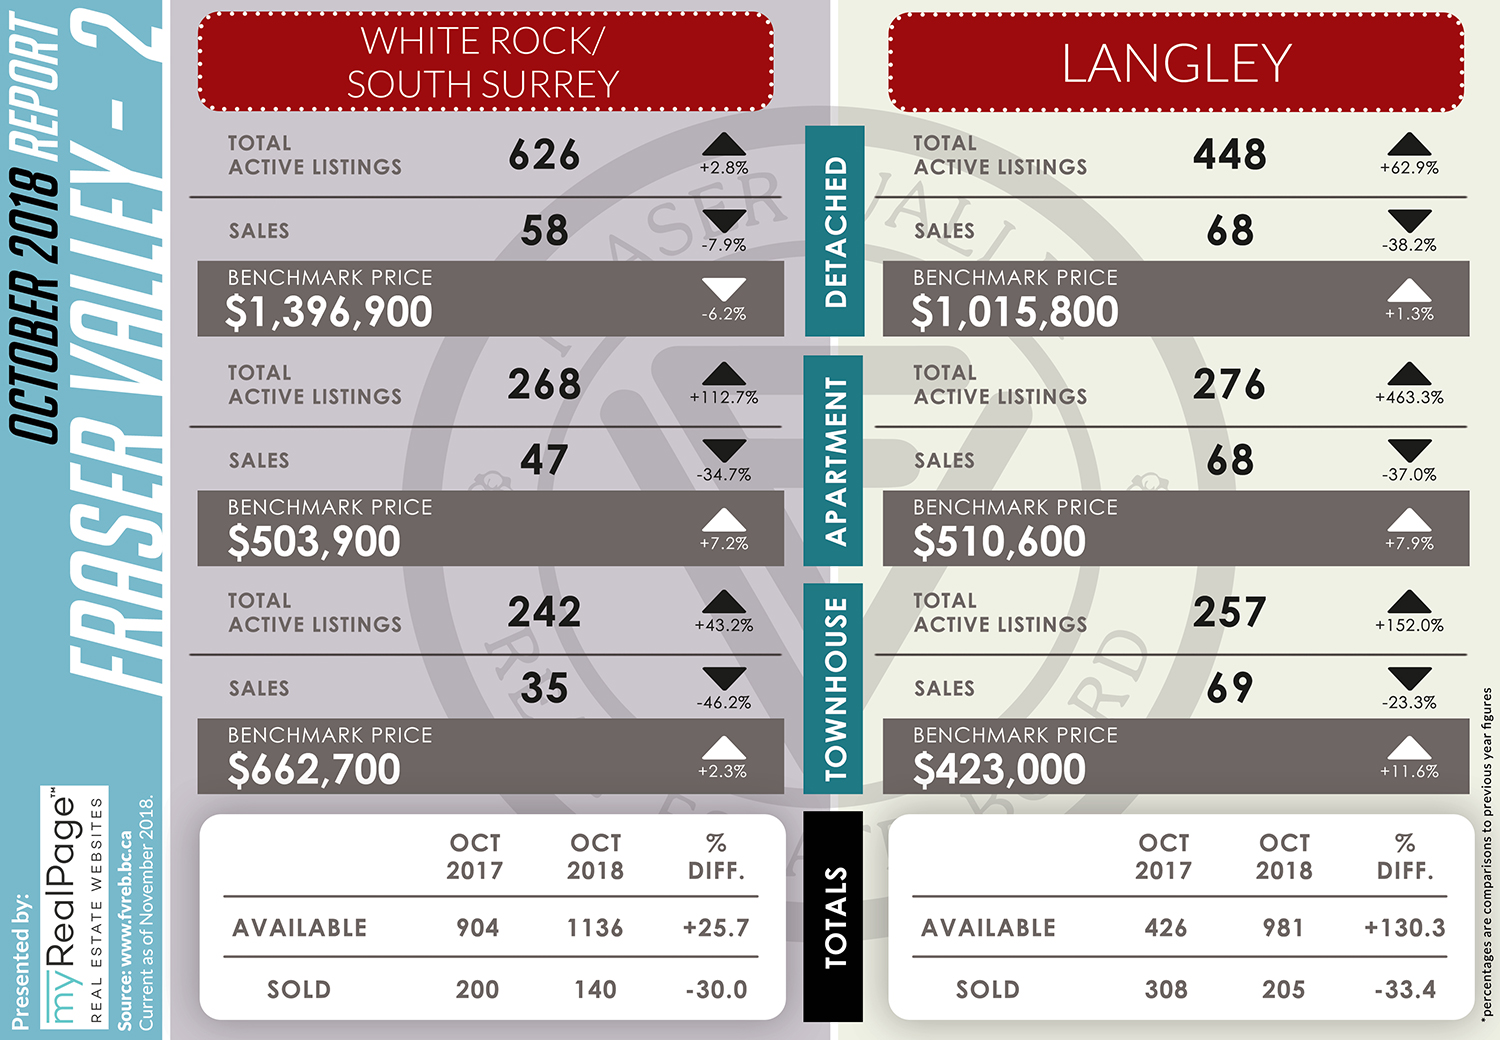
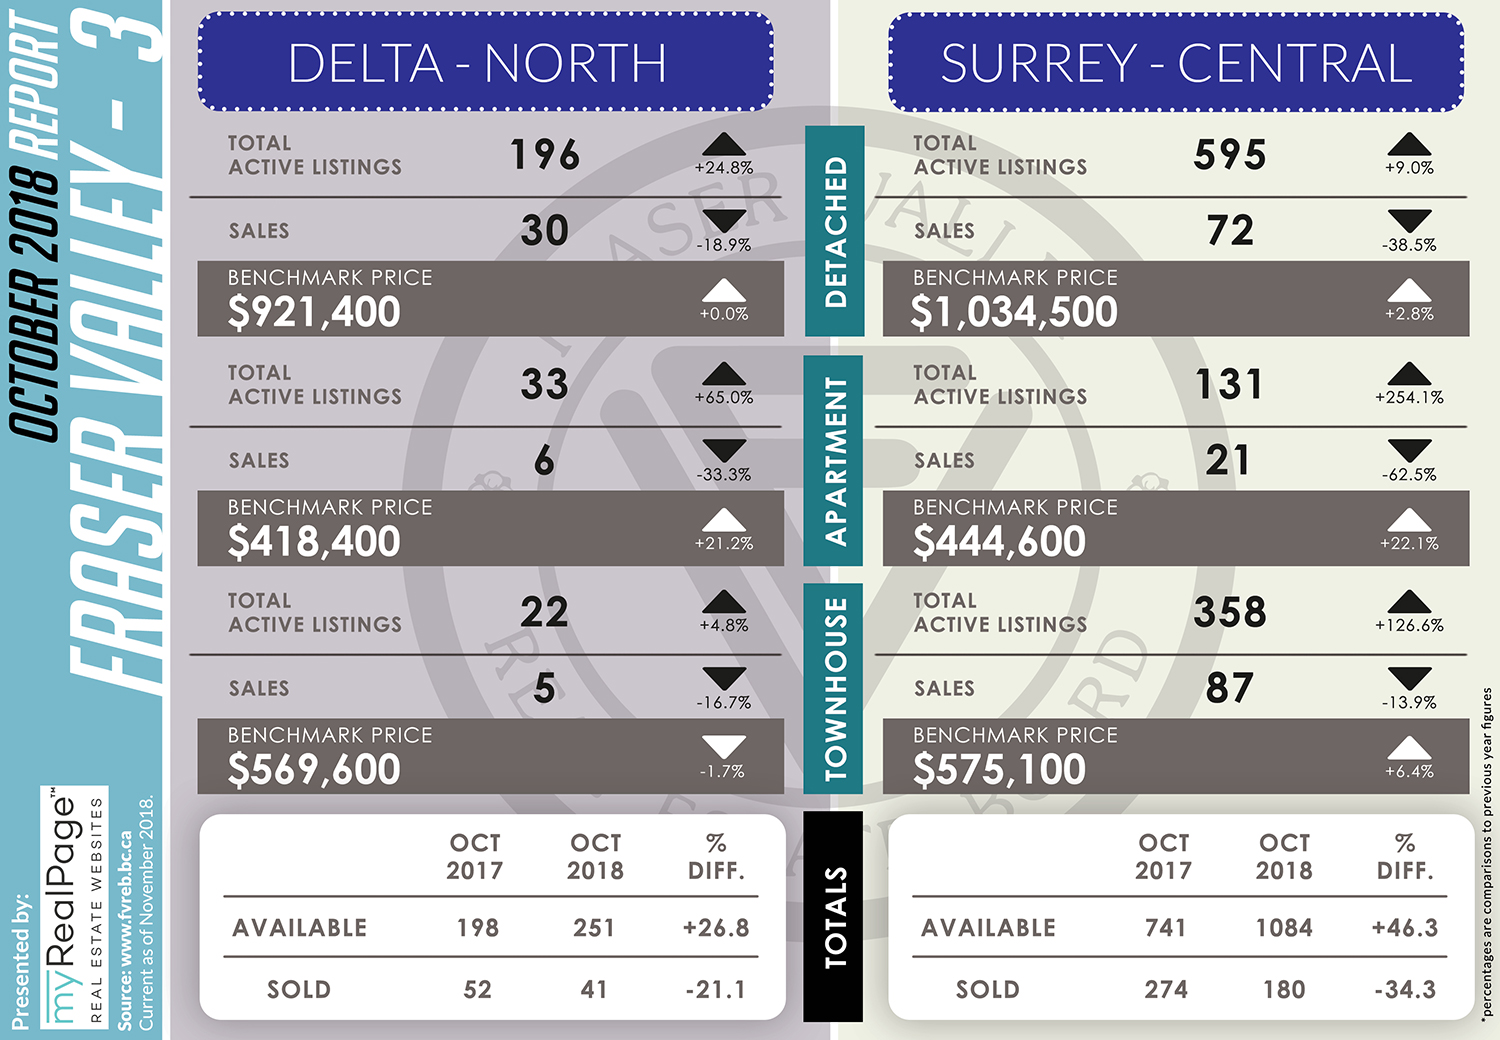
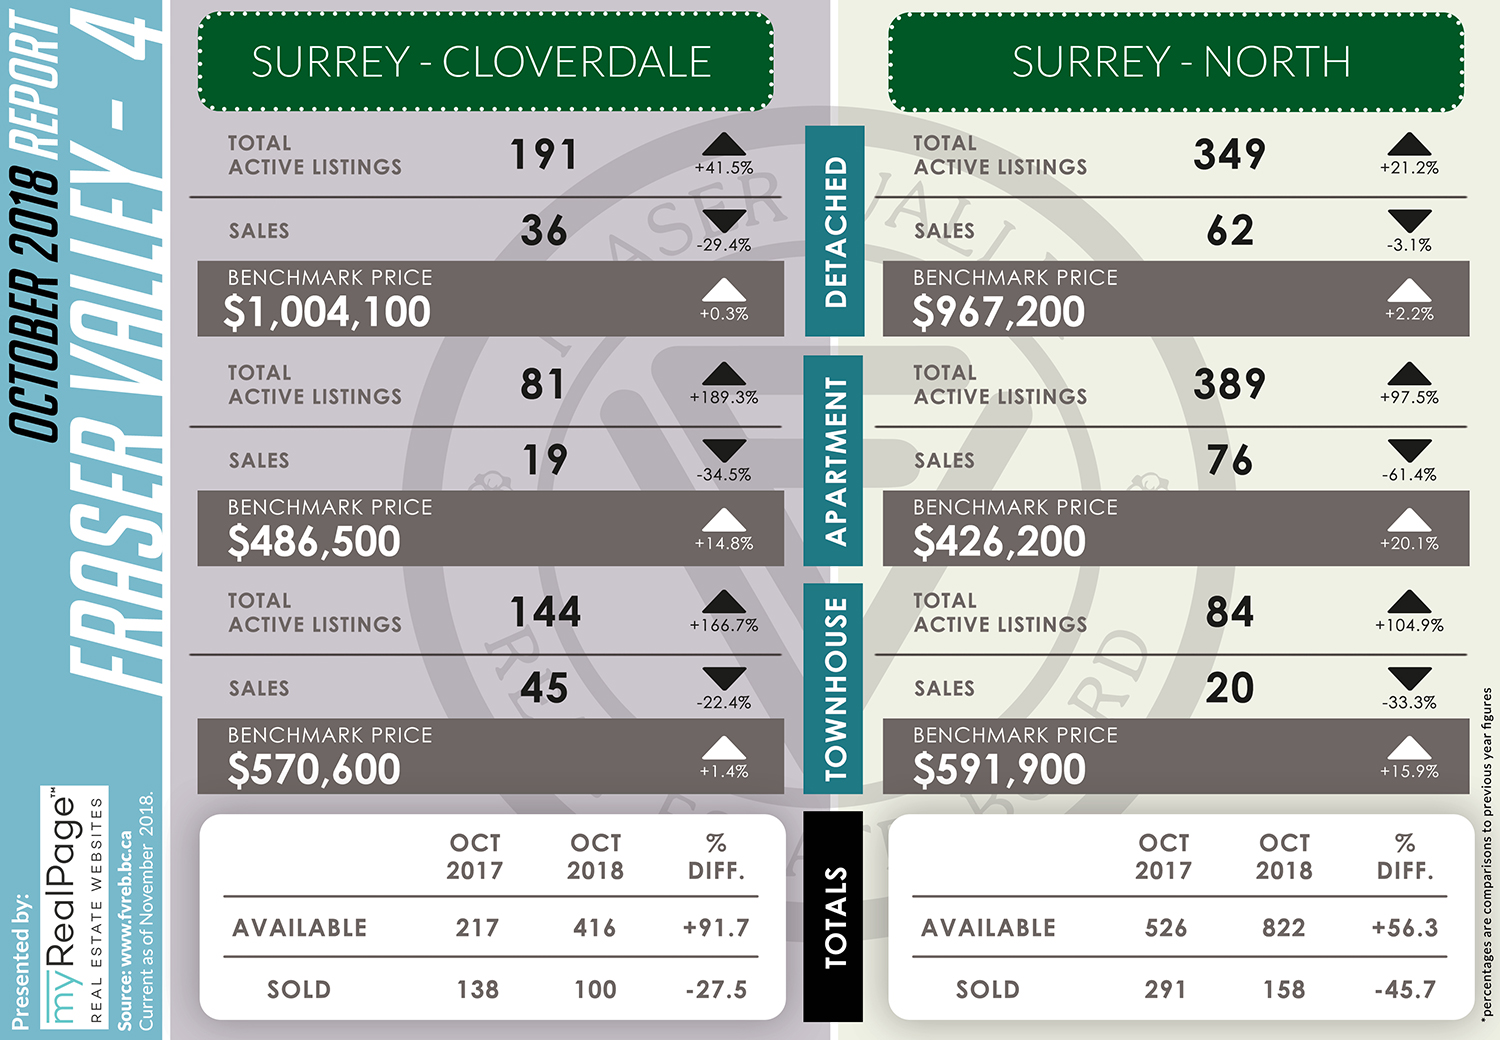
Of the 1,155 sales, 438 were residential detached homes, 306 were townhouses, and 292 were apartments.
According to Board President John Barbisan,
“While slight, this is the first time since May that sales here have been on the upswing. We’re beneath typical activity levels for this time of year but it’s good to see that buyers and sellers are still finding success this season. We’re in a much better spot in terms of overall inventory compared to this time last year, and now closer to a more balanced market. Attached inventory in particular has seen notable gains, doubling year-over-year for townhouses and nearly tripling for apartments.”
The following data is a comparison between October 2017 and October 2018 numbers, and is current as of November 2018. For last month’s report, check out our previous infographic!
Or follow this link for all our FVREB Infographics!
These infographics cover current trends in Fraser Valley neighbourhoods that are within the FVREB.
Click on the images for a larger view!
(Protip: Make sure to grab the printable PDF version, too! It fits best when printed on A4-sized sheets, AND we’ve added an area on the sheet where you can attach your business card! 🙂 )
Download Printable Version – FVREB October 2018 Market Report
Last Updated on July 25, 2022 by myRealPage
