INFOGRAPHICS: September 2018 FVREB Fraser Valley, South Surrey, Etc. Market Reports

For those keeping tabs on market trends within areas covered by the Fraser Valley Real Estate Board (FVREB), here are the latest updates!
From the looks of it, the FVREB is continuing to experience slowness with sales. Housing supplies remain high, as buyers have remained hesitant throughout the month of September.
According to their most recent press release, the FVREB experienced a 36.1% decrease in September sales, processing only 1,035 transactions across all property types. This is in comparison with the 1,619 transactions that were processed in September 2017.
Meanwhile housing supply is at its highest since July 2015, with 7,647 listings.
FVREB Board President John Barbisan notes,
“Buyers remain reluctant as the market continues to adjust. We’re seeing good things happening in terms of inventory, but it only opens the door so much while prices are moving at a much slower rate.”
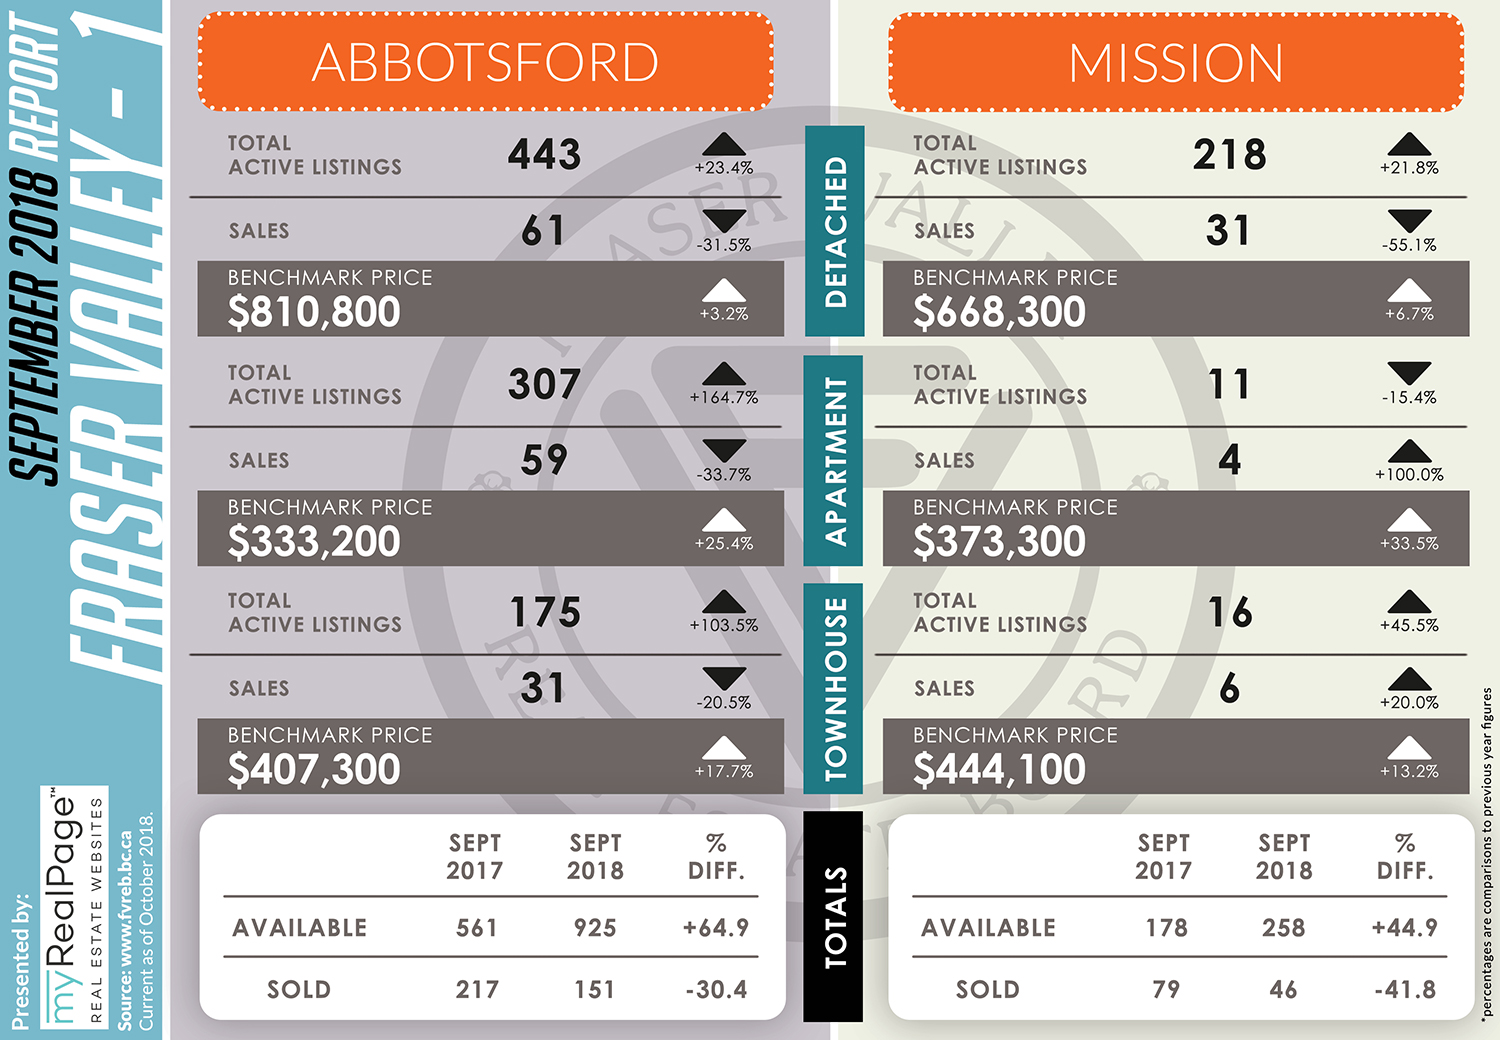
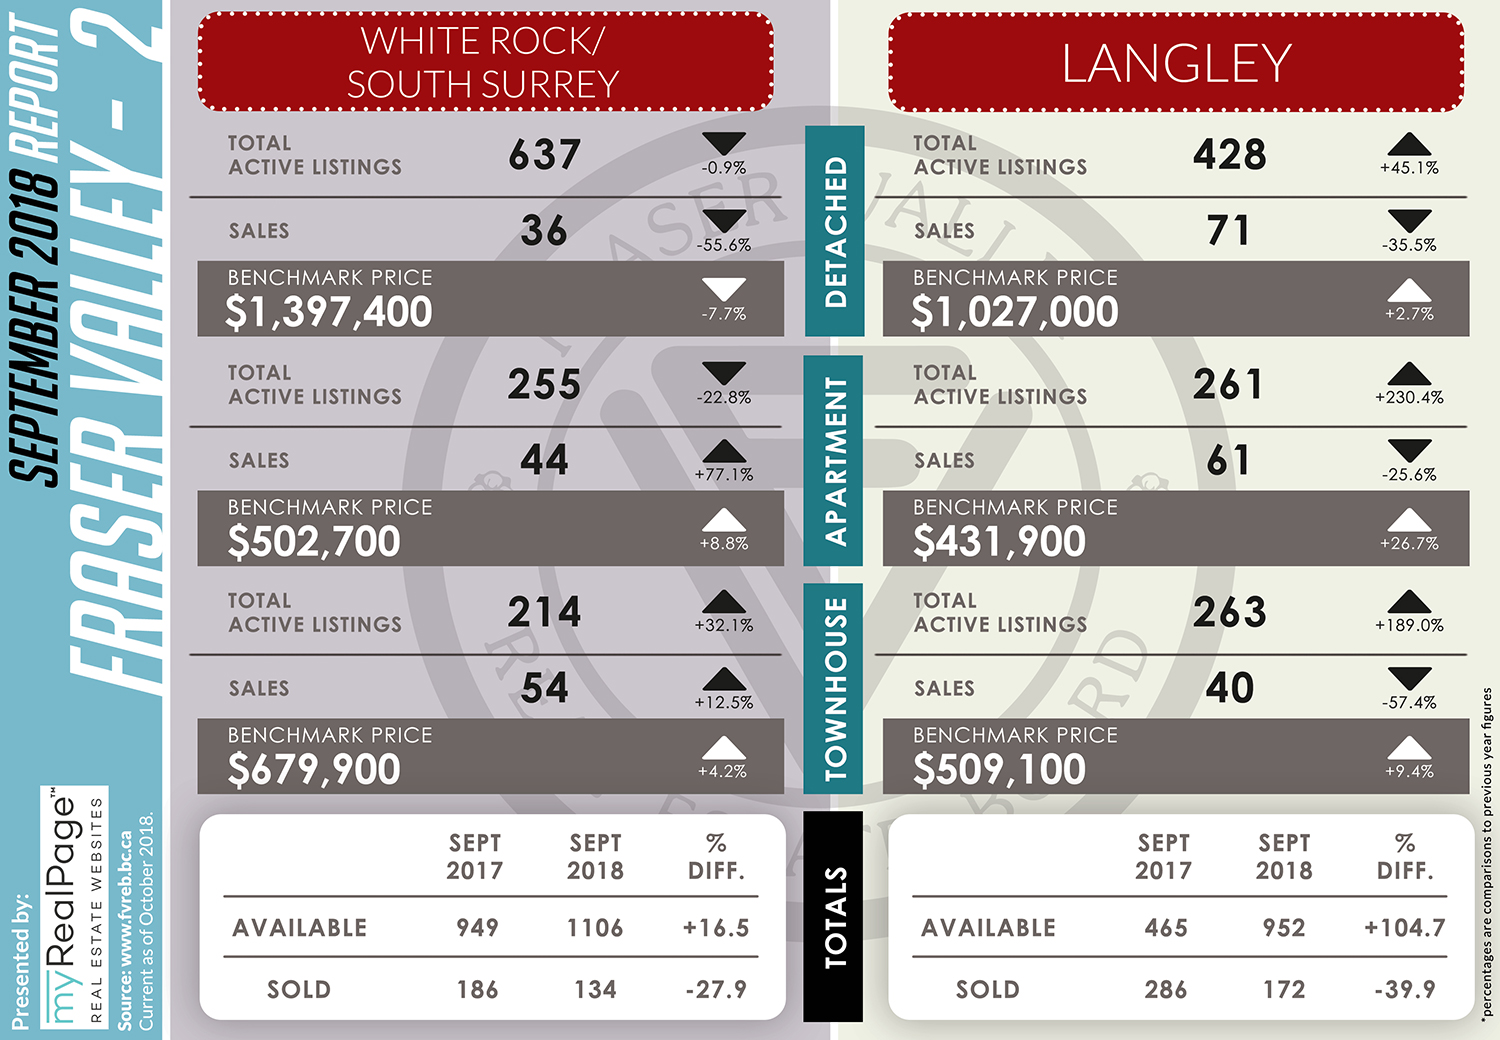
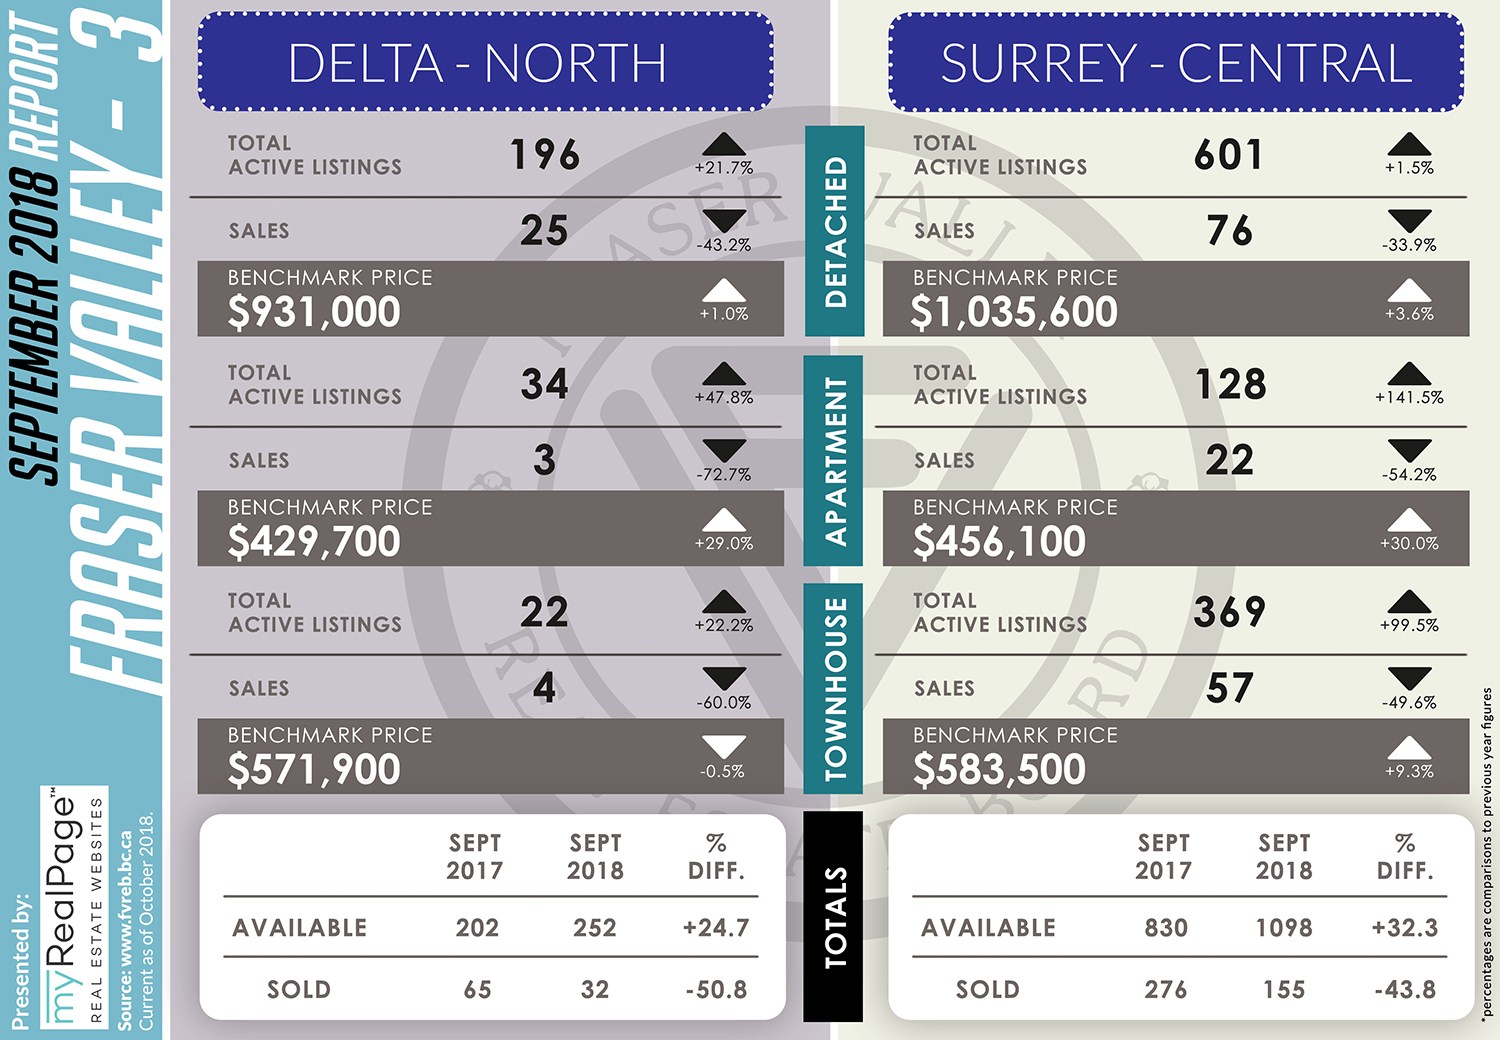
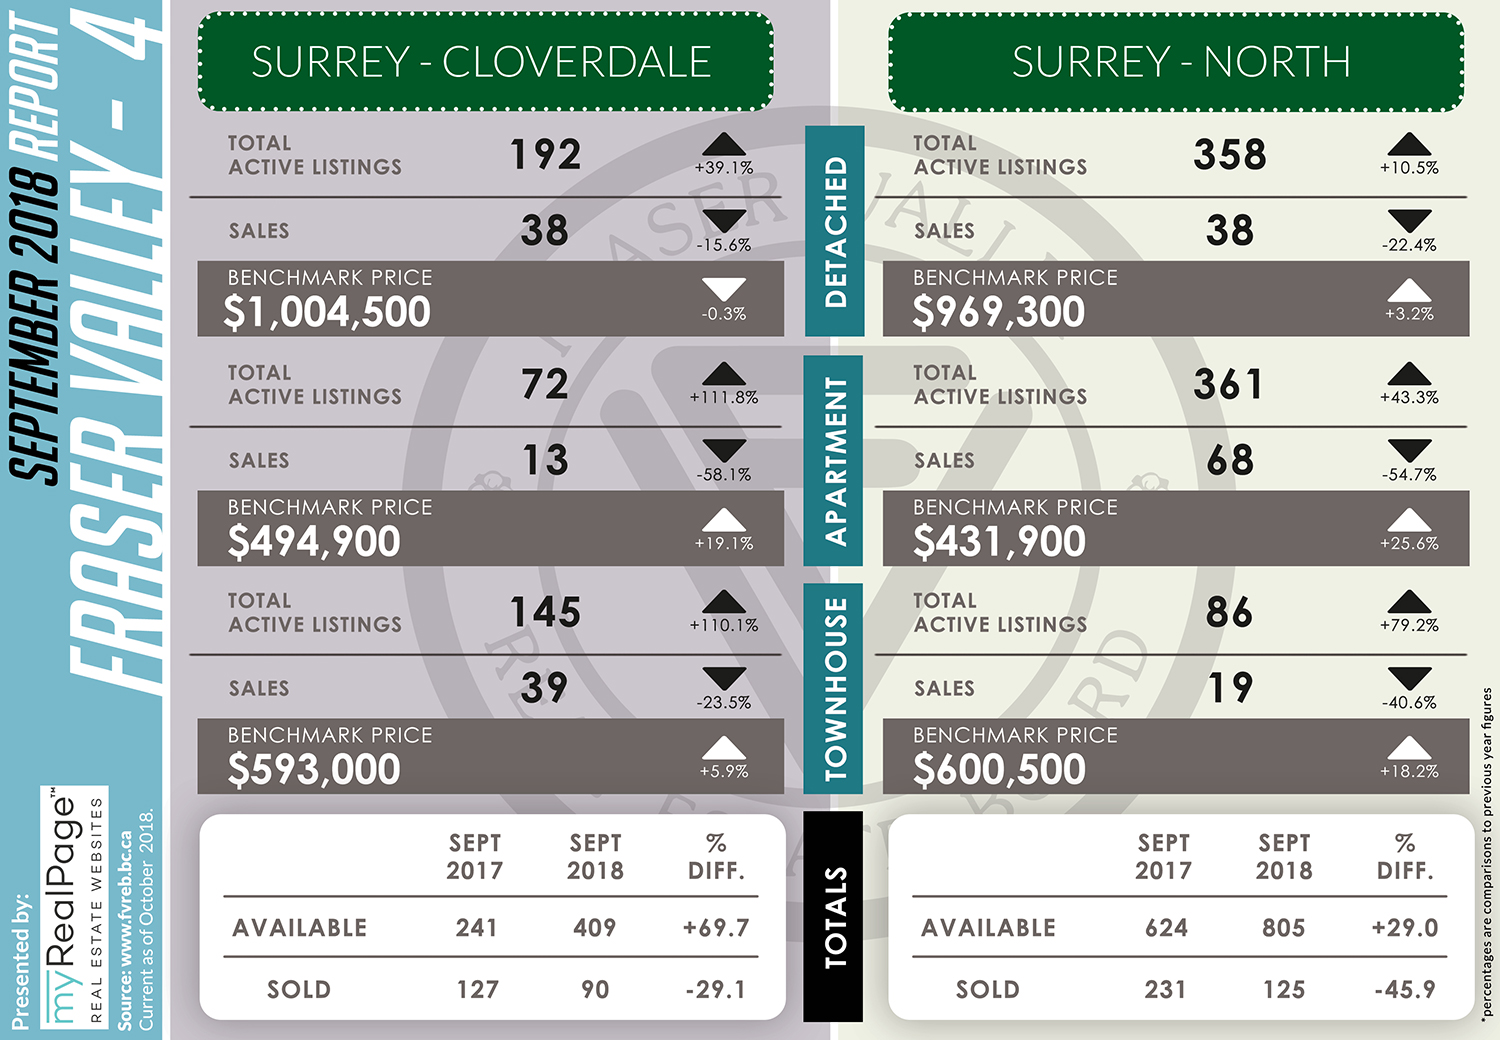
The following data is a comparison between September 2017 and September 2018 numbers, and is current as of October 2018. For last month’s report, check out our previous infographic! Or follow this link for all our FVREB Infographics!
These infographics cover current trends in Fraser Valley neighbourhoods that are within the FVREB.
Click on the images for a larger view!
(Protip: Make sure to grab the printable PDF version, too! It fits best when printed on A4-sized sheets, AND we’ve added an area on the sheet where you can attach your business card! 🙂 )
Download Printable Version – FVREB September 2018 Market Report
Last Updated on July 25, 2022 by myRealPage
