INFOGRAPHICS: October 2020 TRREB Toronto Market Reports

Home sales in the Greater Toronto Area (GTA) were up again year-over-year for the fourth month in a row.
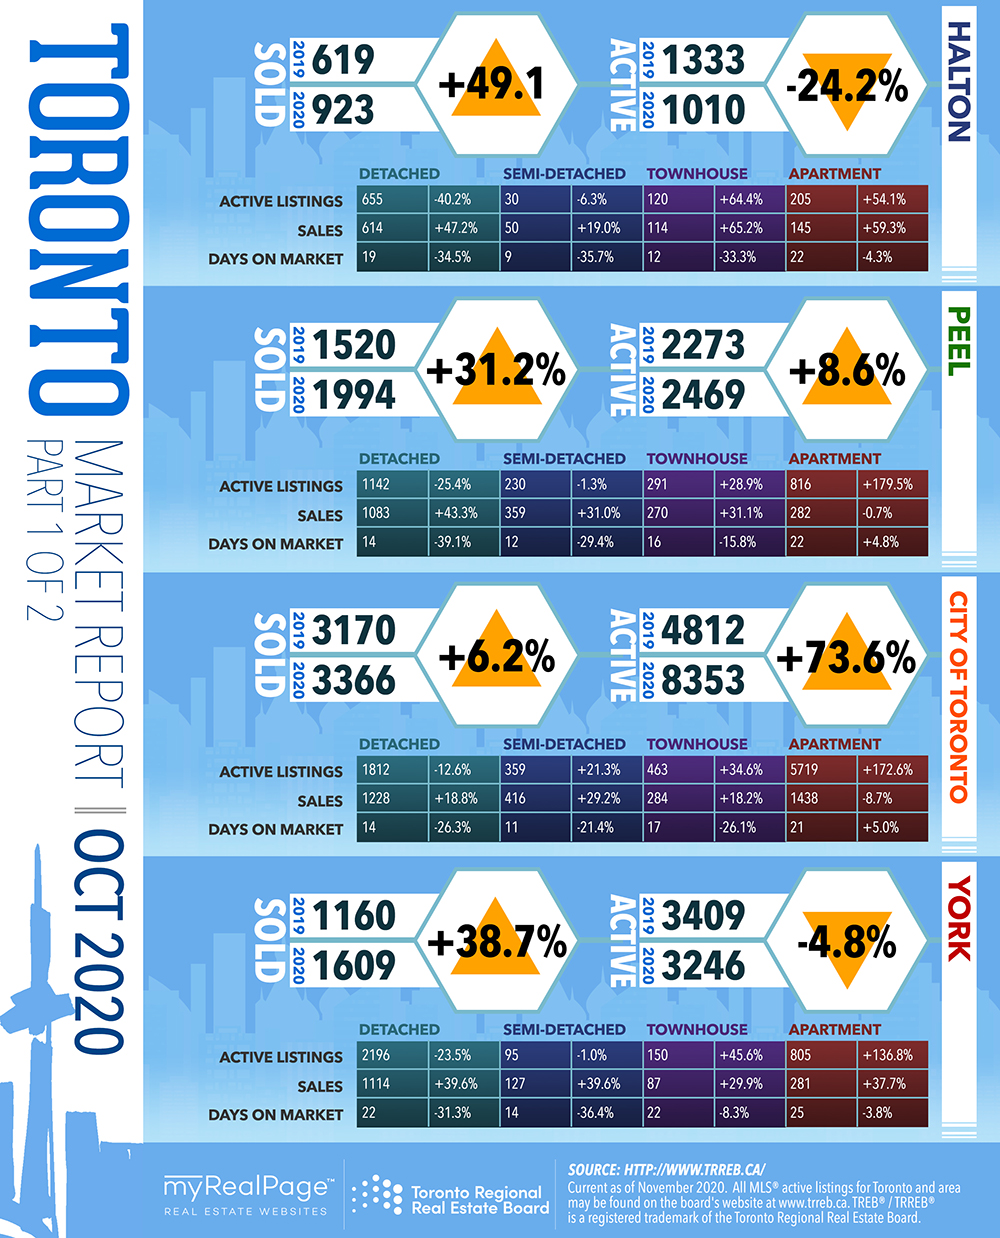
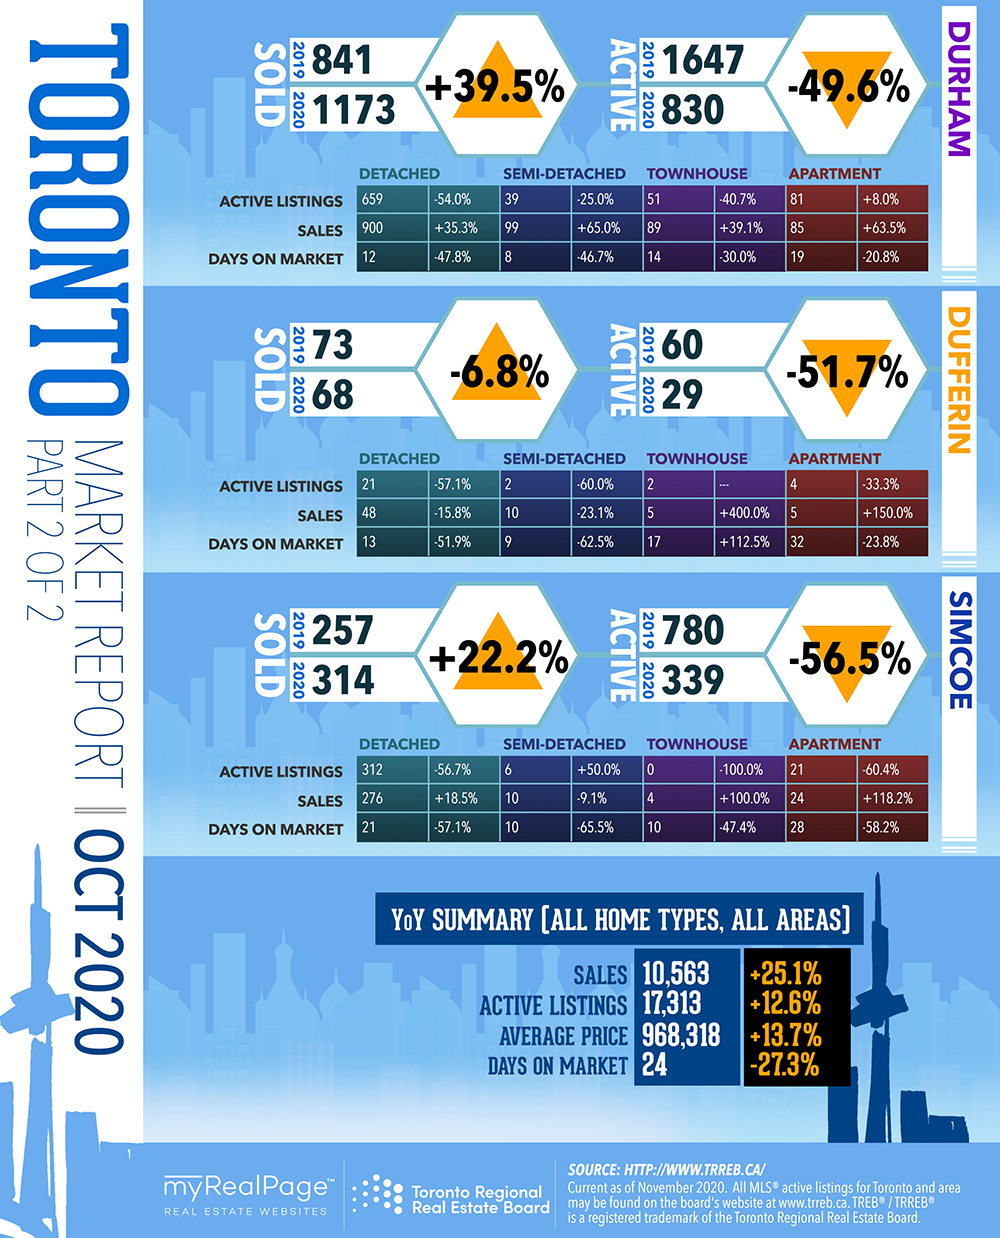
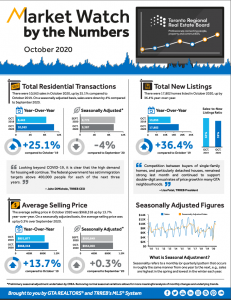
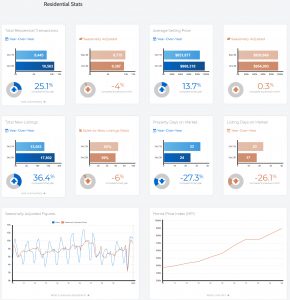
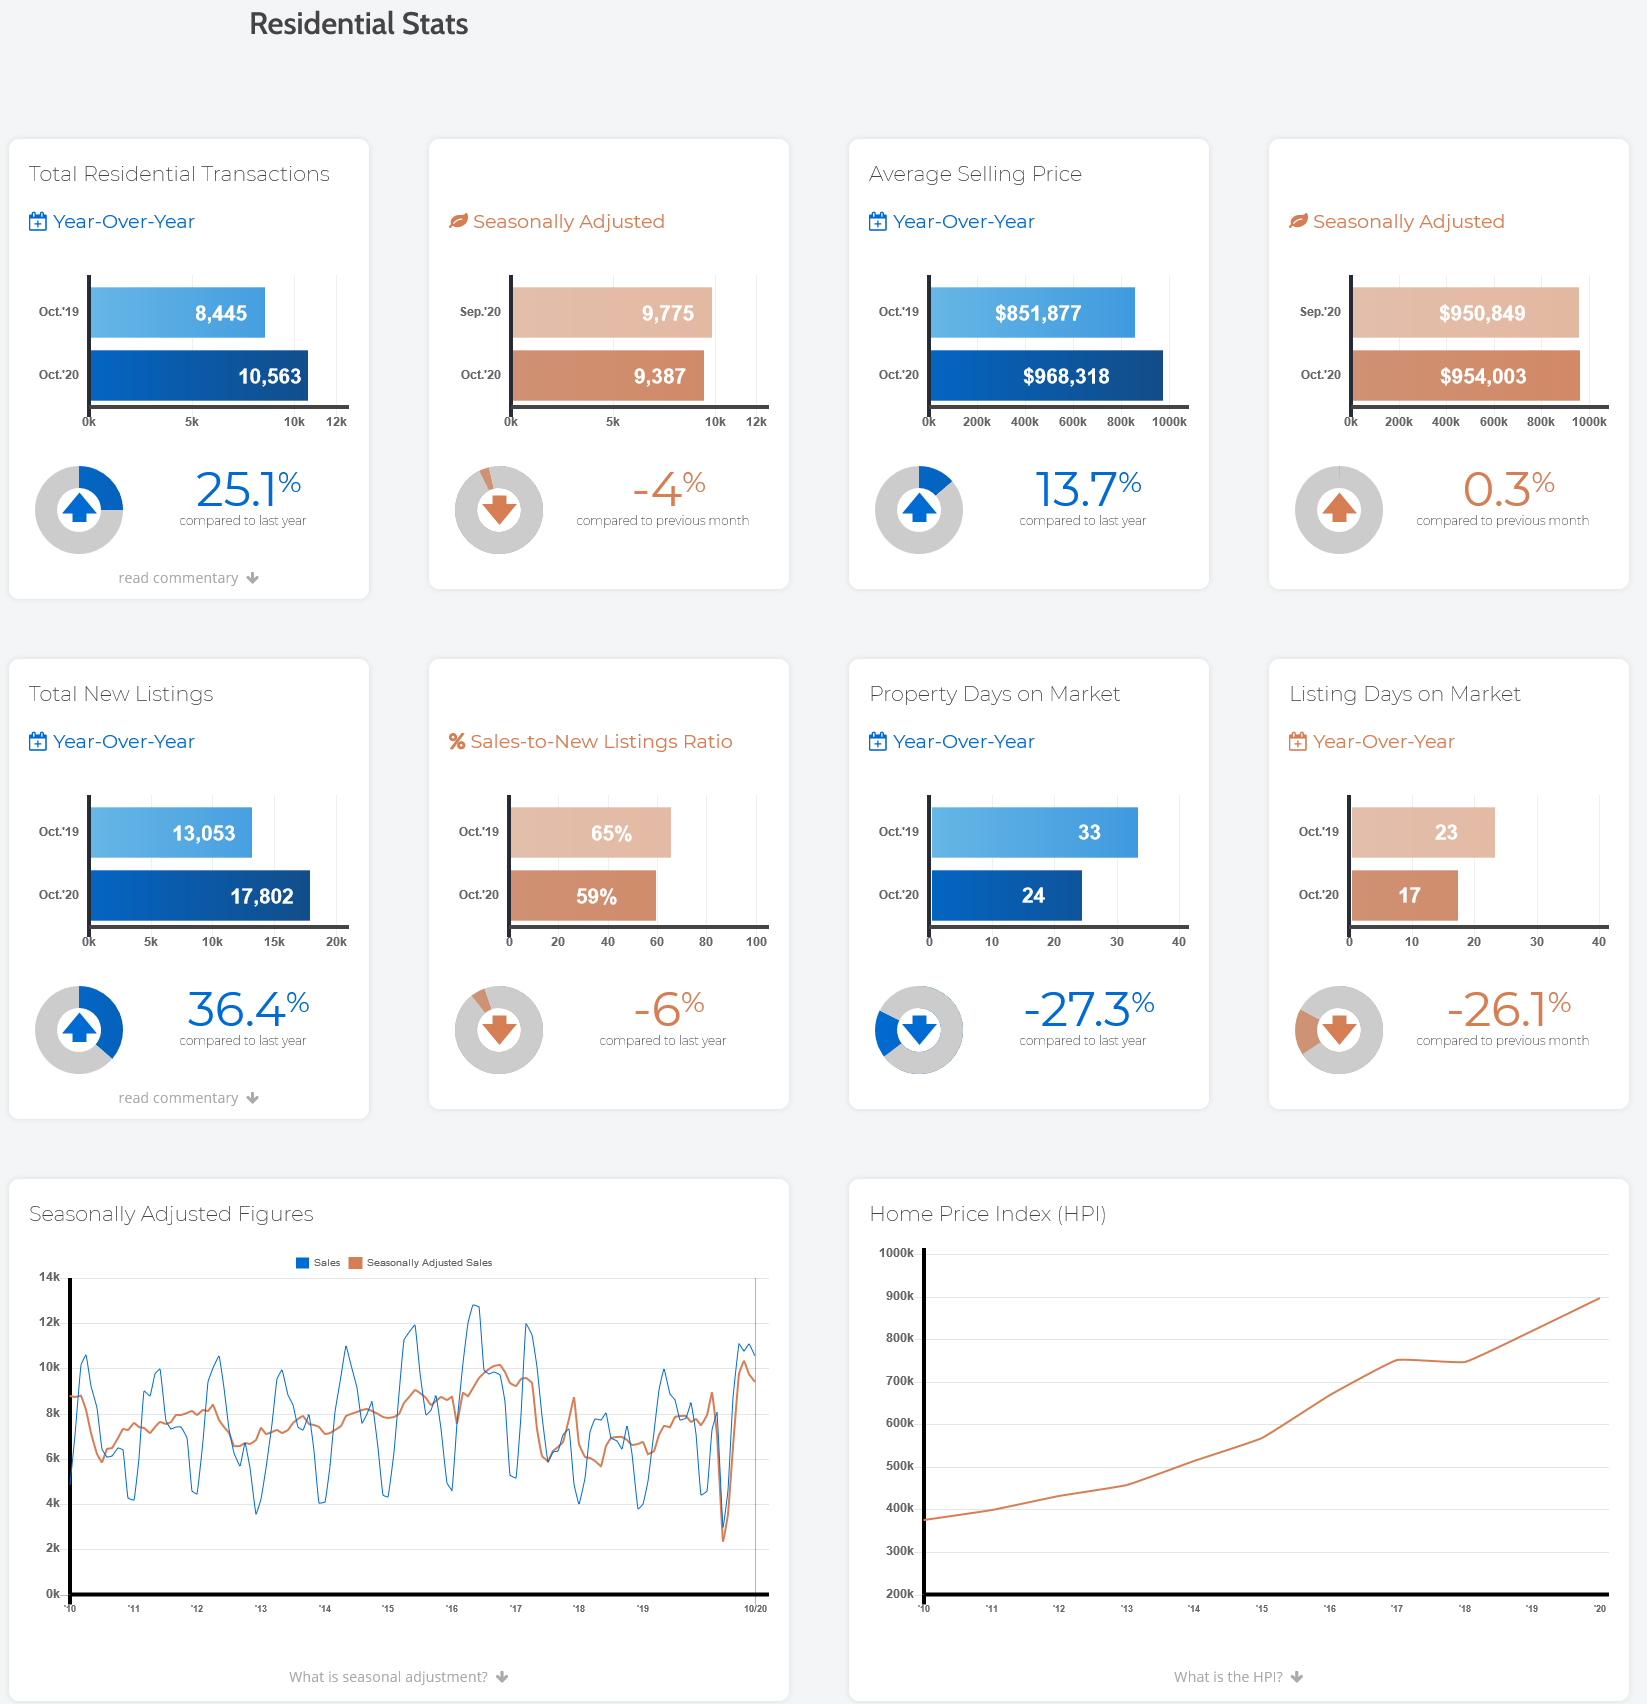
Members made 10,563 sales as reported through the Toronto Regional Real Estate Board’s MLS® System in October 2020. This was up by 25.1% compared to 8,445 transactions in October 2019.
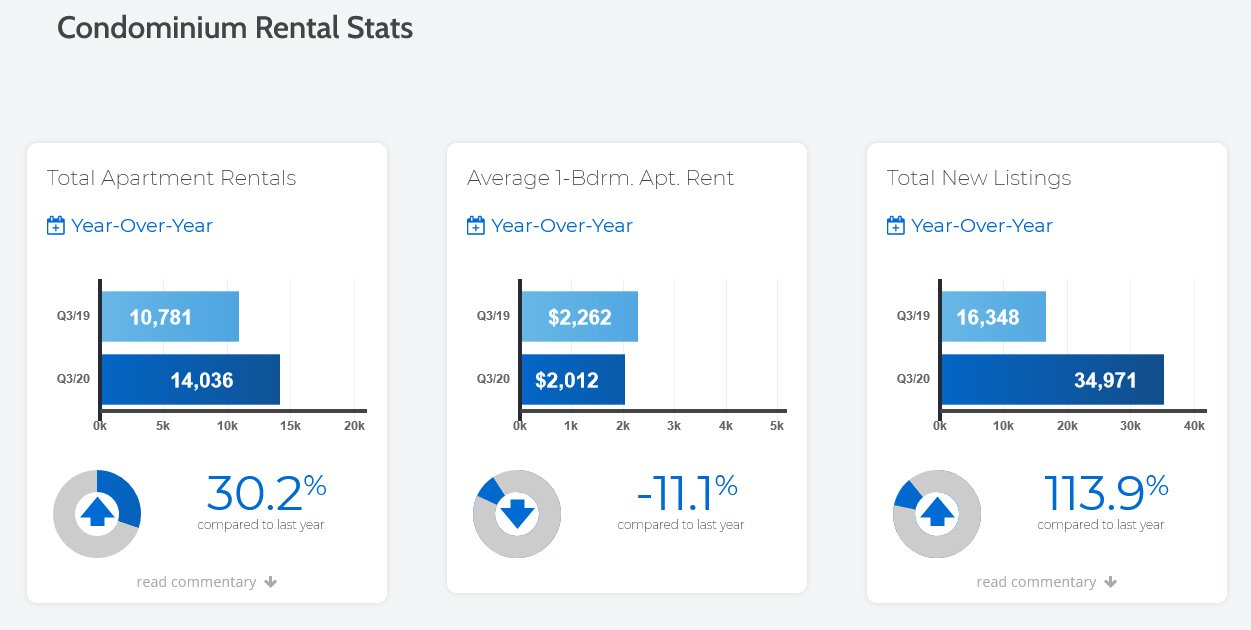
Sales and new listings reached record levels for the month of October. However, year-over-year growth rates for sales and new listings diverged in some market segments. In the detached market segment, the pace of annual sales growth far outstripped growth in new listings. Conversely, the condominium apartment market segment experienced more than double the new listings compared to October 2019, whereas sales were only up by 2.2% over the same period.
Read the full report on the TRREB website.
The following data is a comparison between October 2019 and October 2020 numbers, and is current as of November 2020. For last month’s numbers, check out our previous infographic!
Or follow this link for all our TREB / TRREB Infographics!
Click on the images for a larger view! (Protip: Make sure to grab the printable PDF versions, too! It fits best when printed on A4-sized sheets, AND we’ve added an area on the sheet where you can attach your business card! 🙂 )
Download Printable Version – October 2020 TRREB, Toronto Market Report
-
- (Image from TRREB website)

-
- (Image from TRREB website)
-
- (Image from TRREB website)

-
- (Image from TRREB website)

-
- (Image from TRREB website)
Last Updated on July 25, 2022 by myRealPage
