INFOGRAPHICS: September 2021 REBGV Greater Vancouver Market Reports
Elevated home sale activity continues to outstrip the supply of homes for sale in Metro Vancouver
Home sale activity remains elevated across Metro Vancouver’s housing market while the pace of homes being listed for sale continues to follow long-term averages.
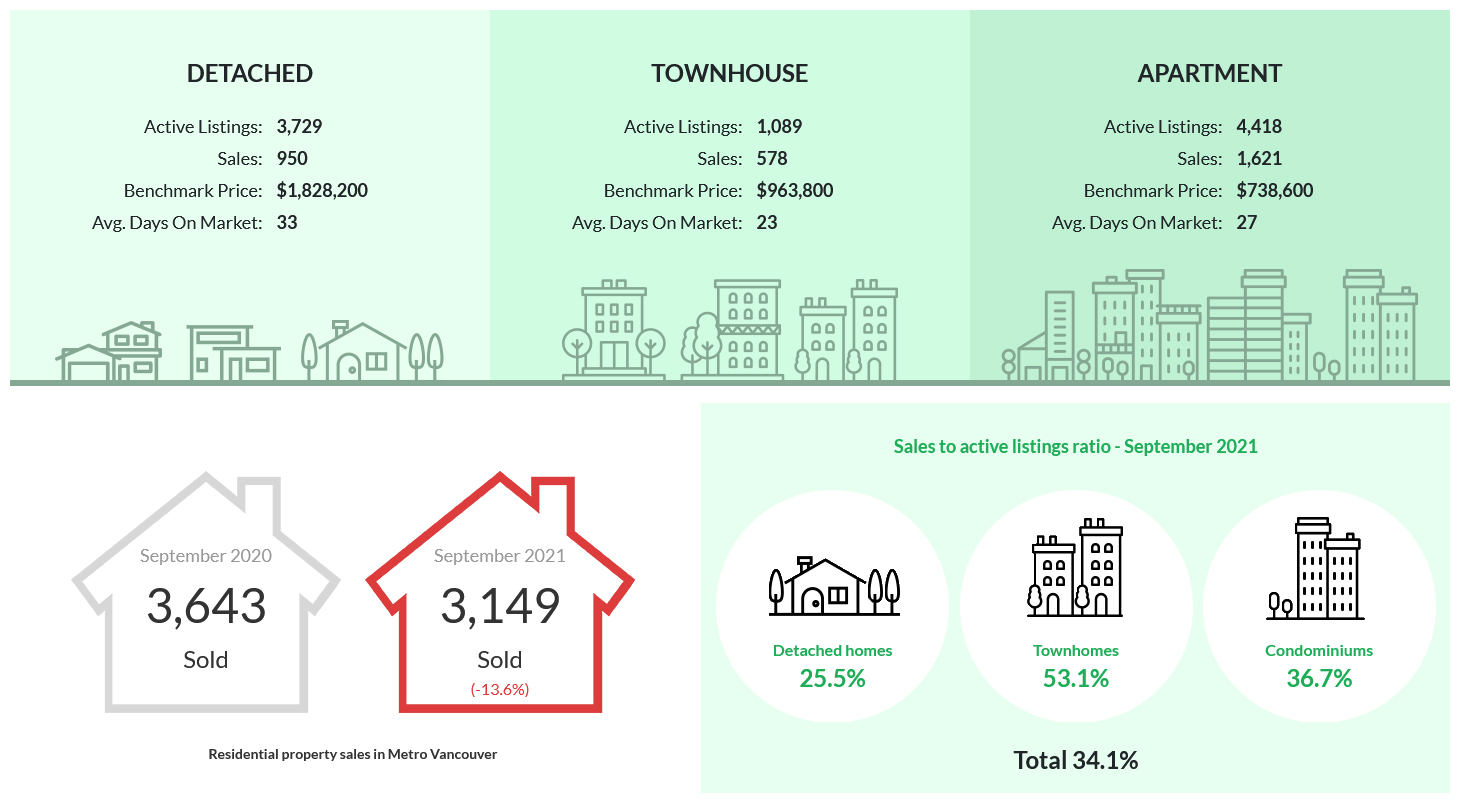
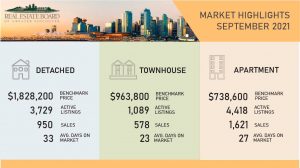
The Real Estate Board of Greater Vancouver (REBGV) reports that residential home sales in the region totalled 3,149 in September 2021, a 13.6% decrease from the 3,643 sales recorded in September 2020, and a 0.1% decrease from the 3,152 homes sold in August 2021.
Last month’s sales were 20.8% above the 10-year September sales average.
There were 5,171 detached, attached and apartment properties newly listed for sale on the Multiple Listing Service® (MLS®) in Metro Vancouver in September 2021. This represents a 19.2% decrease compared to the 6,402 homes listed in September 2020 and a 28.2% increase compared to August 2021 when 4,032 homes were listed.
September’s new listings were 1.2% below the 10-year average for the month.
Read the full report on the REBGV website!
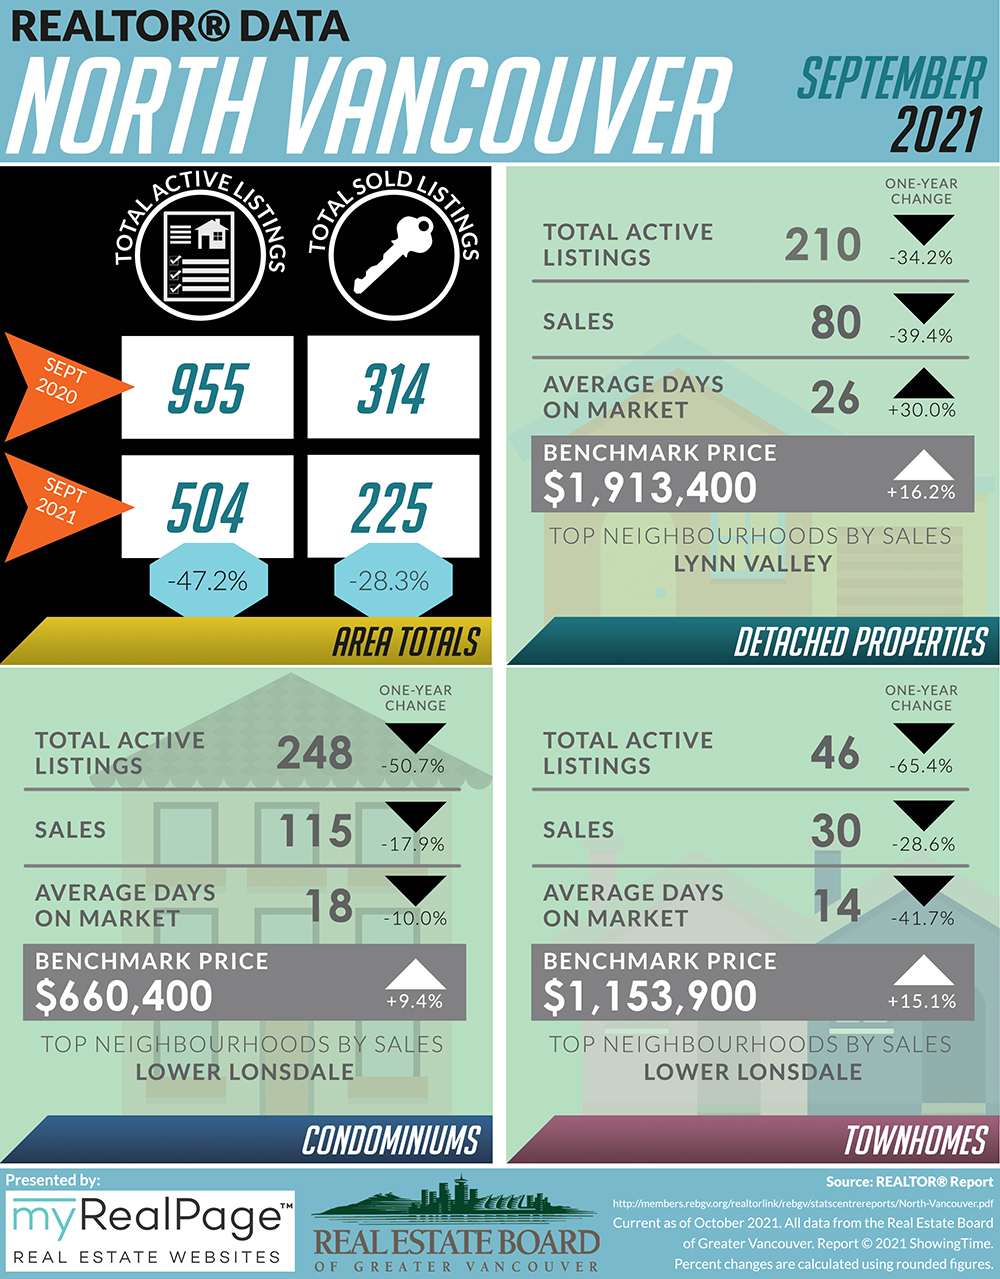
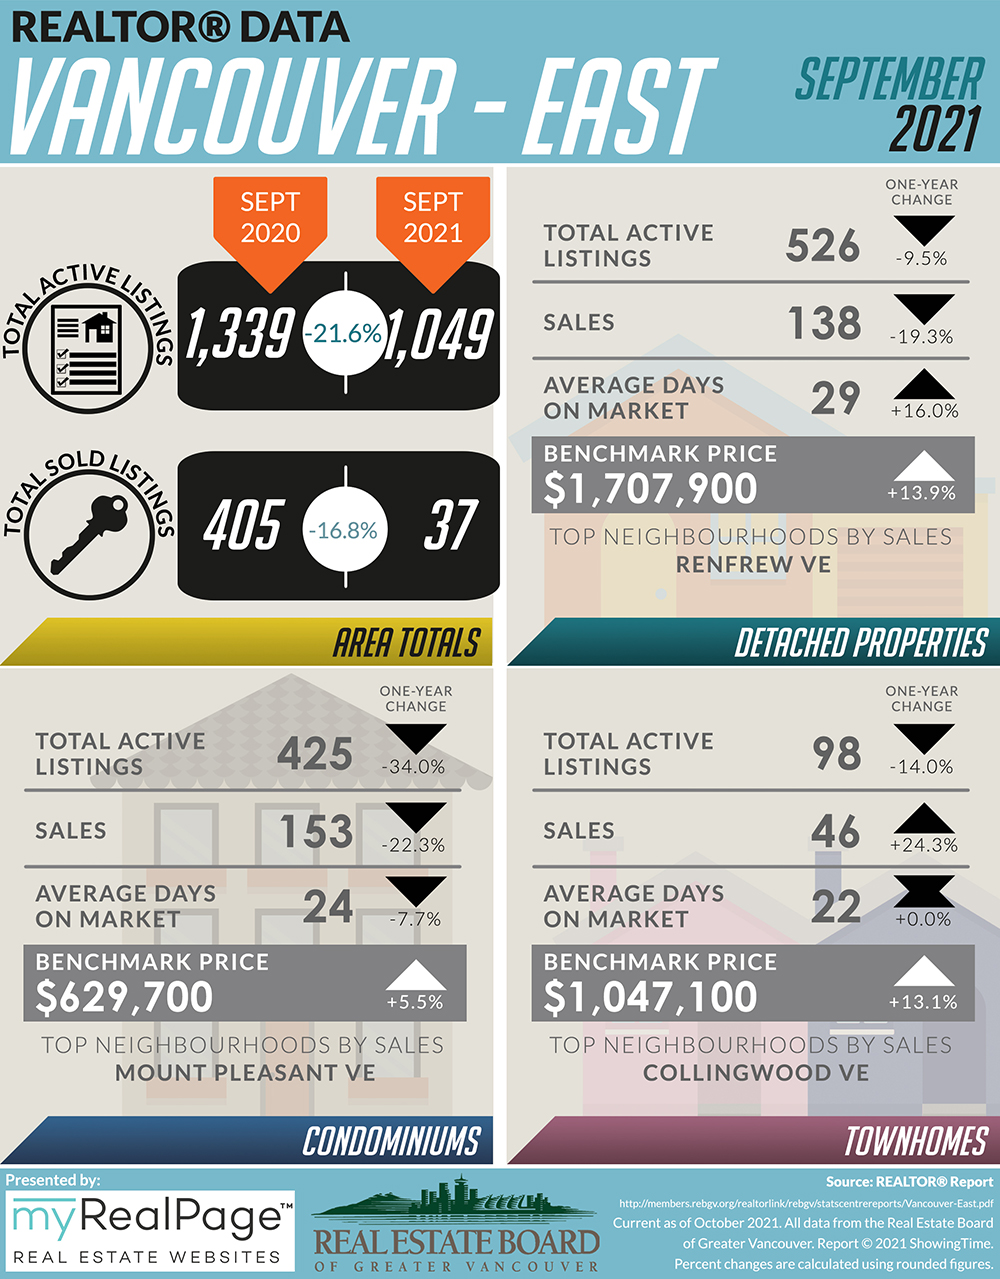
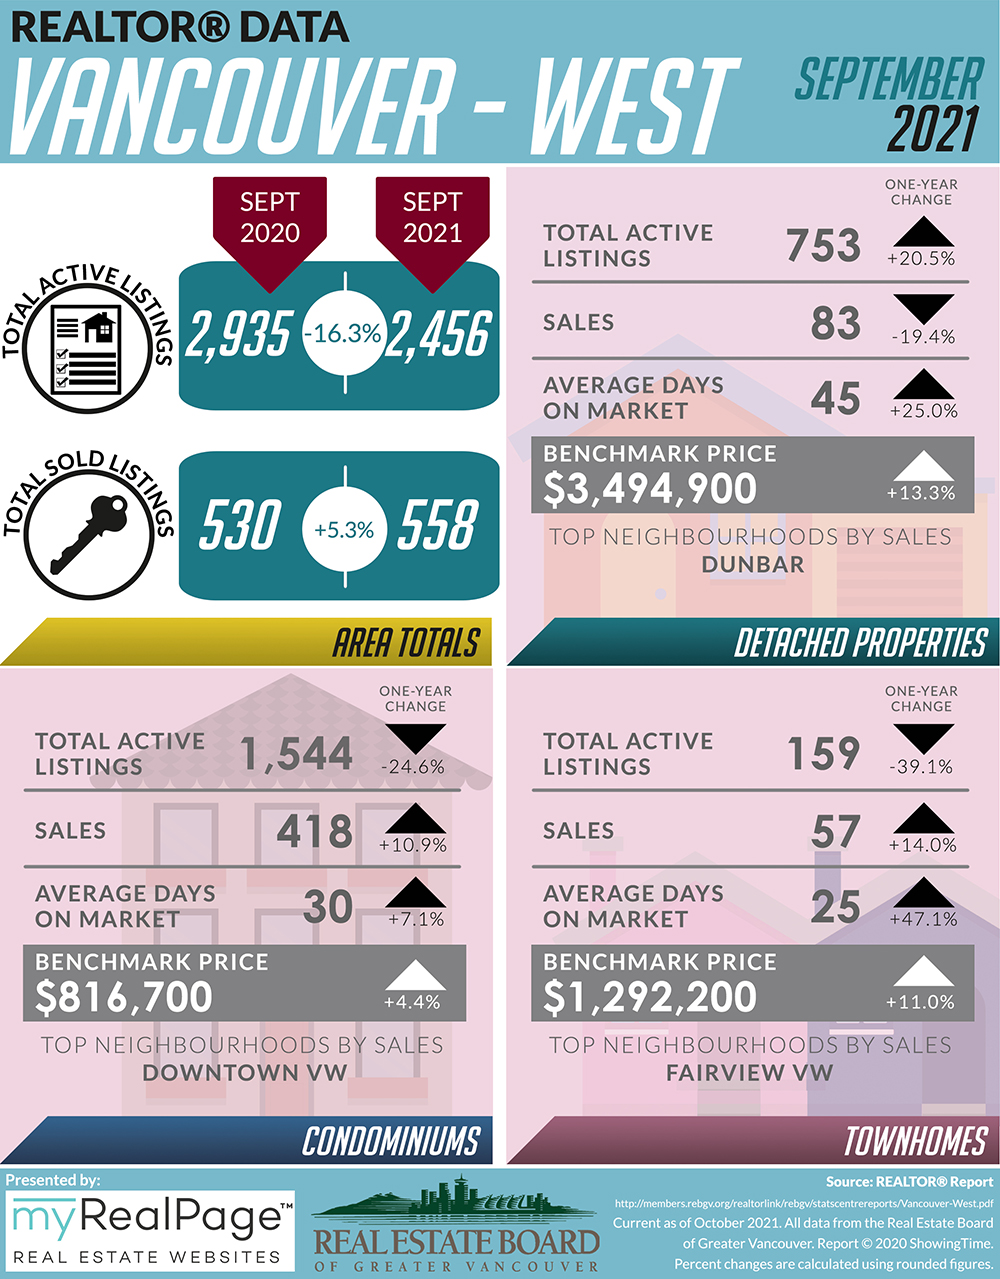
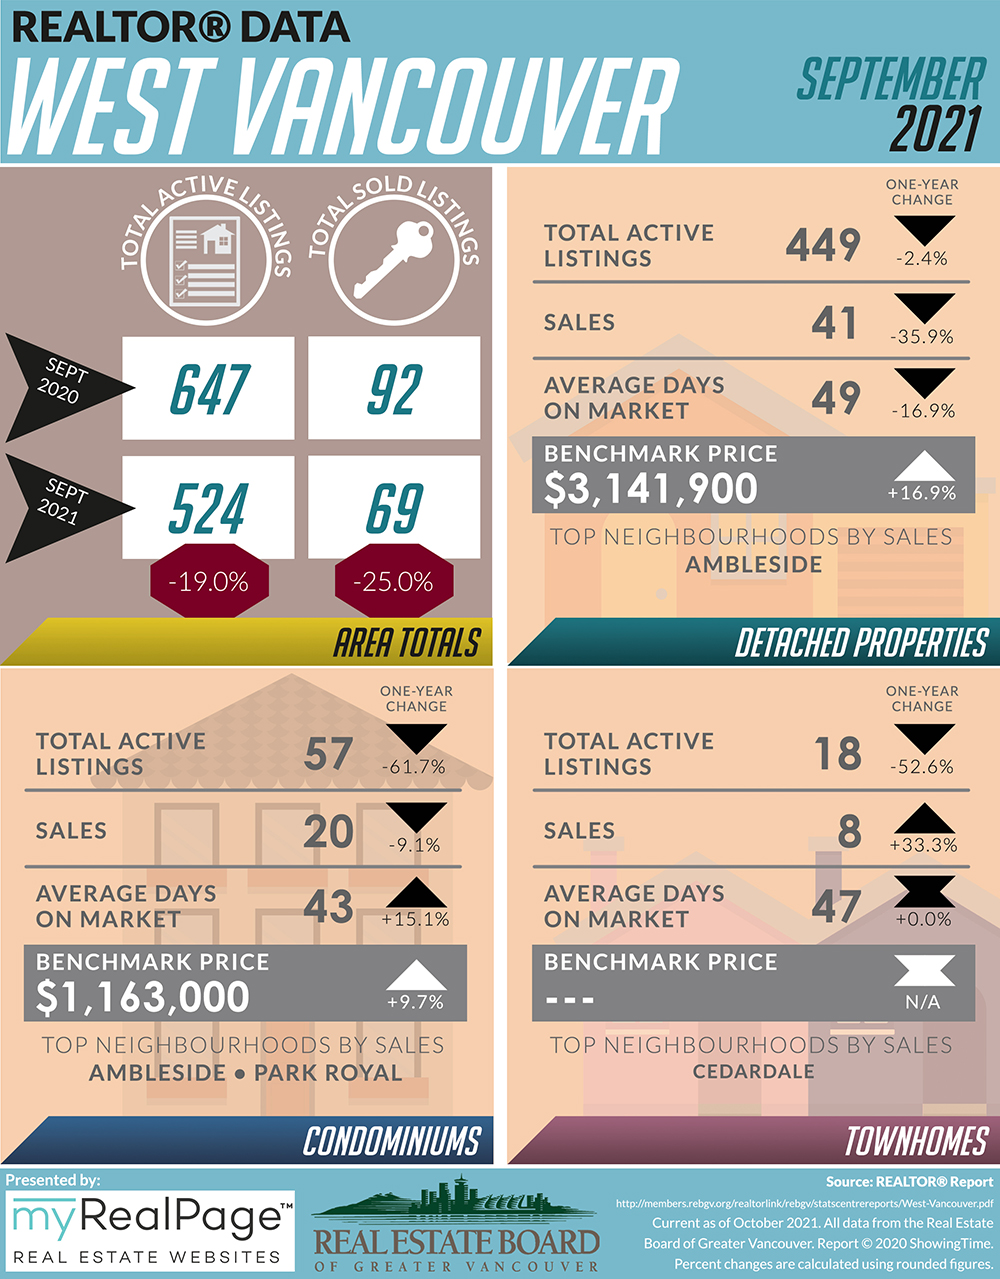
The following data is a comparison between September 2020 and September 2021 numbers, and is current as of October 2021. For last month’s update, you can check out our previous post!
Or follow this link for all our REBGV Infographics!
These infographics cover current trends in North Vancouver, West Vancouver, Vancouver East, and Vancouver West. Click on the images for a larger view! (Protip: Make sure to grab the printable PDF versions, too! It fits best when printed on A4-sized sheets, AND we’ve added an area on the sheet where you can attach your business card! 🙂 )
Download Printable Version – REBGV September 2021 Data Infographics
-
- (from REBGV website)
-
- (from REBGV website)

-

- (from REBGV website)

Last Updated on July 25, 2022 by myRealPage
