INFOGRAPHICS: January 2026 FVREB Fraser Valley Market Reports
Fraser Valley home prices back to pandemic-era levels under weight of economic headwinds and sustained inventory
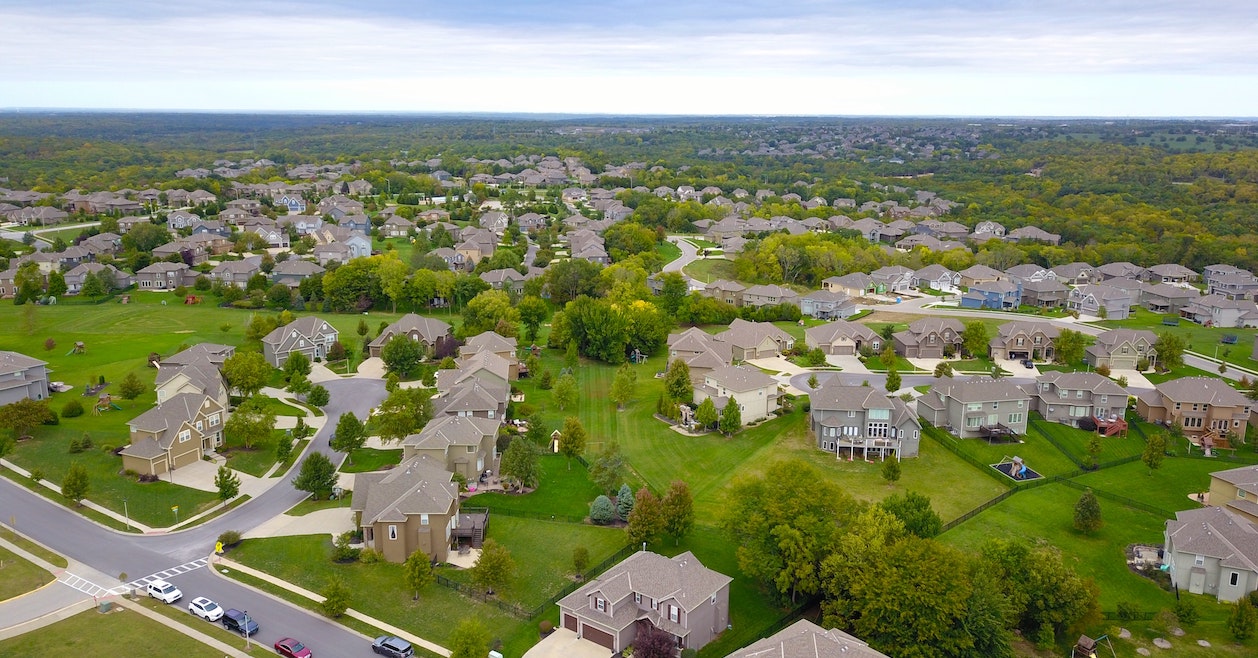
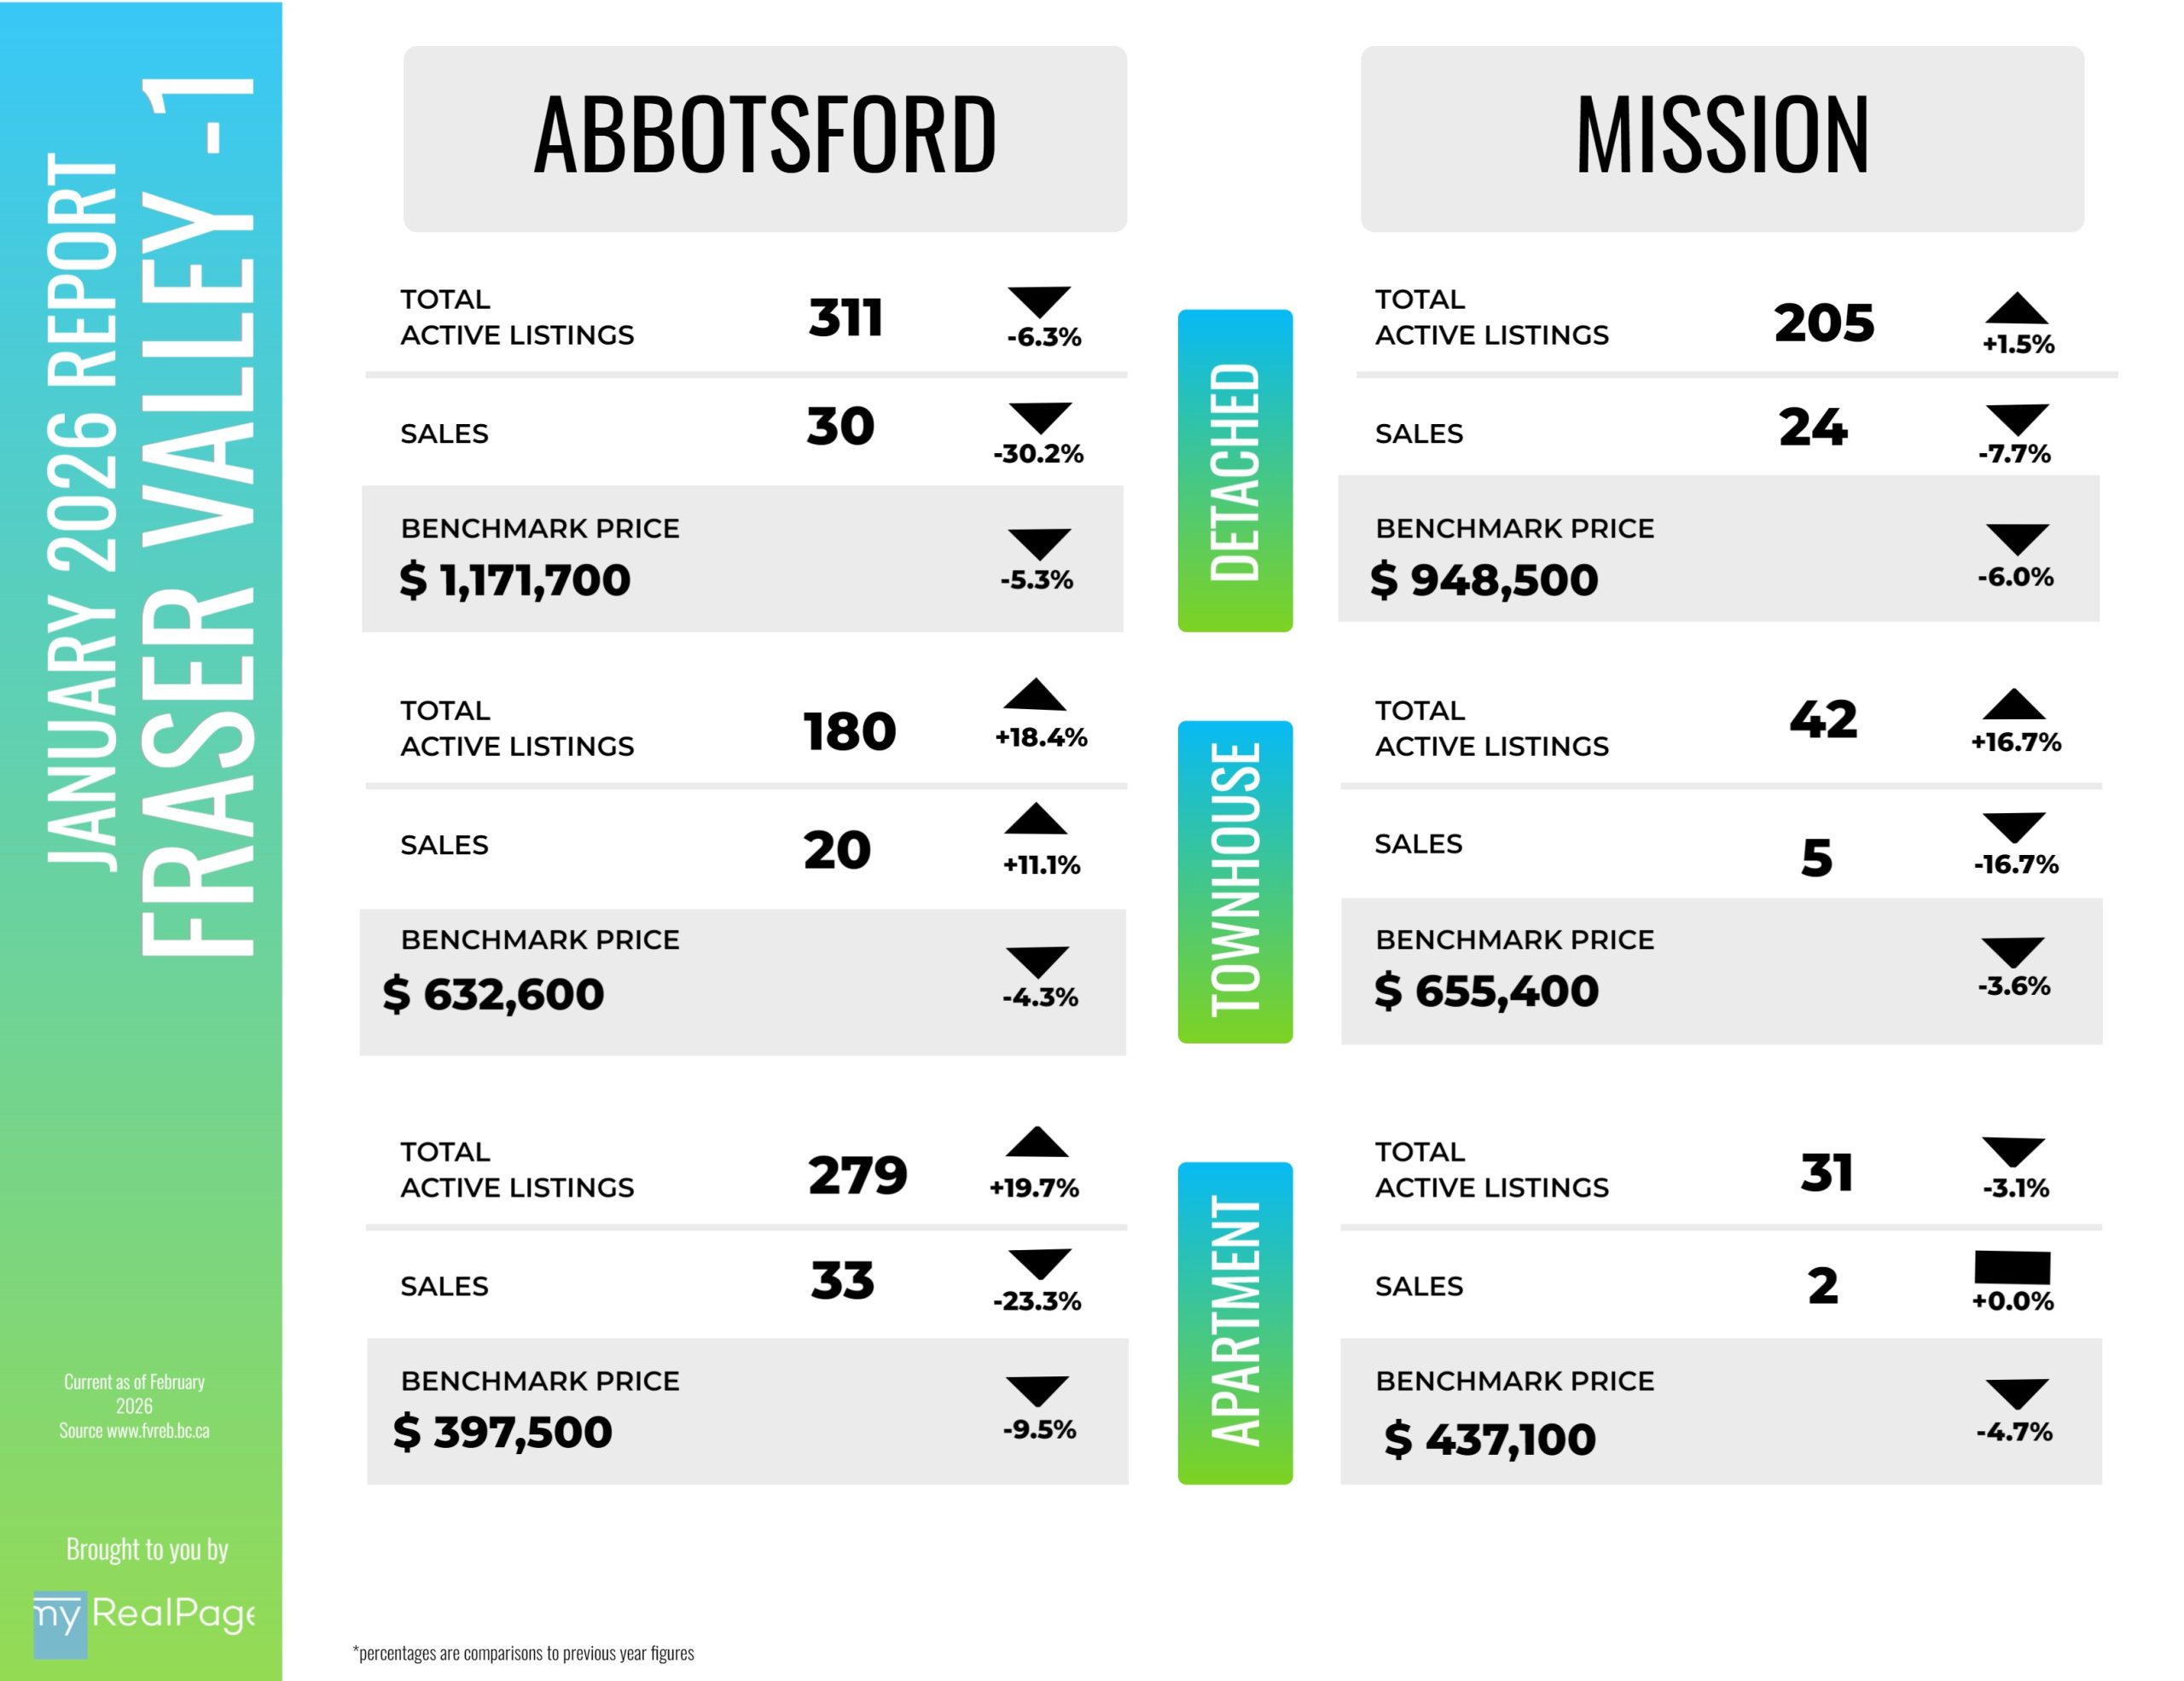
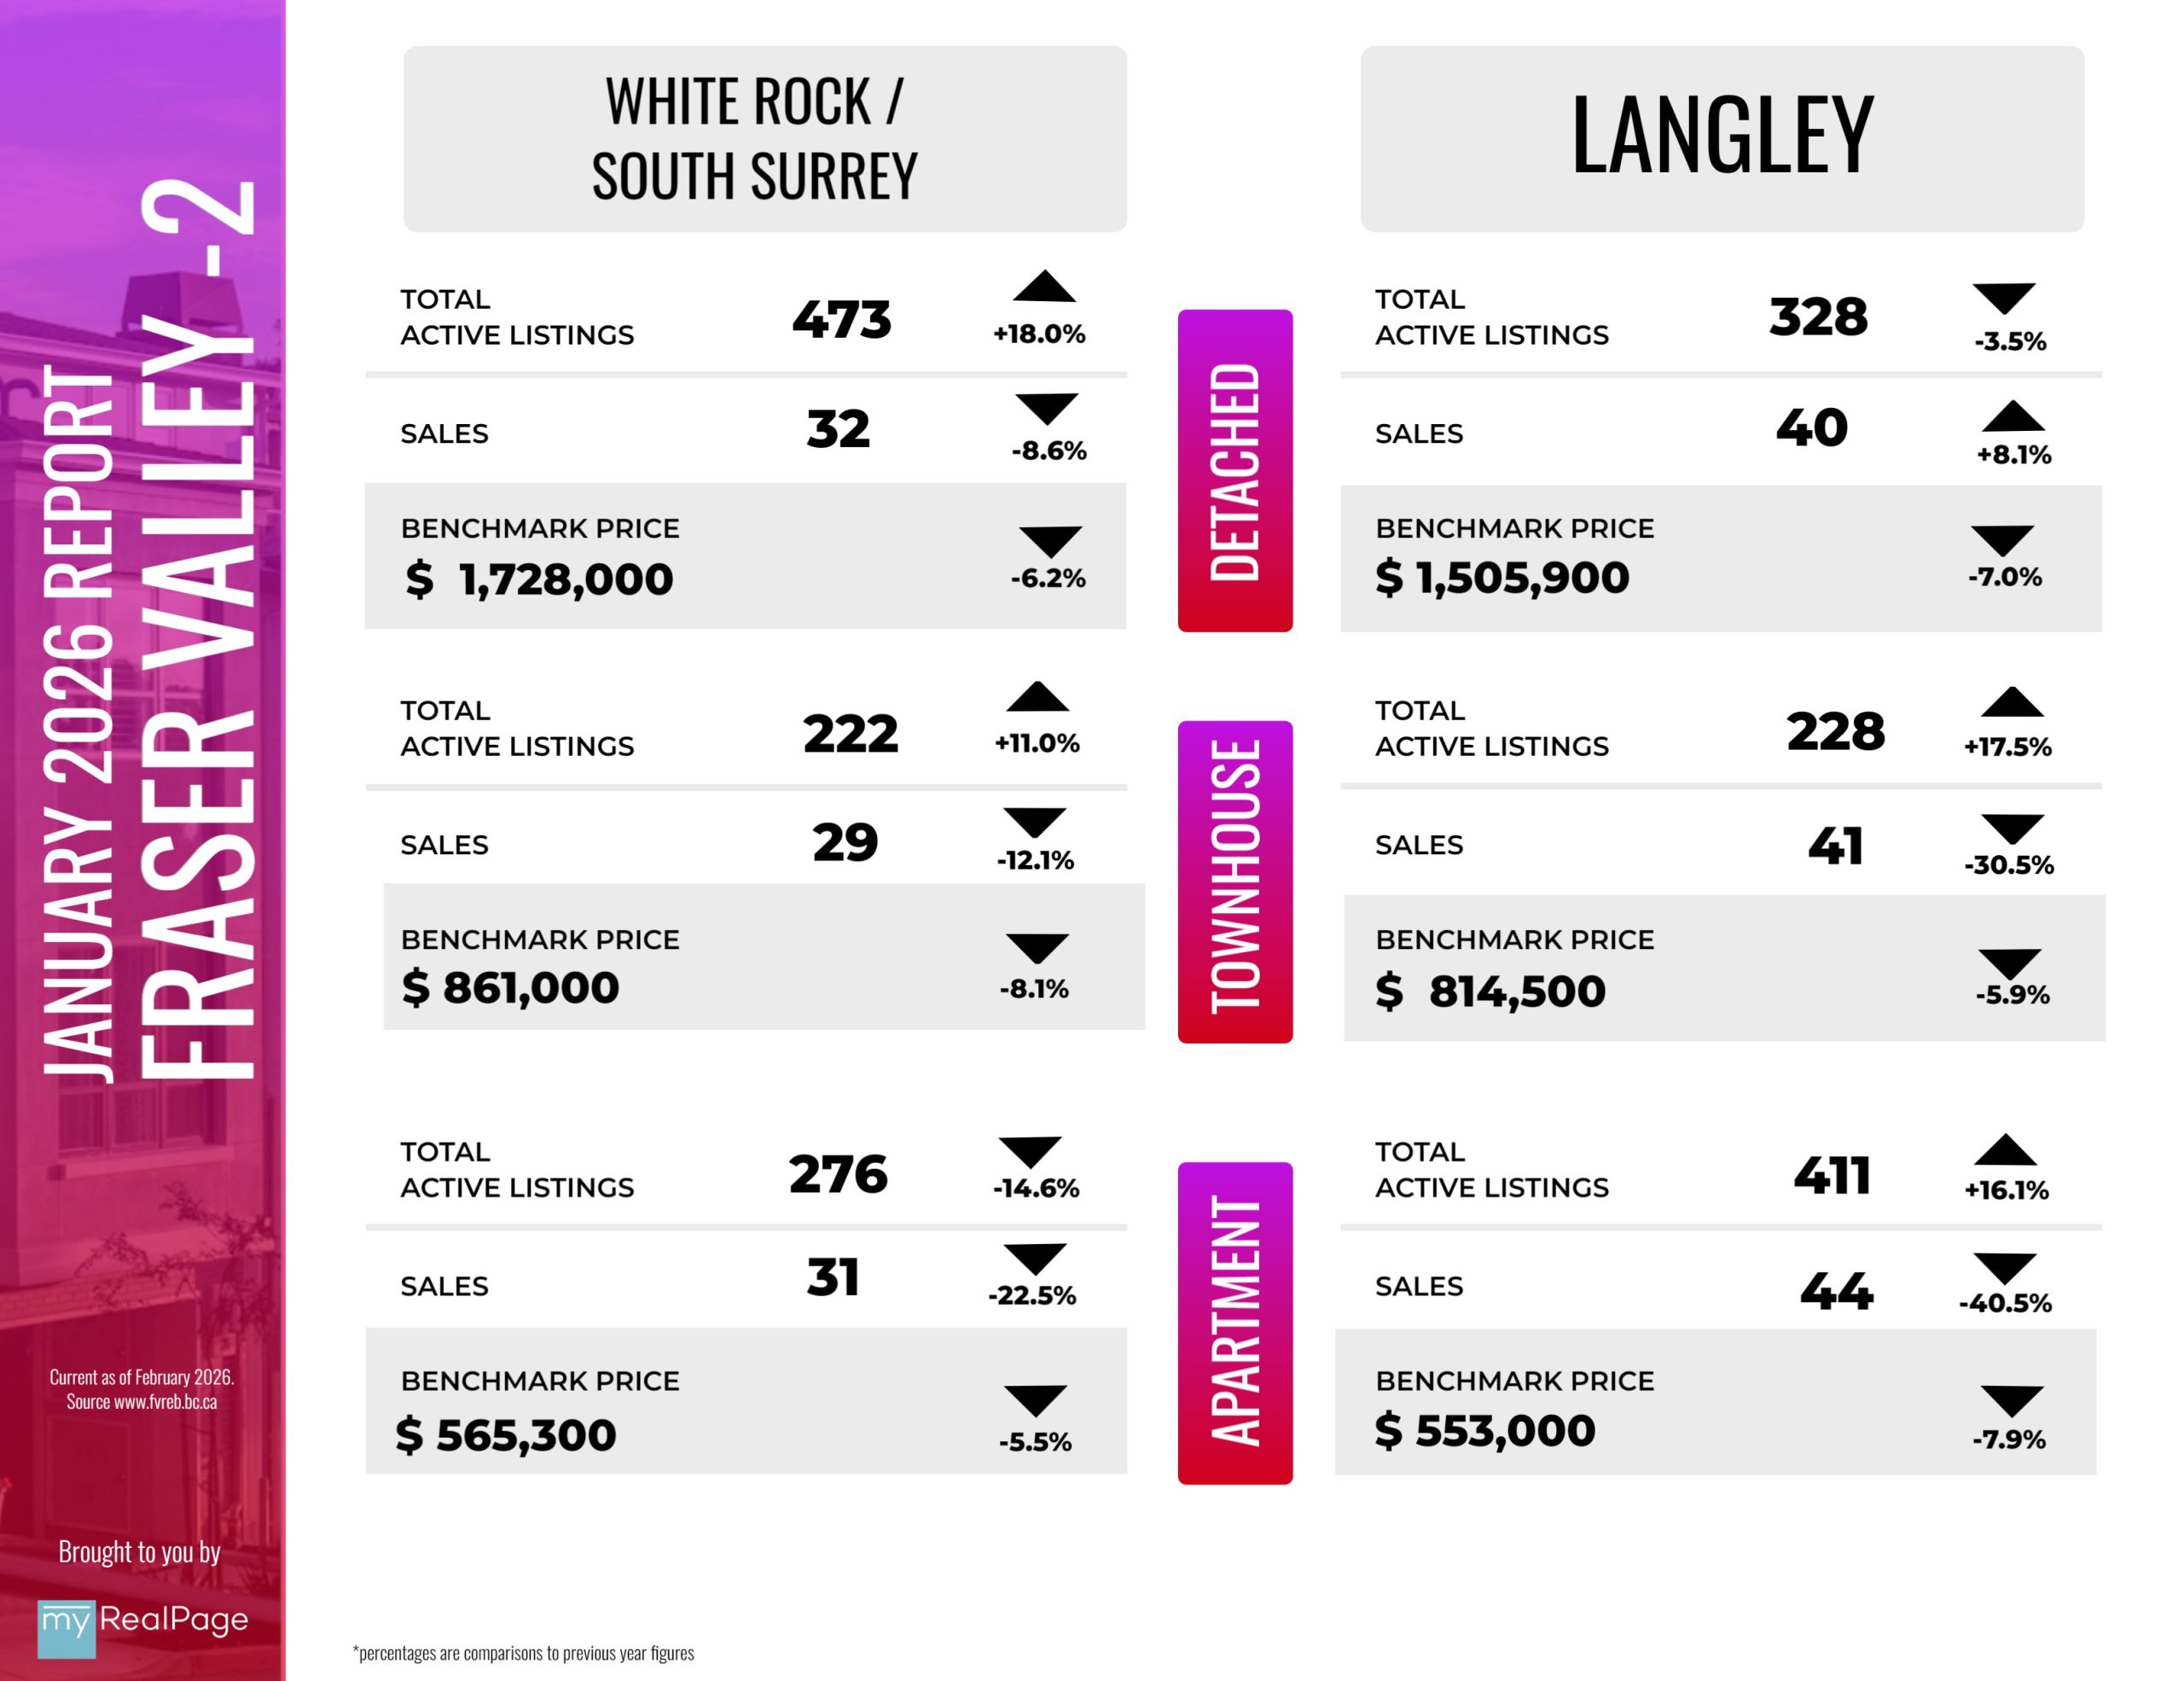
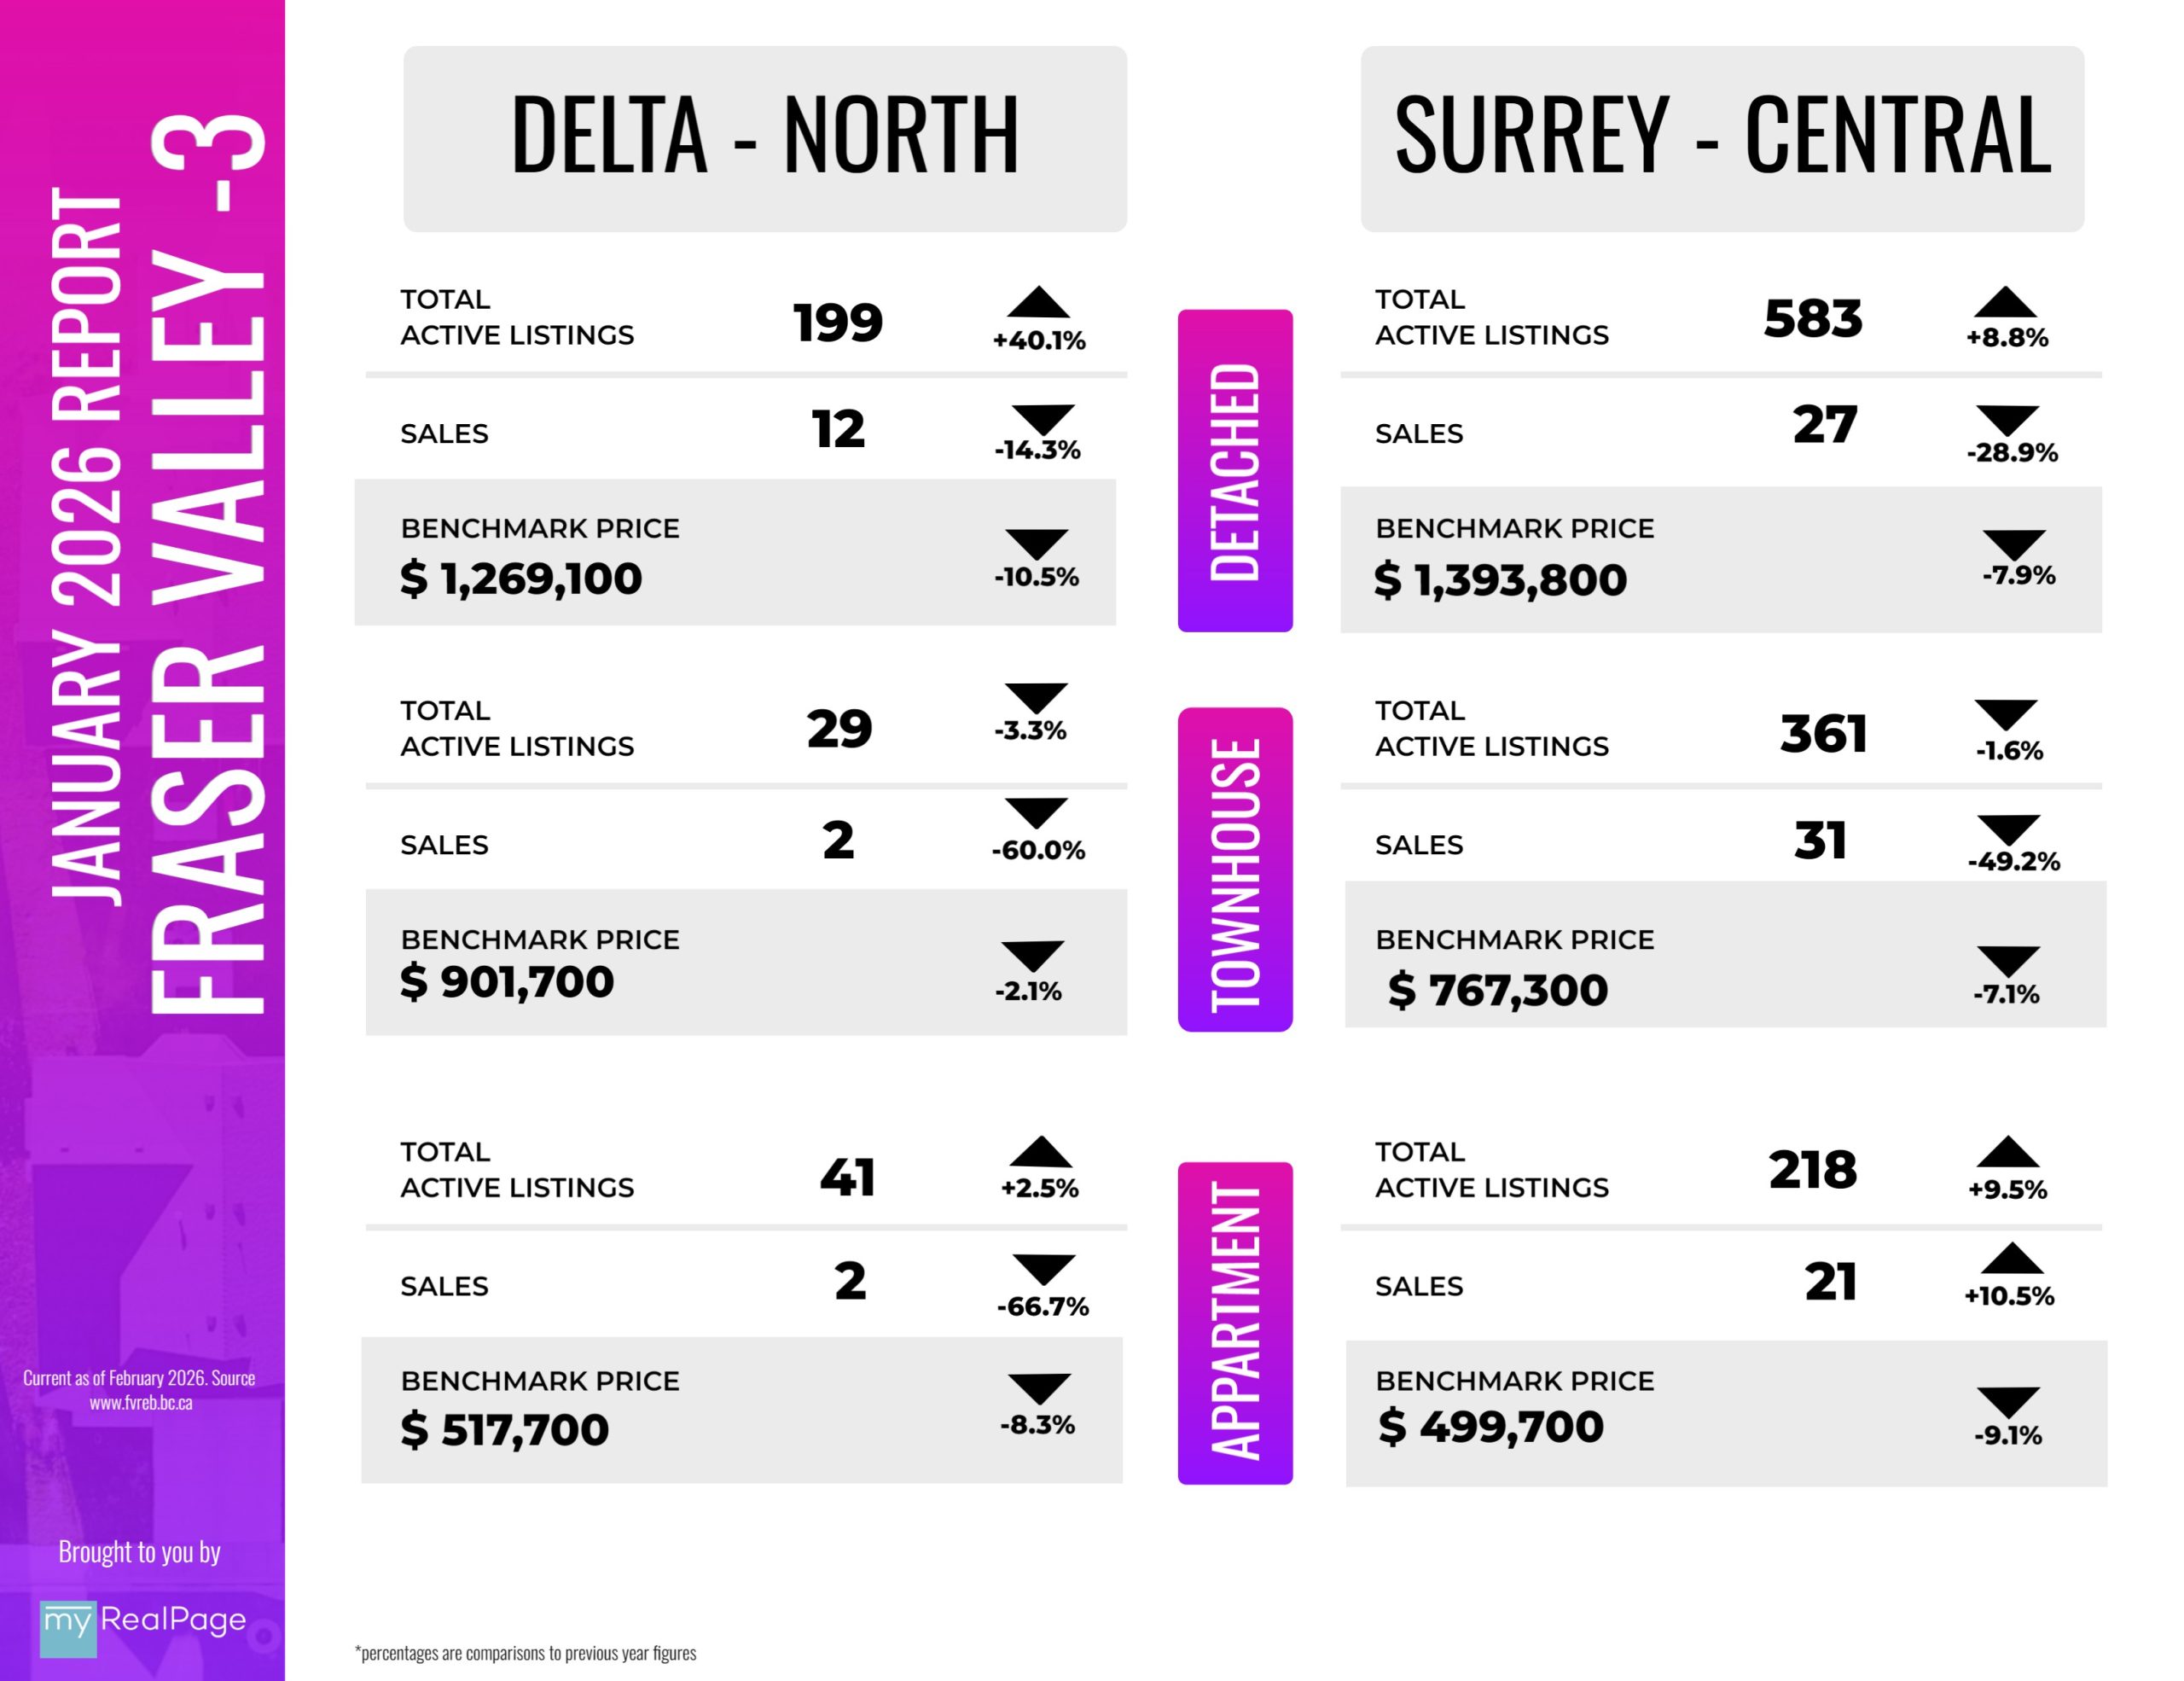
Home prices in the Fraser Valley fell for the tenth consecutive month in January, pushing the Benchmark price below $900,000 for the first time since spring 2021.
The Benchmark price for a typical home in the Fraser Valley dropped one per cent in January to $897,200, down 6.9 per cent year-over-year. The continued softening of prices wasn’t enough to get buyers off the sidelines, as the Fraser Valley Real Estate Board recorded 619 sales on its Multiple Listing Service® (MLS®) in January, a 33 per cent decrease from December, and 24 per cent below sales from the same month last year. New listings increased 128 per cent in January to 3,078, reflecting the typical seasonal patterns; however, activity remained 10 per cent below last year’s levels.
“January opened the year with negligible momentum,” said Tore Jacobsen, Chair of the Fraser Valley Real Estate Board. “Prices continued to weaken while at the same time selection remains high. Under normal market dynamics, these would be considered highly favourable conditions for buyers, however the uncertainty of the past year or so continues to loom large, subduing buyer confidence and muting overall market activity.”
Read the full report on the FVREB website!
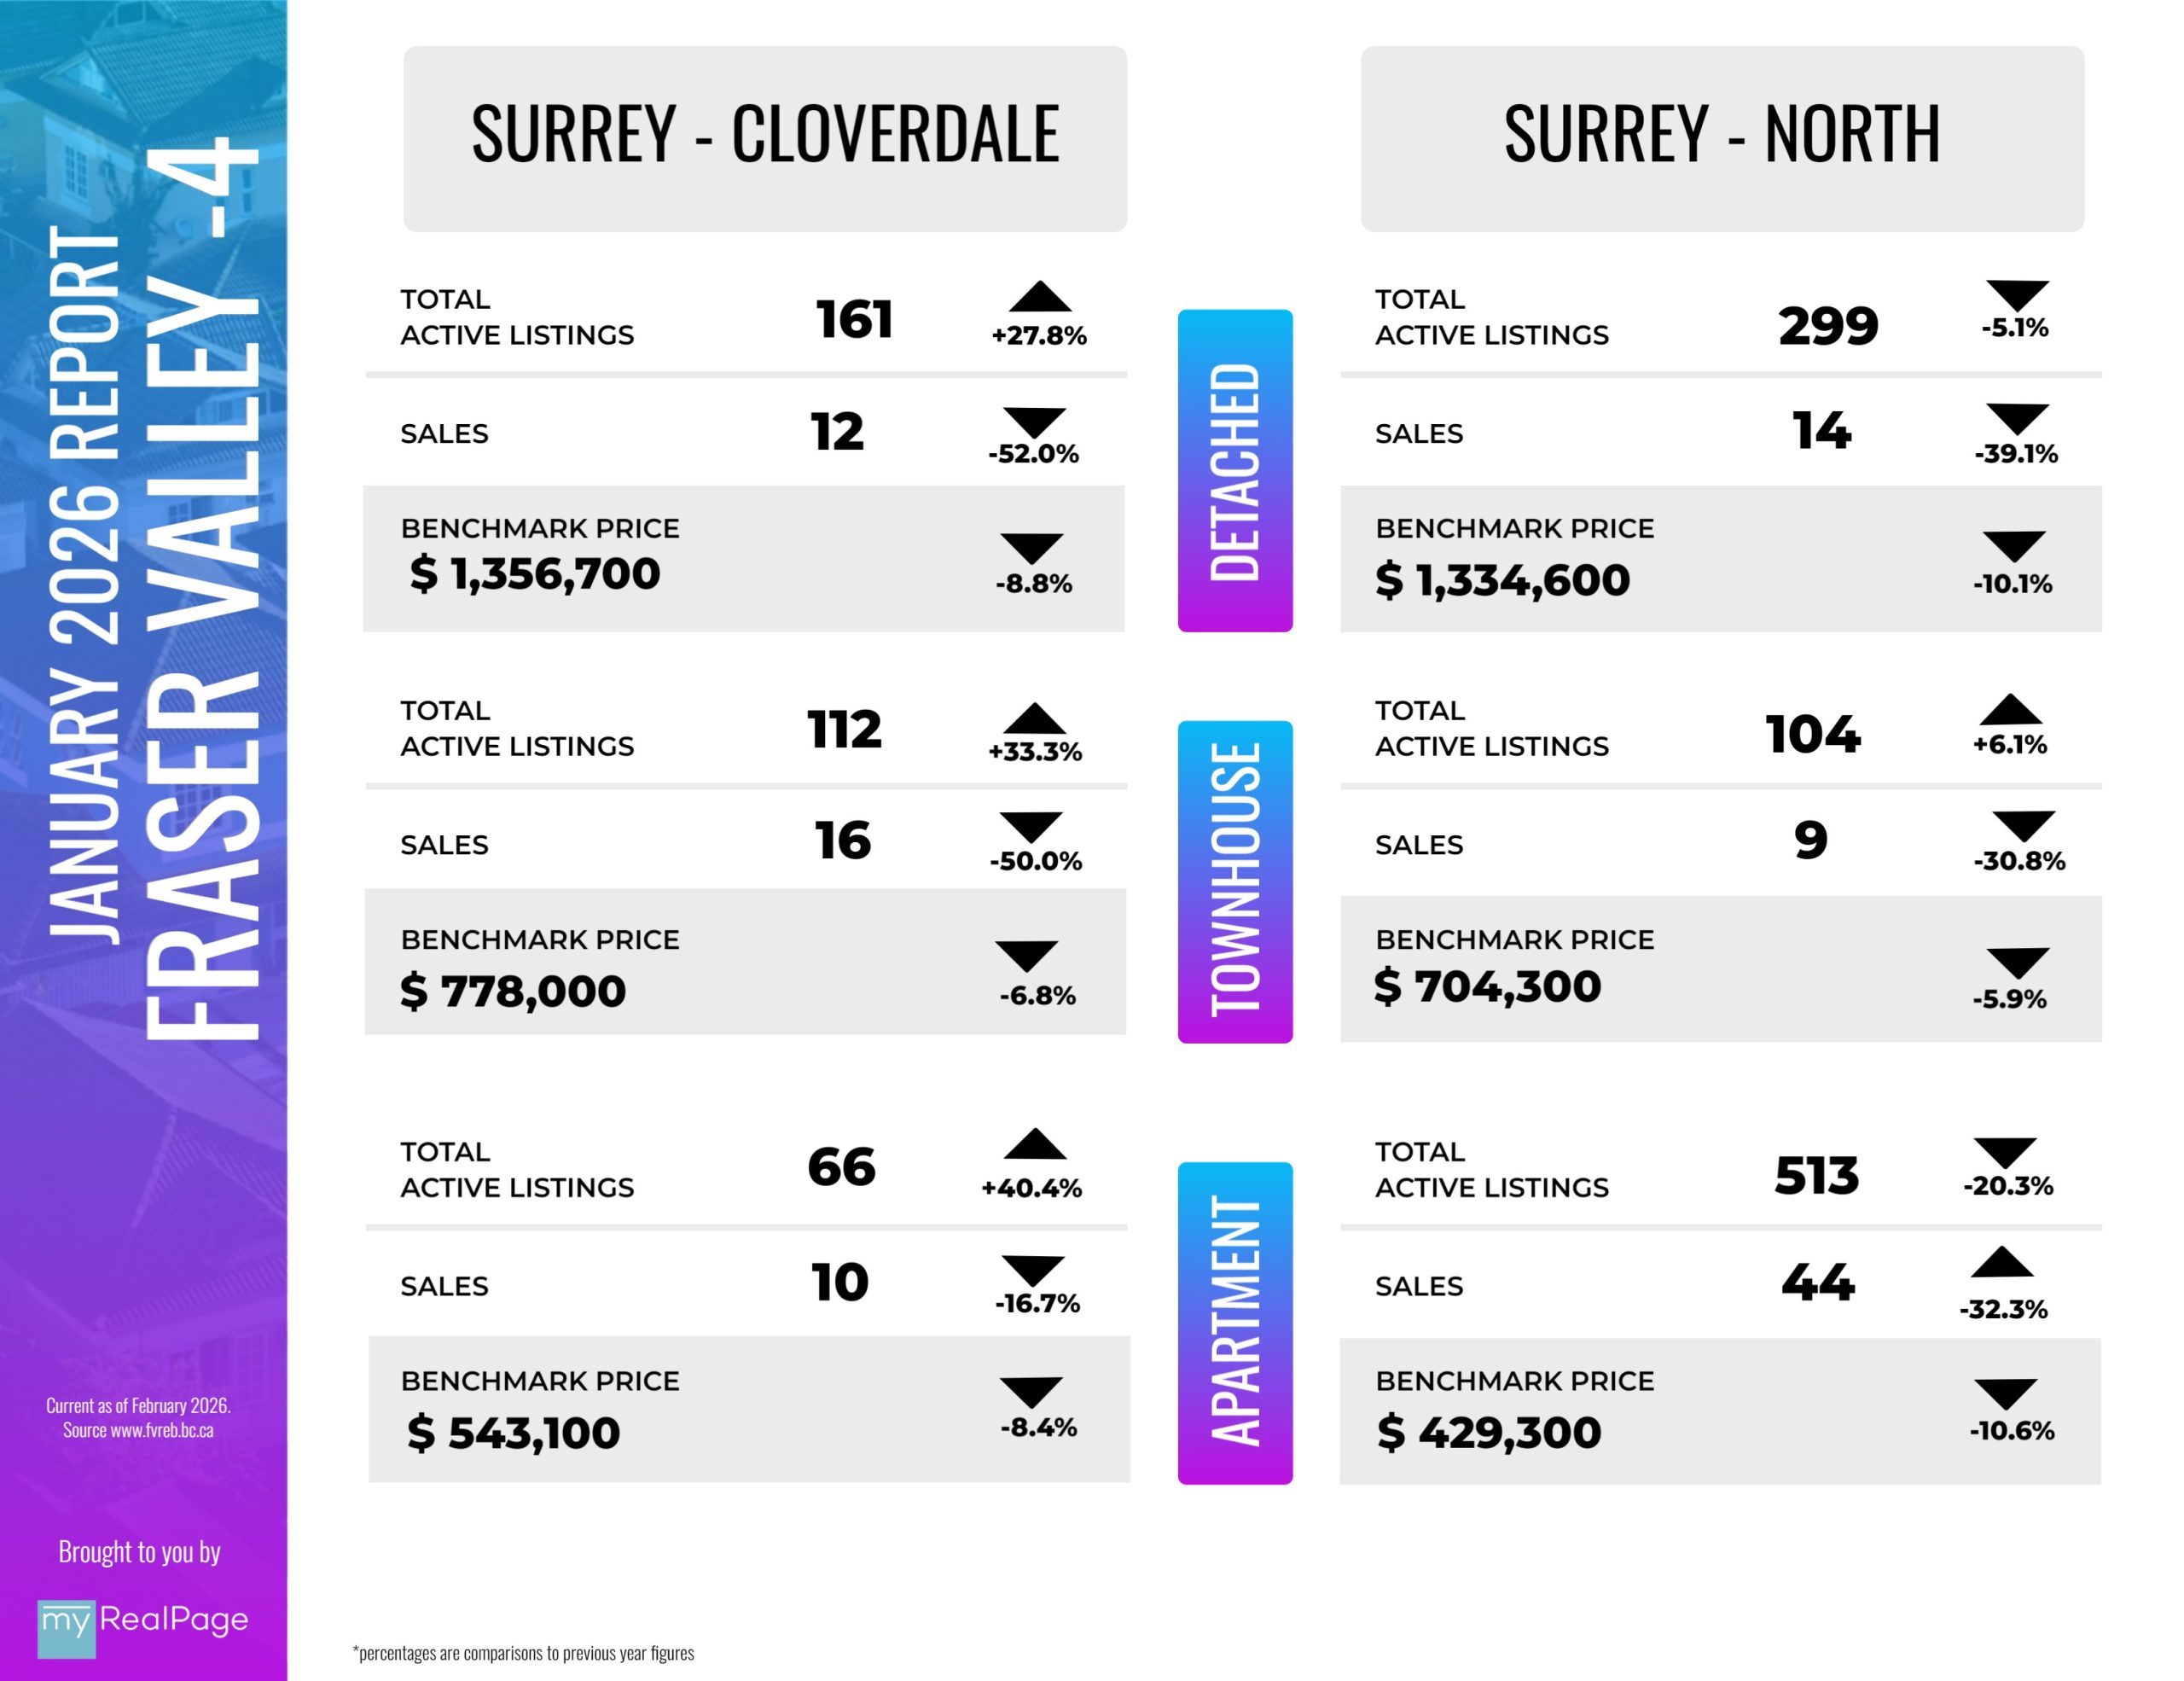
The following data is a comparison between January 2026 and January 2025 numbers, and is current as of February of 2026. For last month’s report, check out our previous infographic!
Or follow this link for all our FVREB Infographics!
These infographics cover current trends in Fraser Valley neighbourhoods that are within the FVREB. Click on the images for a larger view!
Download Printable Version – FVREB Janaury 2026 Market Report
Last Updated on February 6, 2026 by myRealPage
