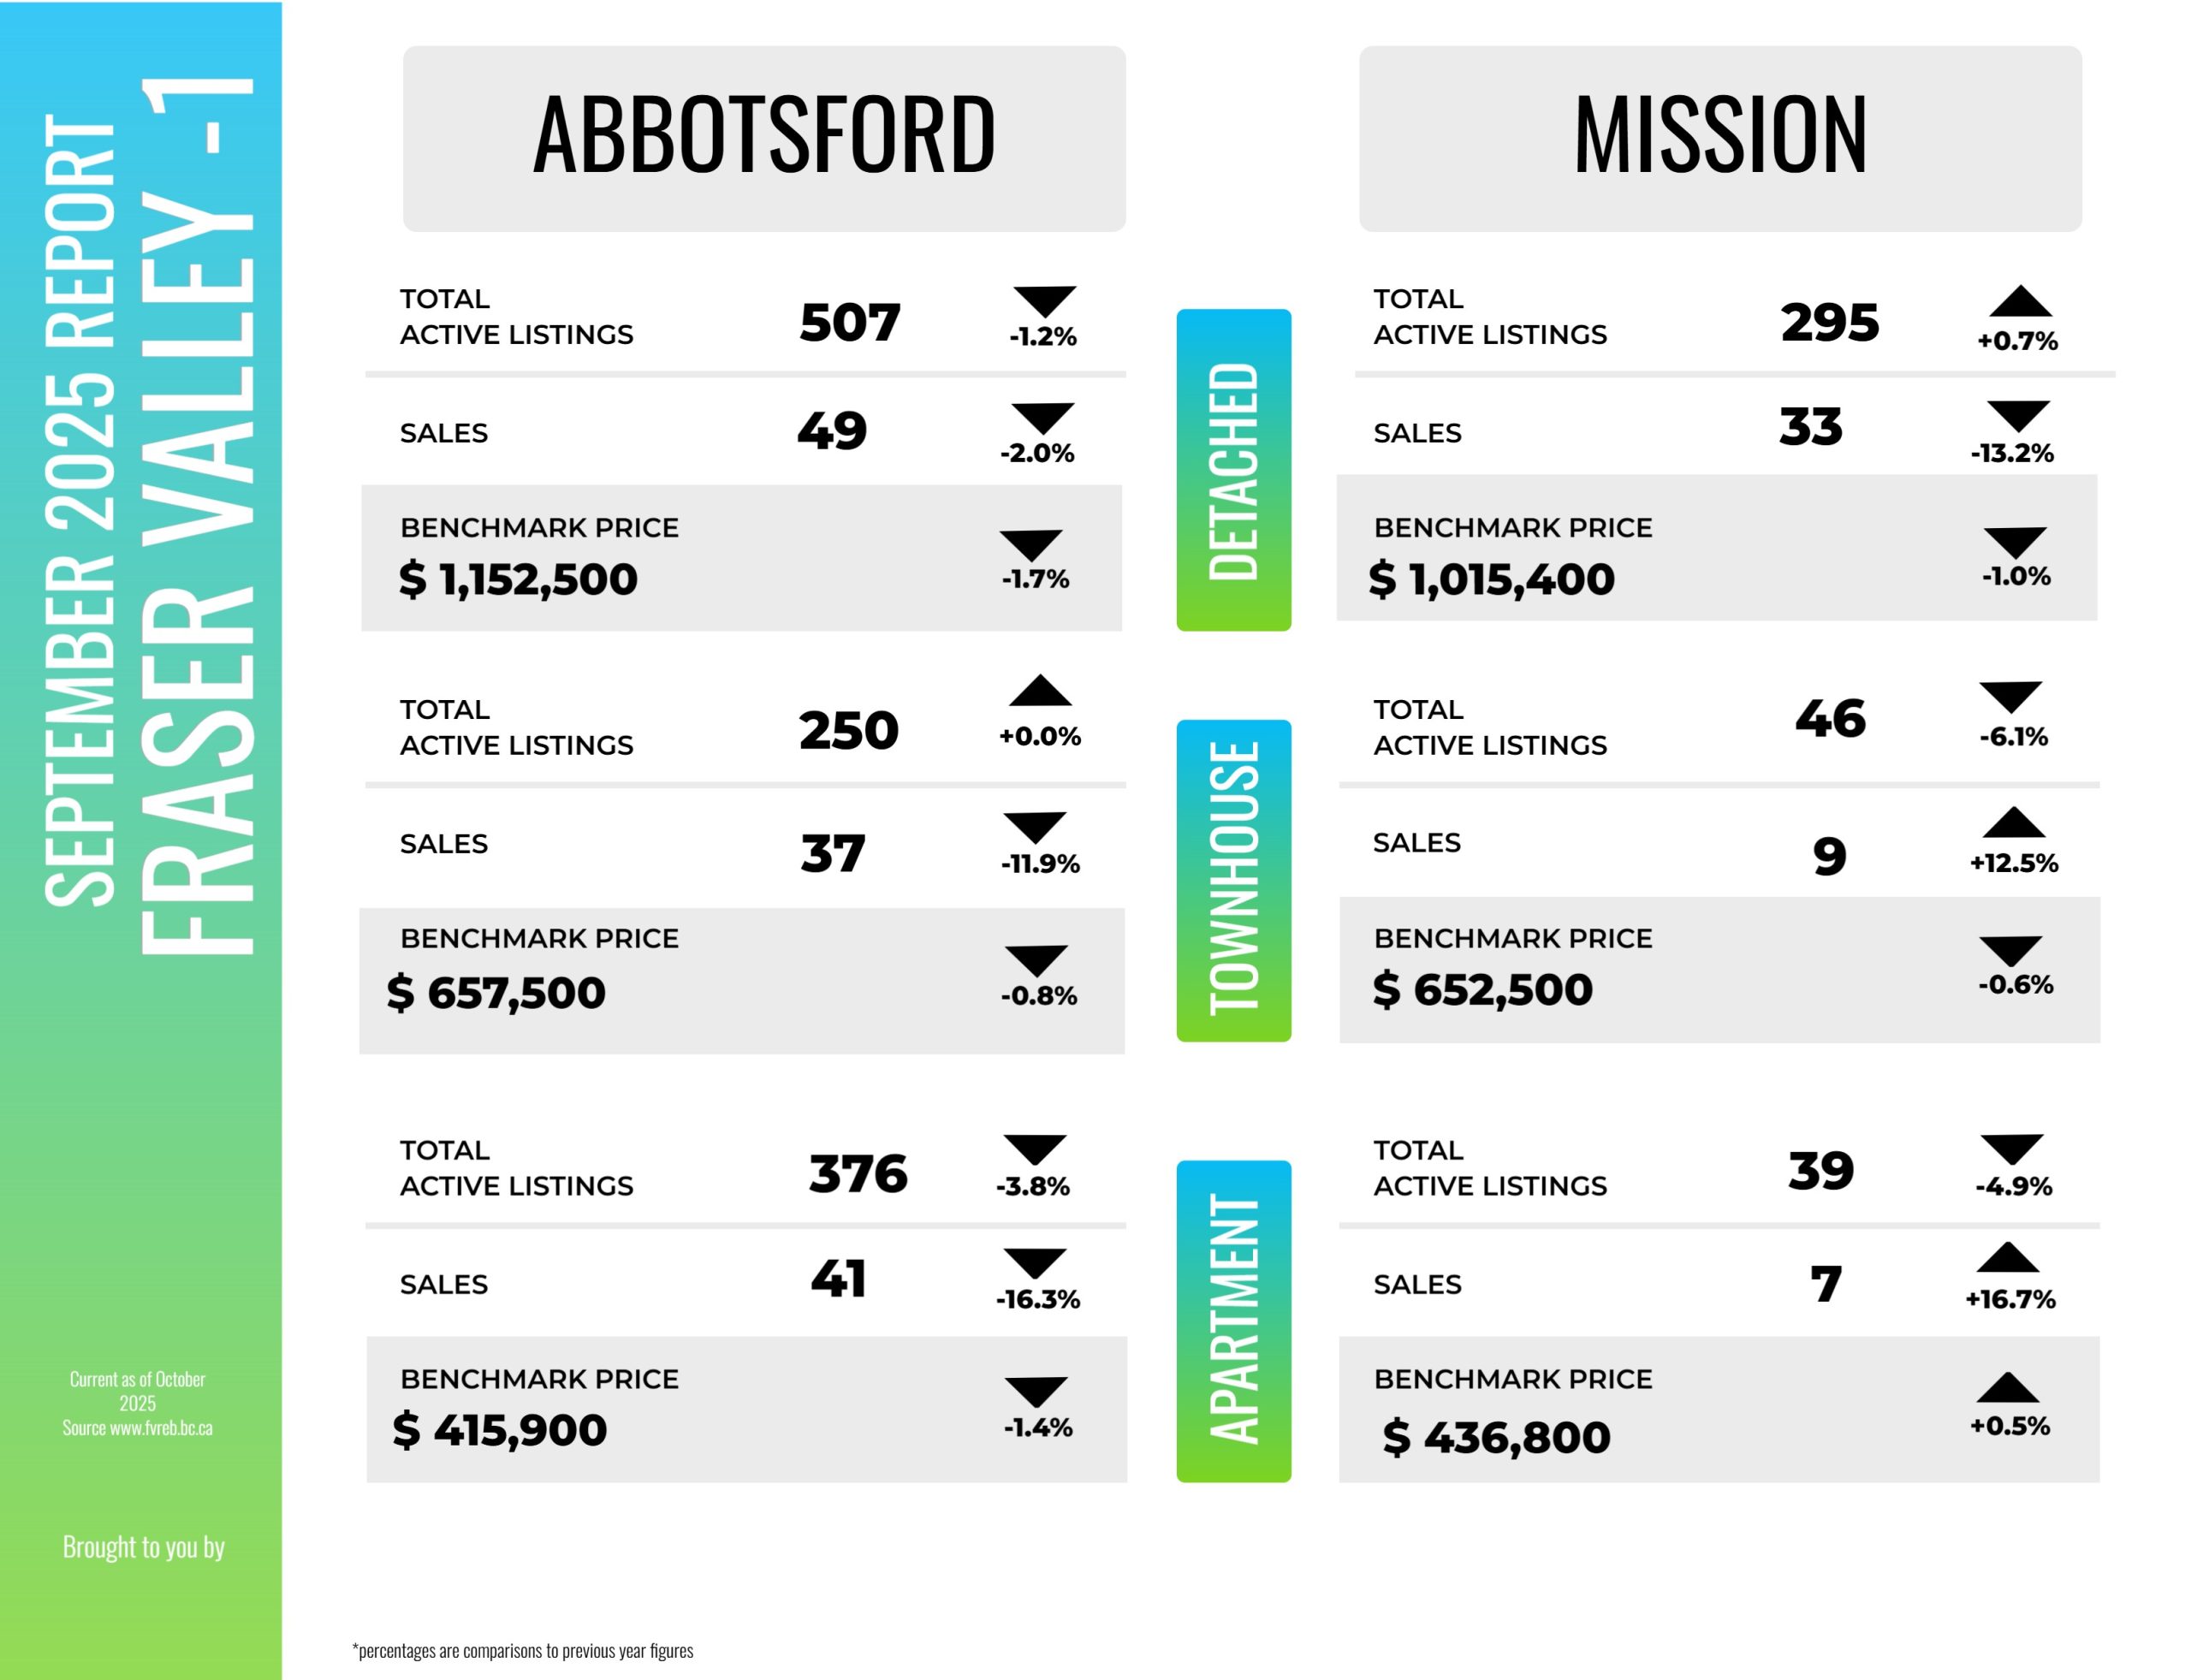
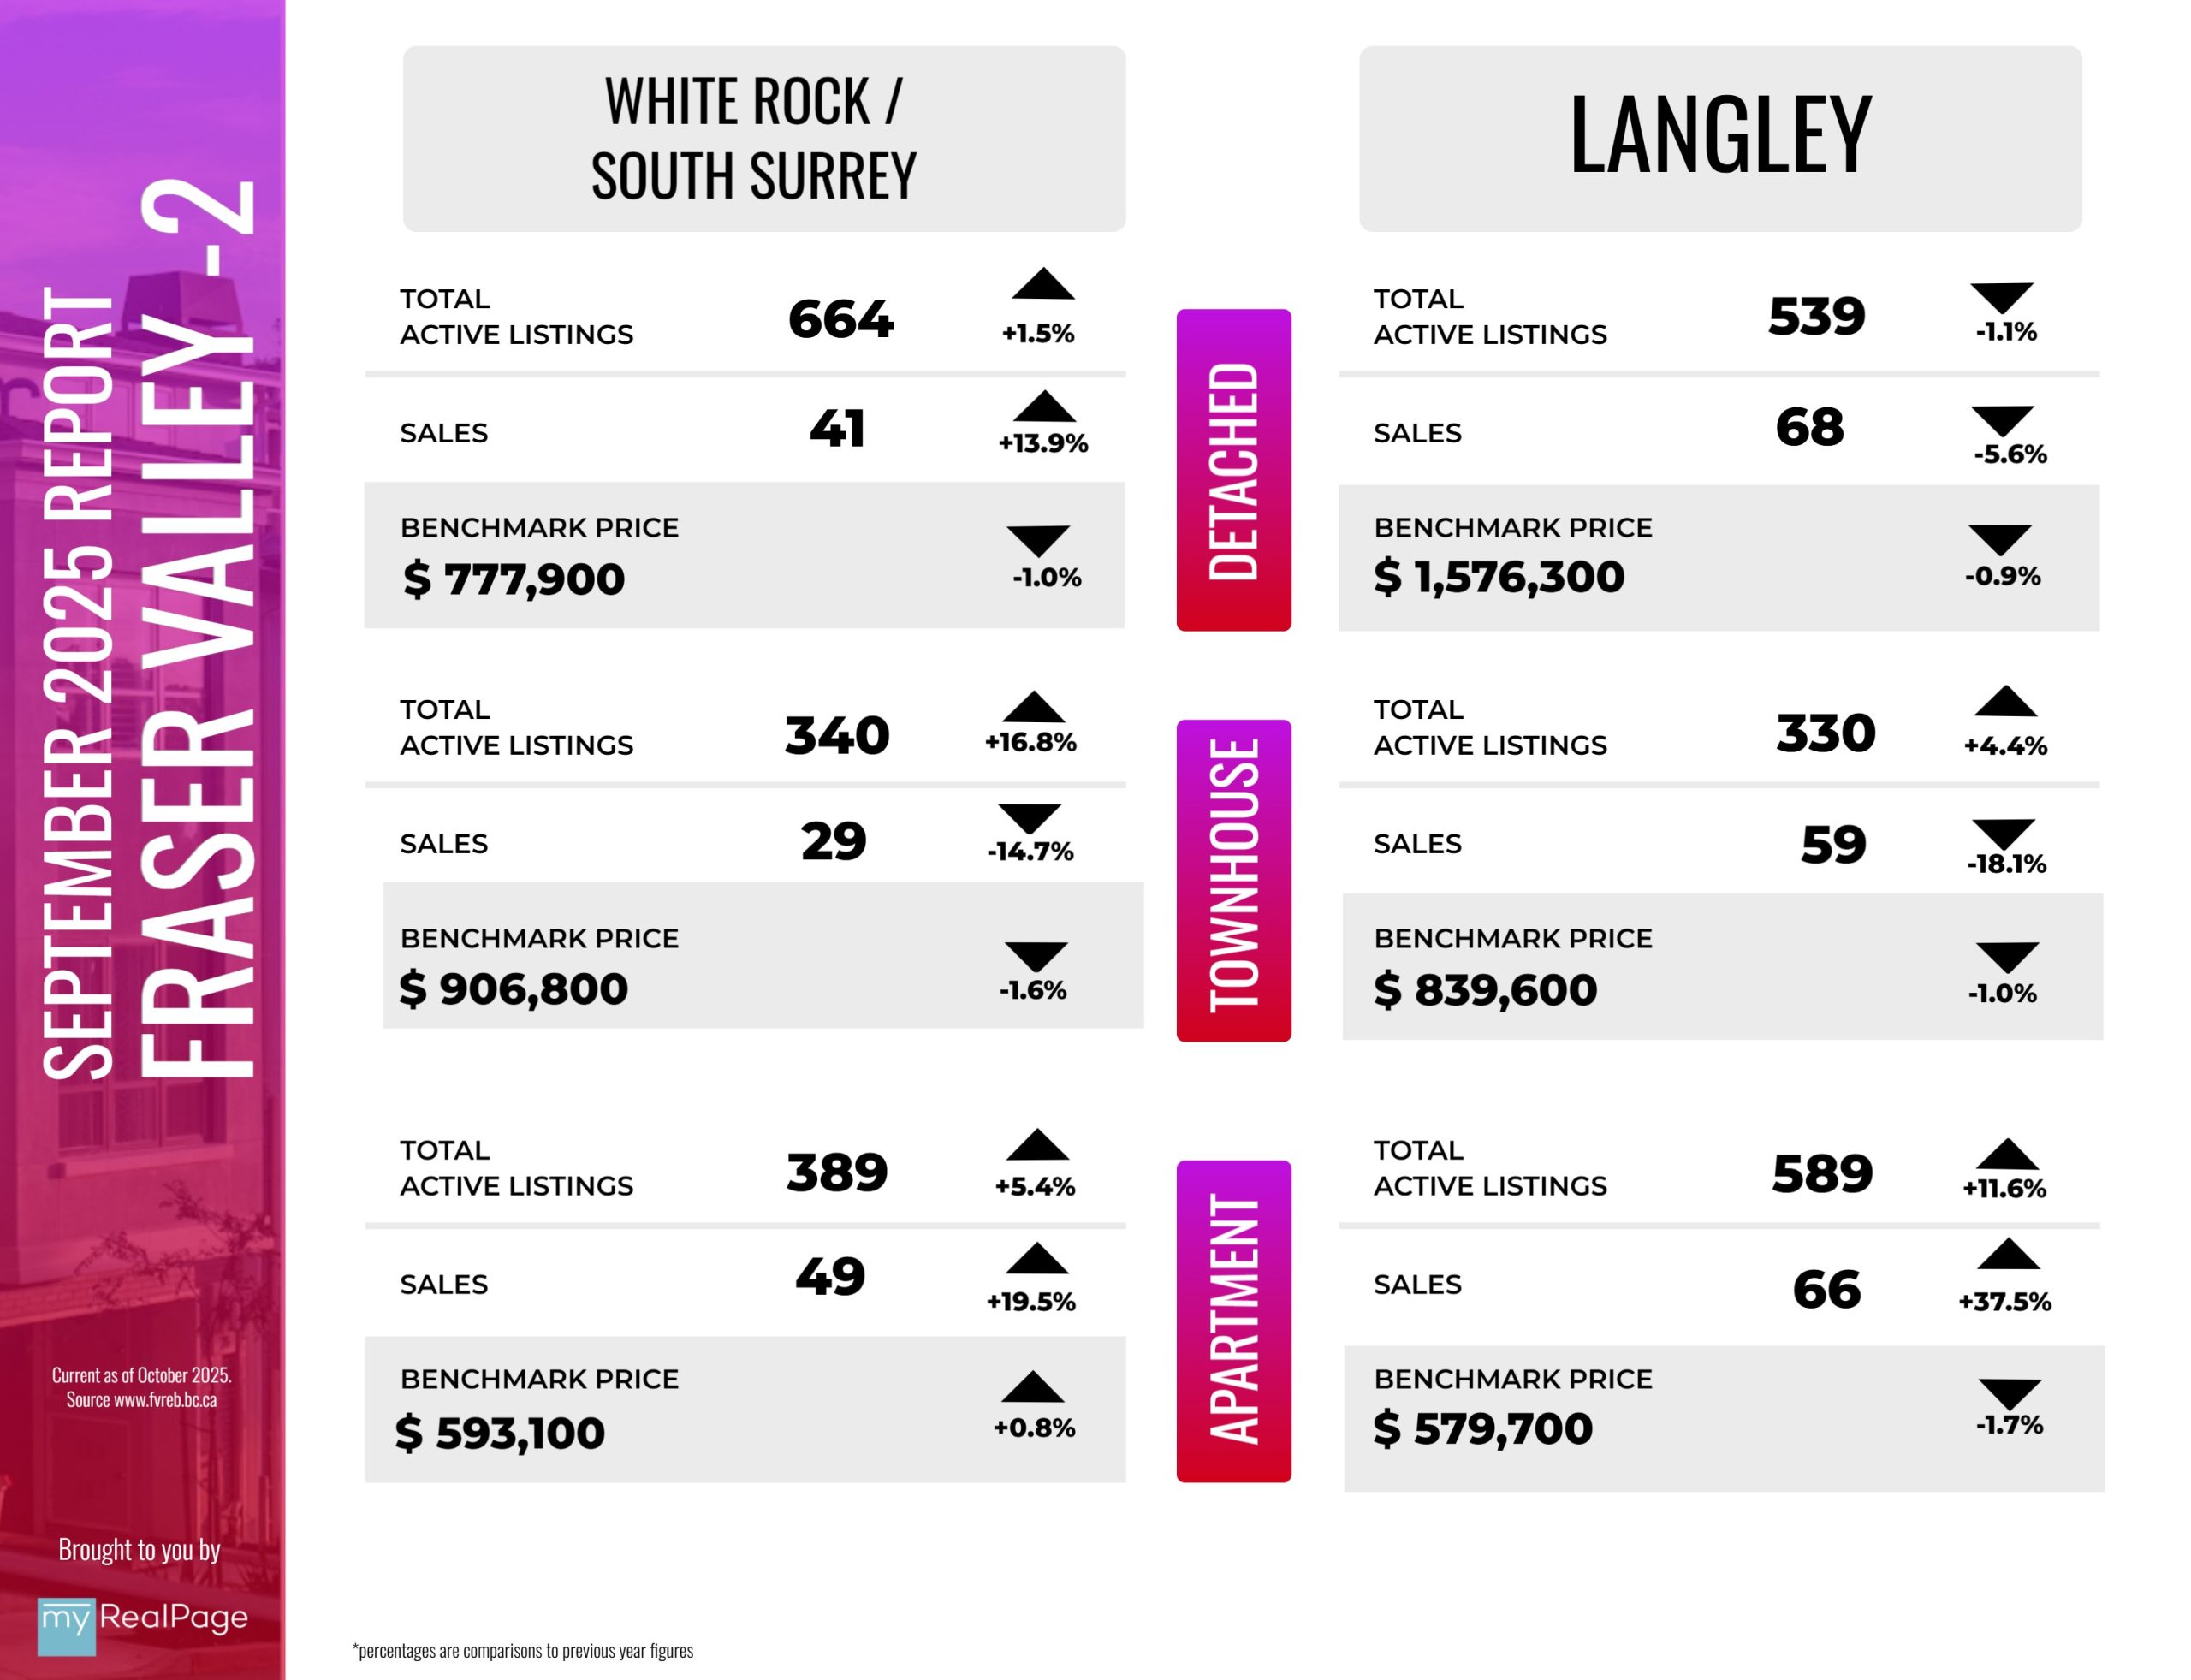
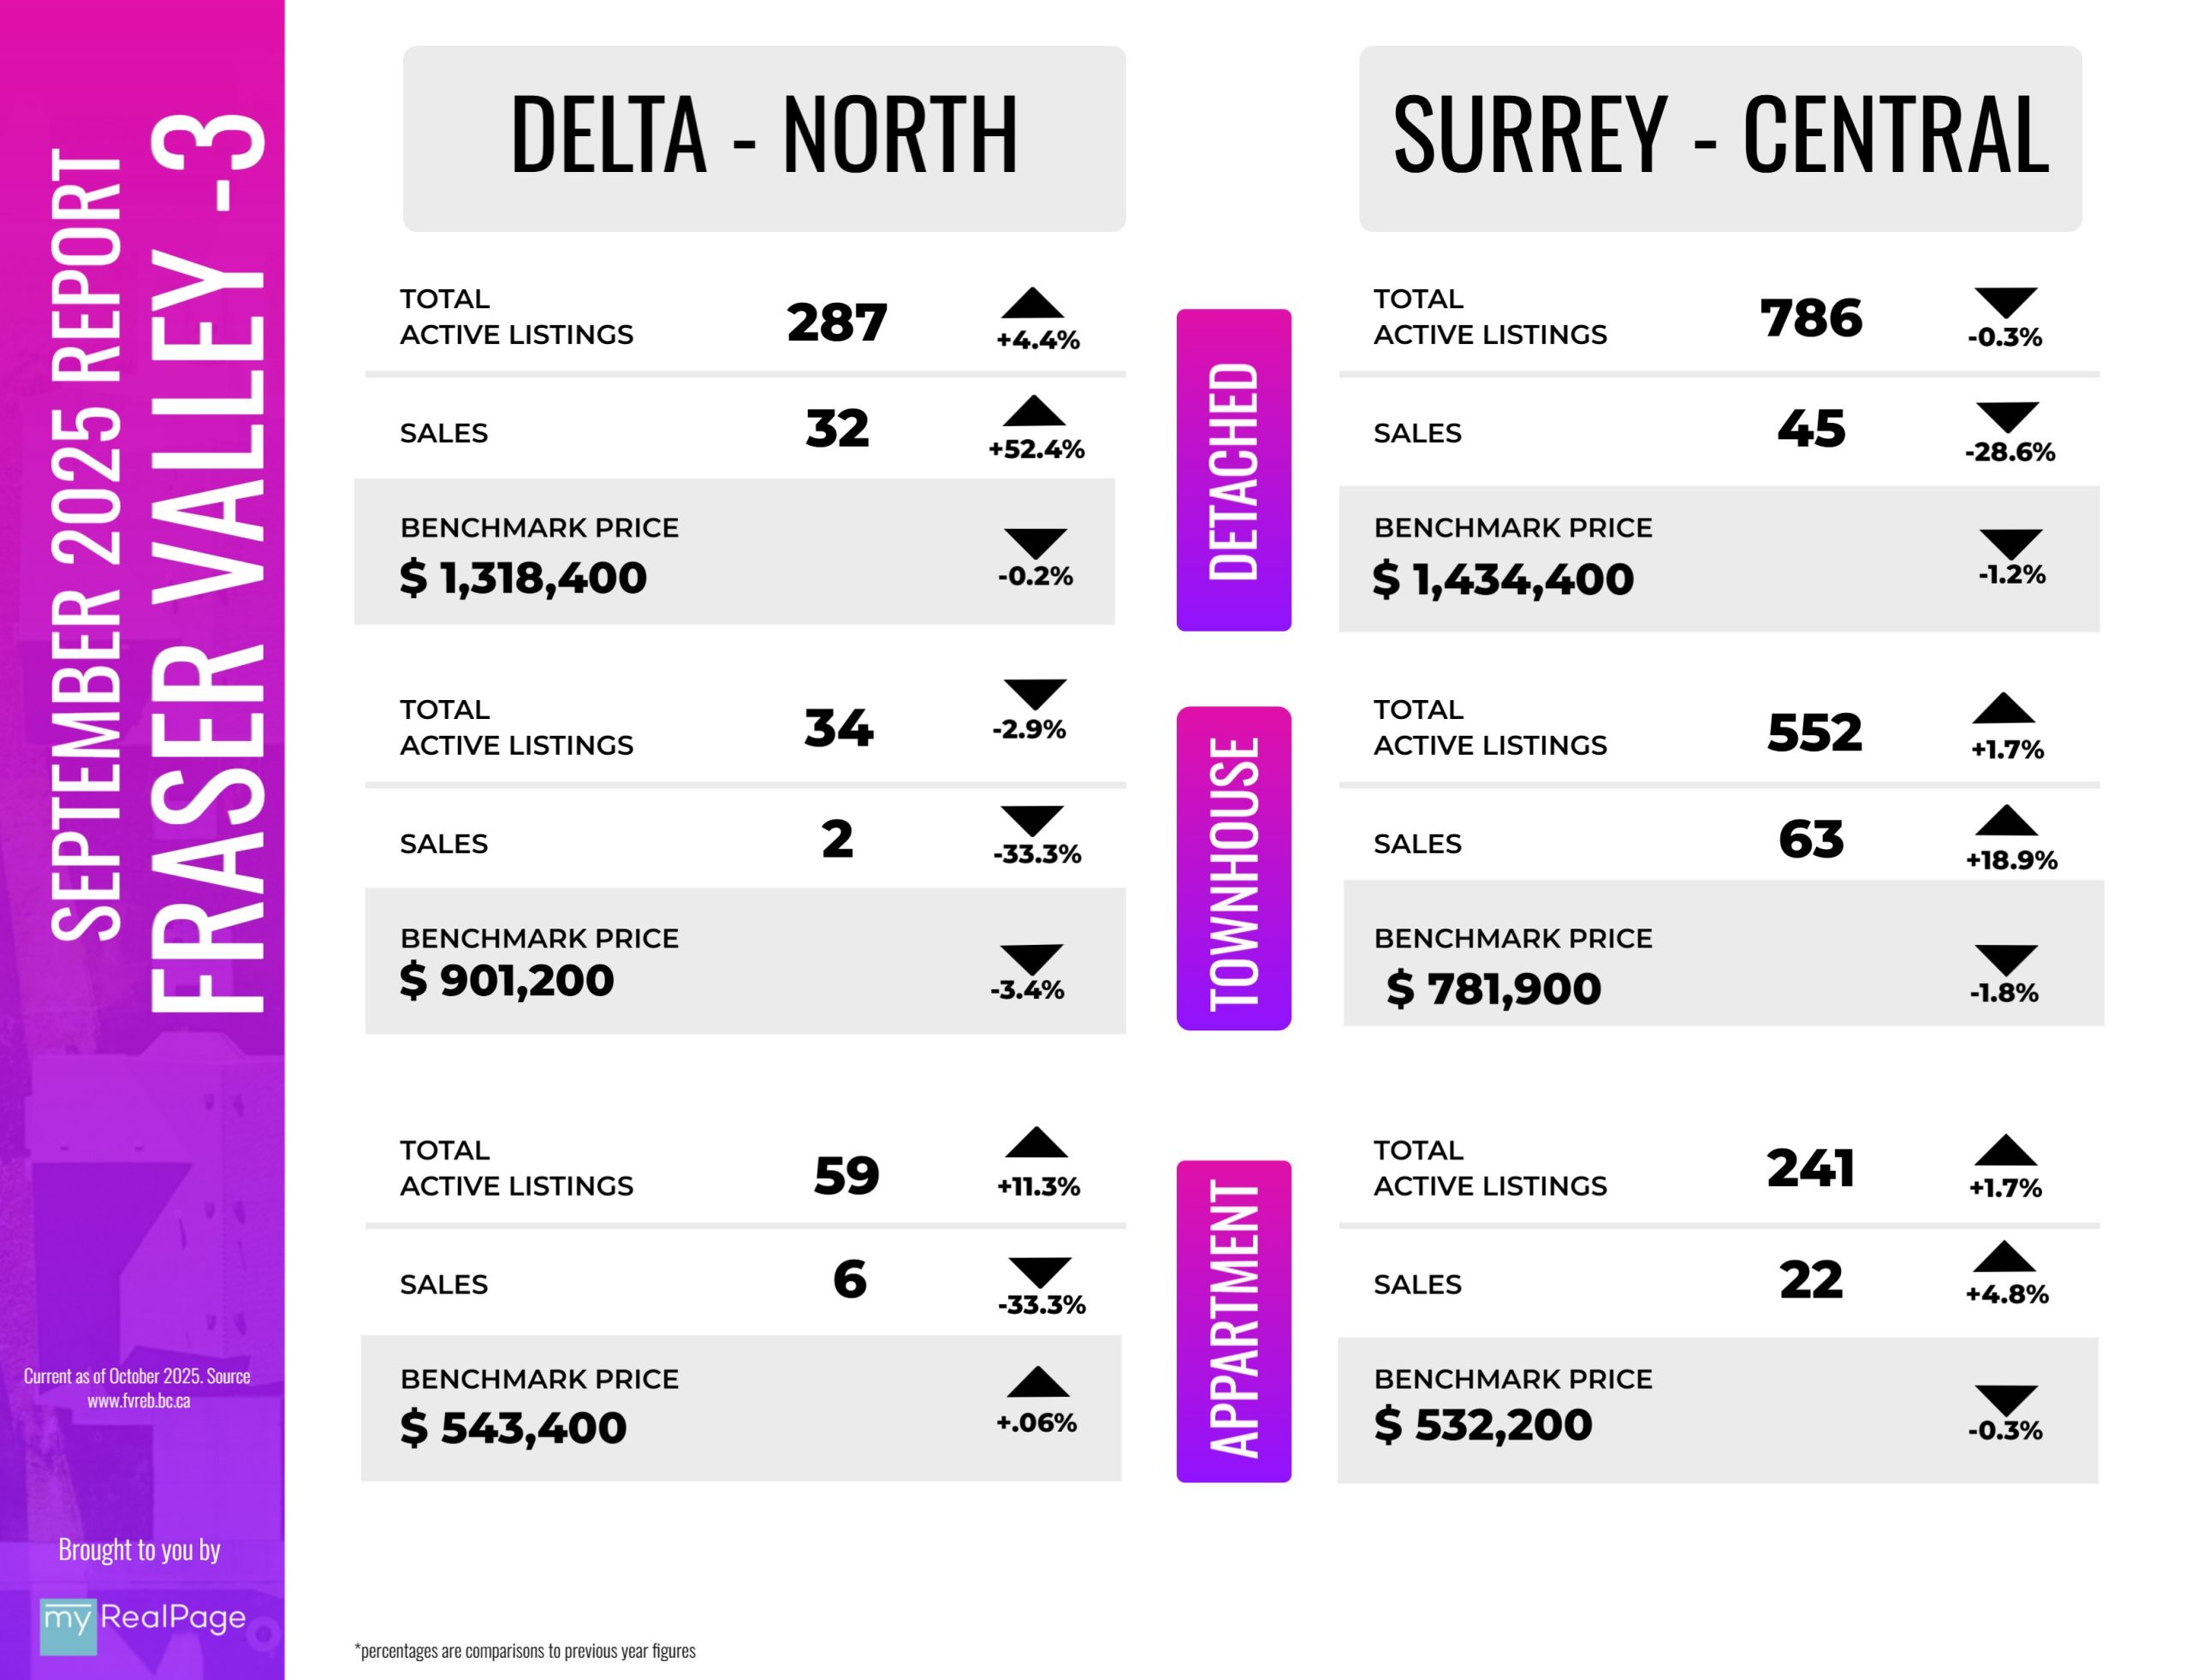
INFOGRAPHICS: September 2025 FVREB Fraser Valley Market Reports
Sustained elevated inventories soften Fraser Valley home prices further, spurring bump in sales
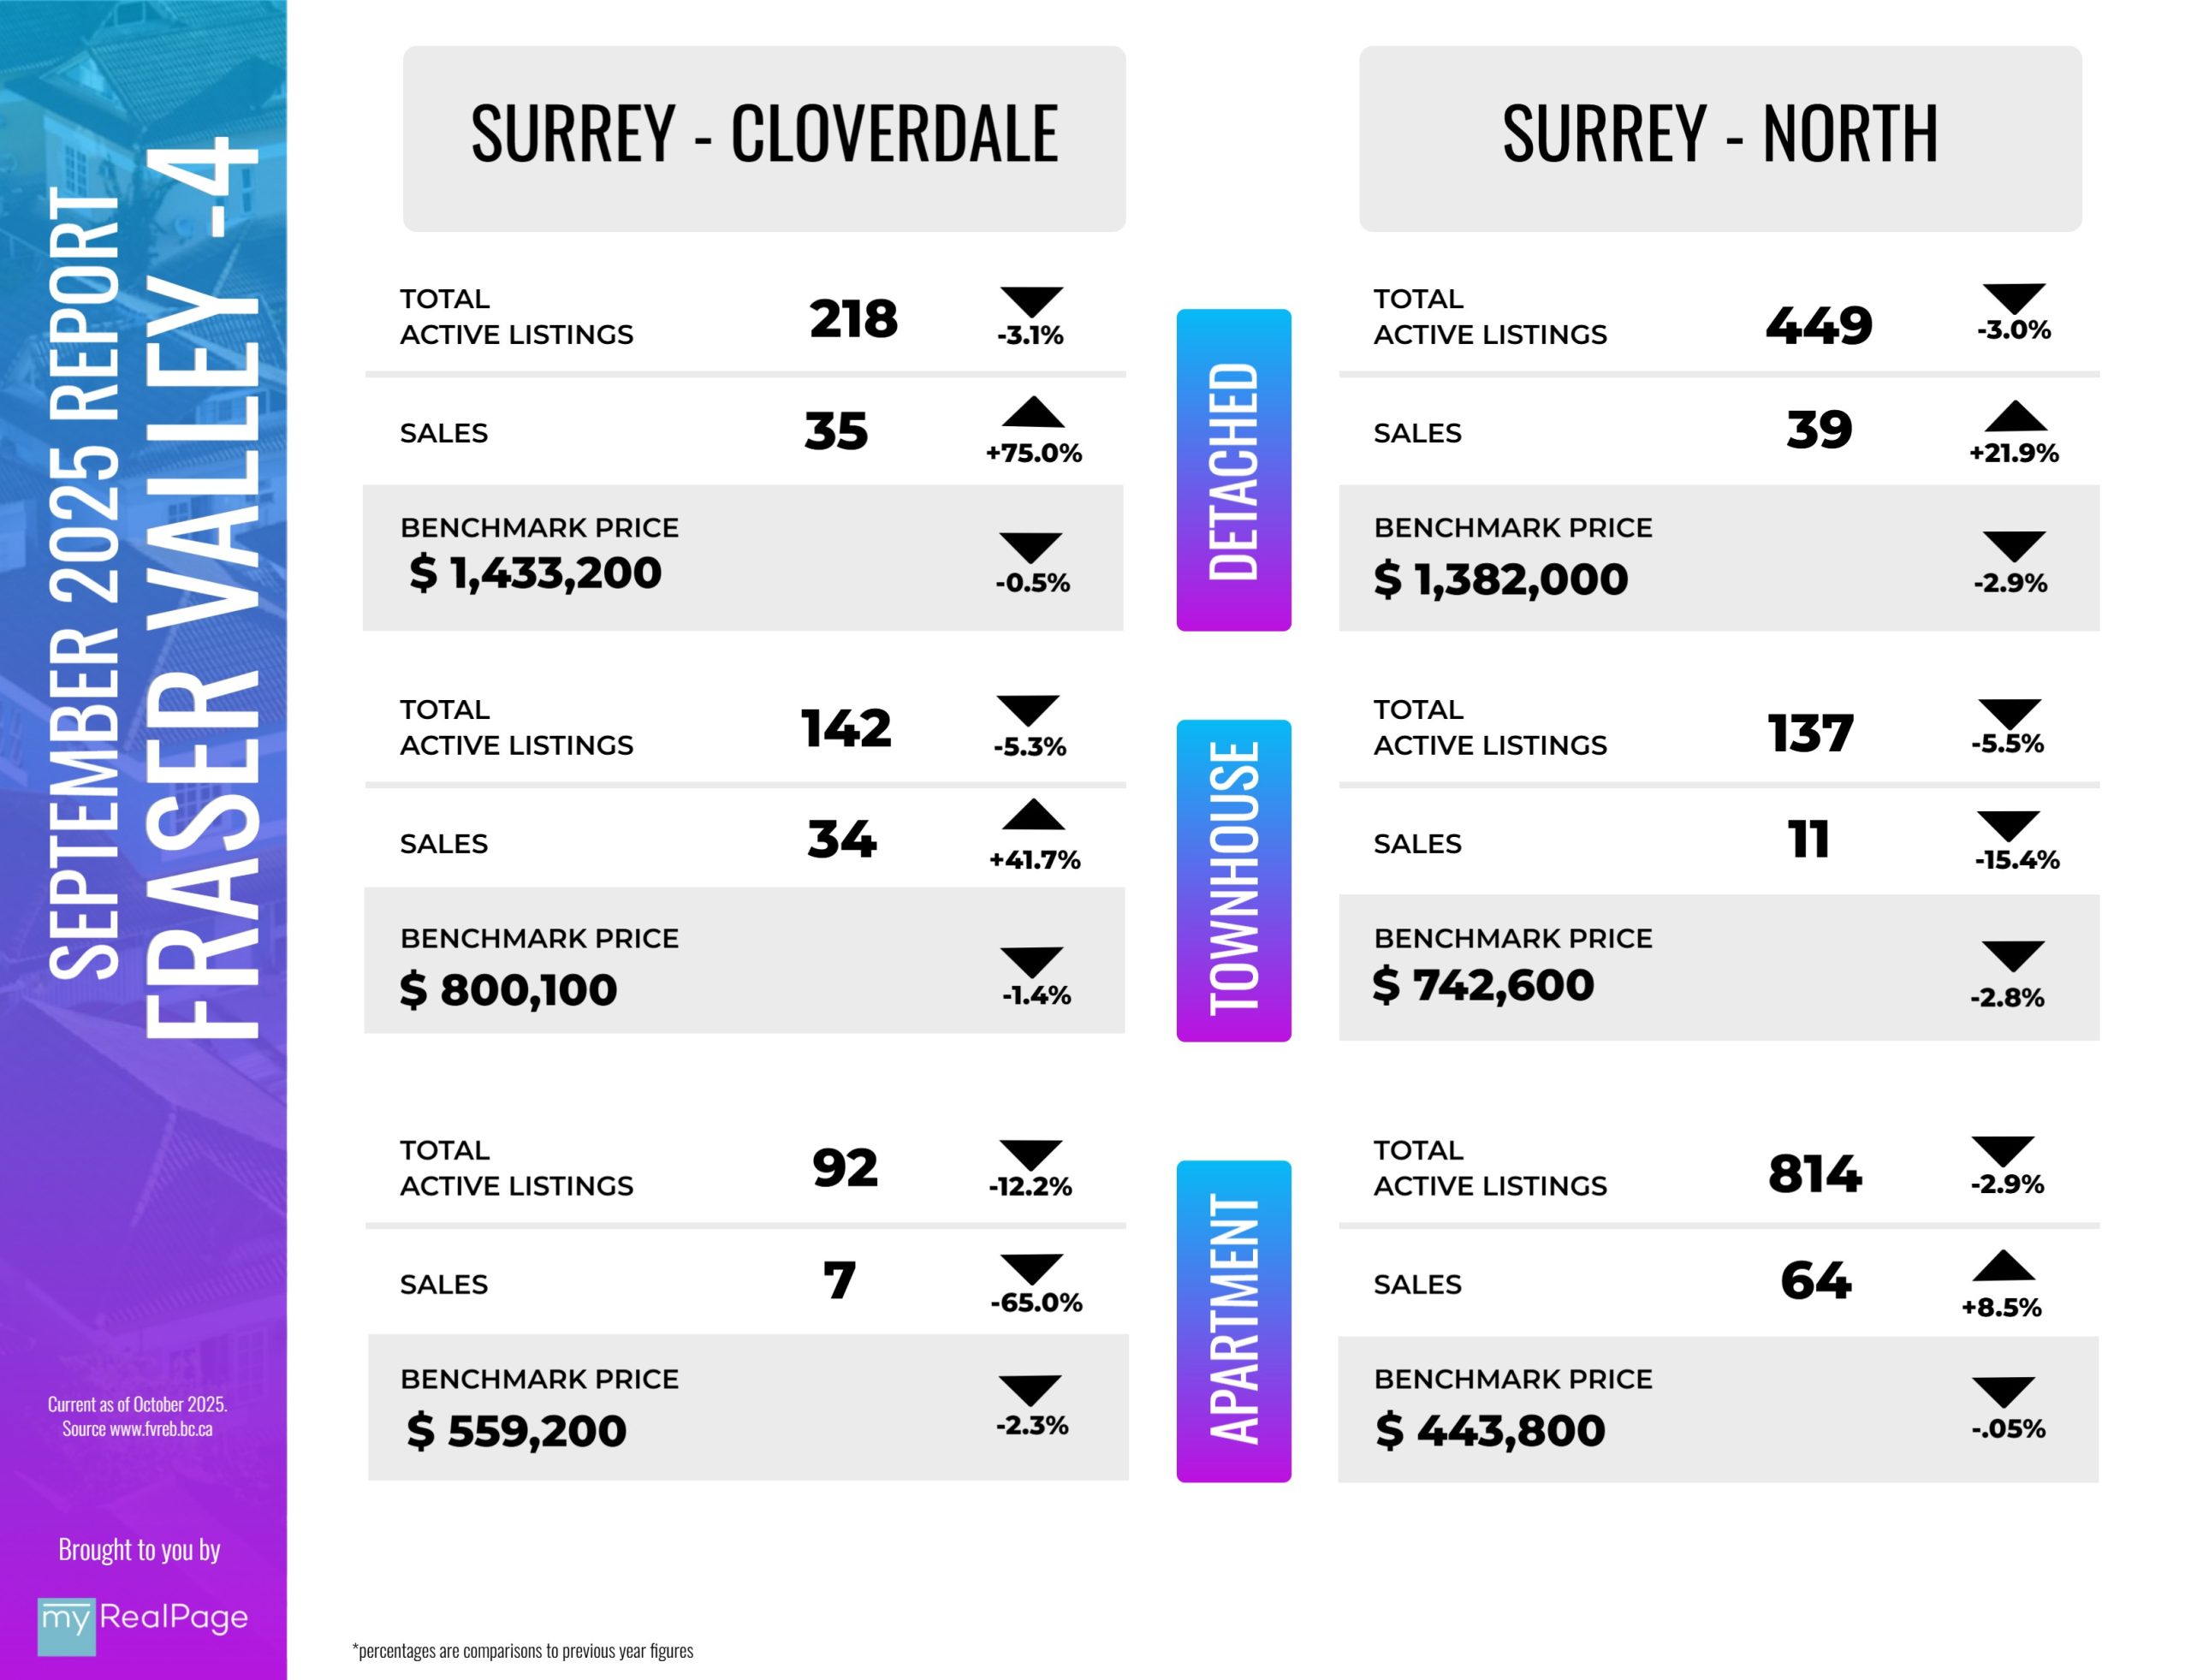
Home prices in the Fraser Valley continued their downward trend in September, marking the sixth straight month of declines, amid high inventory.
The Benchmark price for a typical home in the Fraser Valley dropped one per cent in September to $926,300, down 5.4 per cent year-over-year. The continued softening of prices may be encouraging some buyers back into the market, as the Fraser Valley Real Estate Board recorded 962 sales on its Multiple Listing Service® (MLS®) in September, an increase of three per cent over August. September sales were down two per cent year-over-year and 28 per cent below the 10-year average.
“As prices continue to weaken, the market is showing hopeful signs of renewed confidence,” said Tore Jacobsen, Chair of the Fraser Valley Real Estate Board. “While recent economic uncertainty seems to have weighed more heavily here in the Fraser Valley, some buyers are beginning to re-engage in the market, a positive signal heading into the fall.”
Read the full report on the FVREB website!
The following data is a comparison between September 2025 and September 2024 numbers, and is current as of October of 2025. For last month’s report, check out our previous infographic!
Or follow this link for all our FVREB Infographics!
These infographics cover current trends in Fraser Valley neighbourhoods that are within the FVREB. Click on the images for a larger view!
Download Printable Version – FVREB September 2025 Market Report
Last Updated on October 10, 2025 by myRealPage
