INFOGRAPHICS: January 2026 TRREB Toronto Market Reports

GTA REALTORS Release January Stats
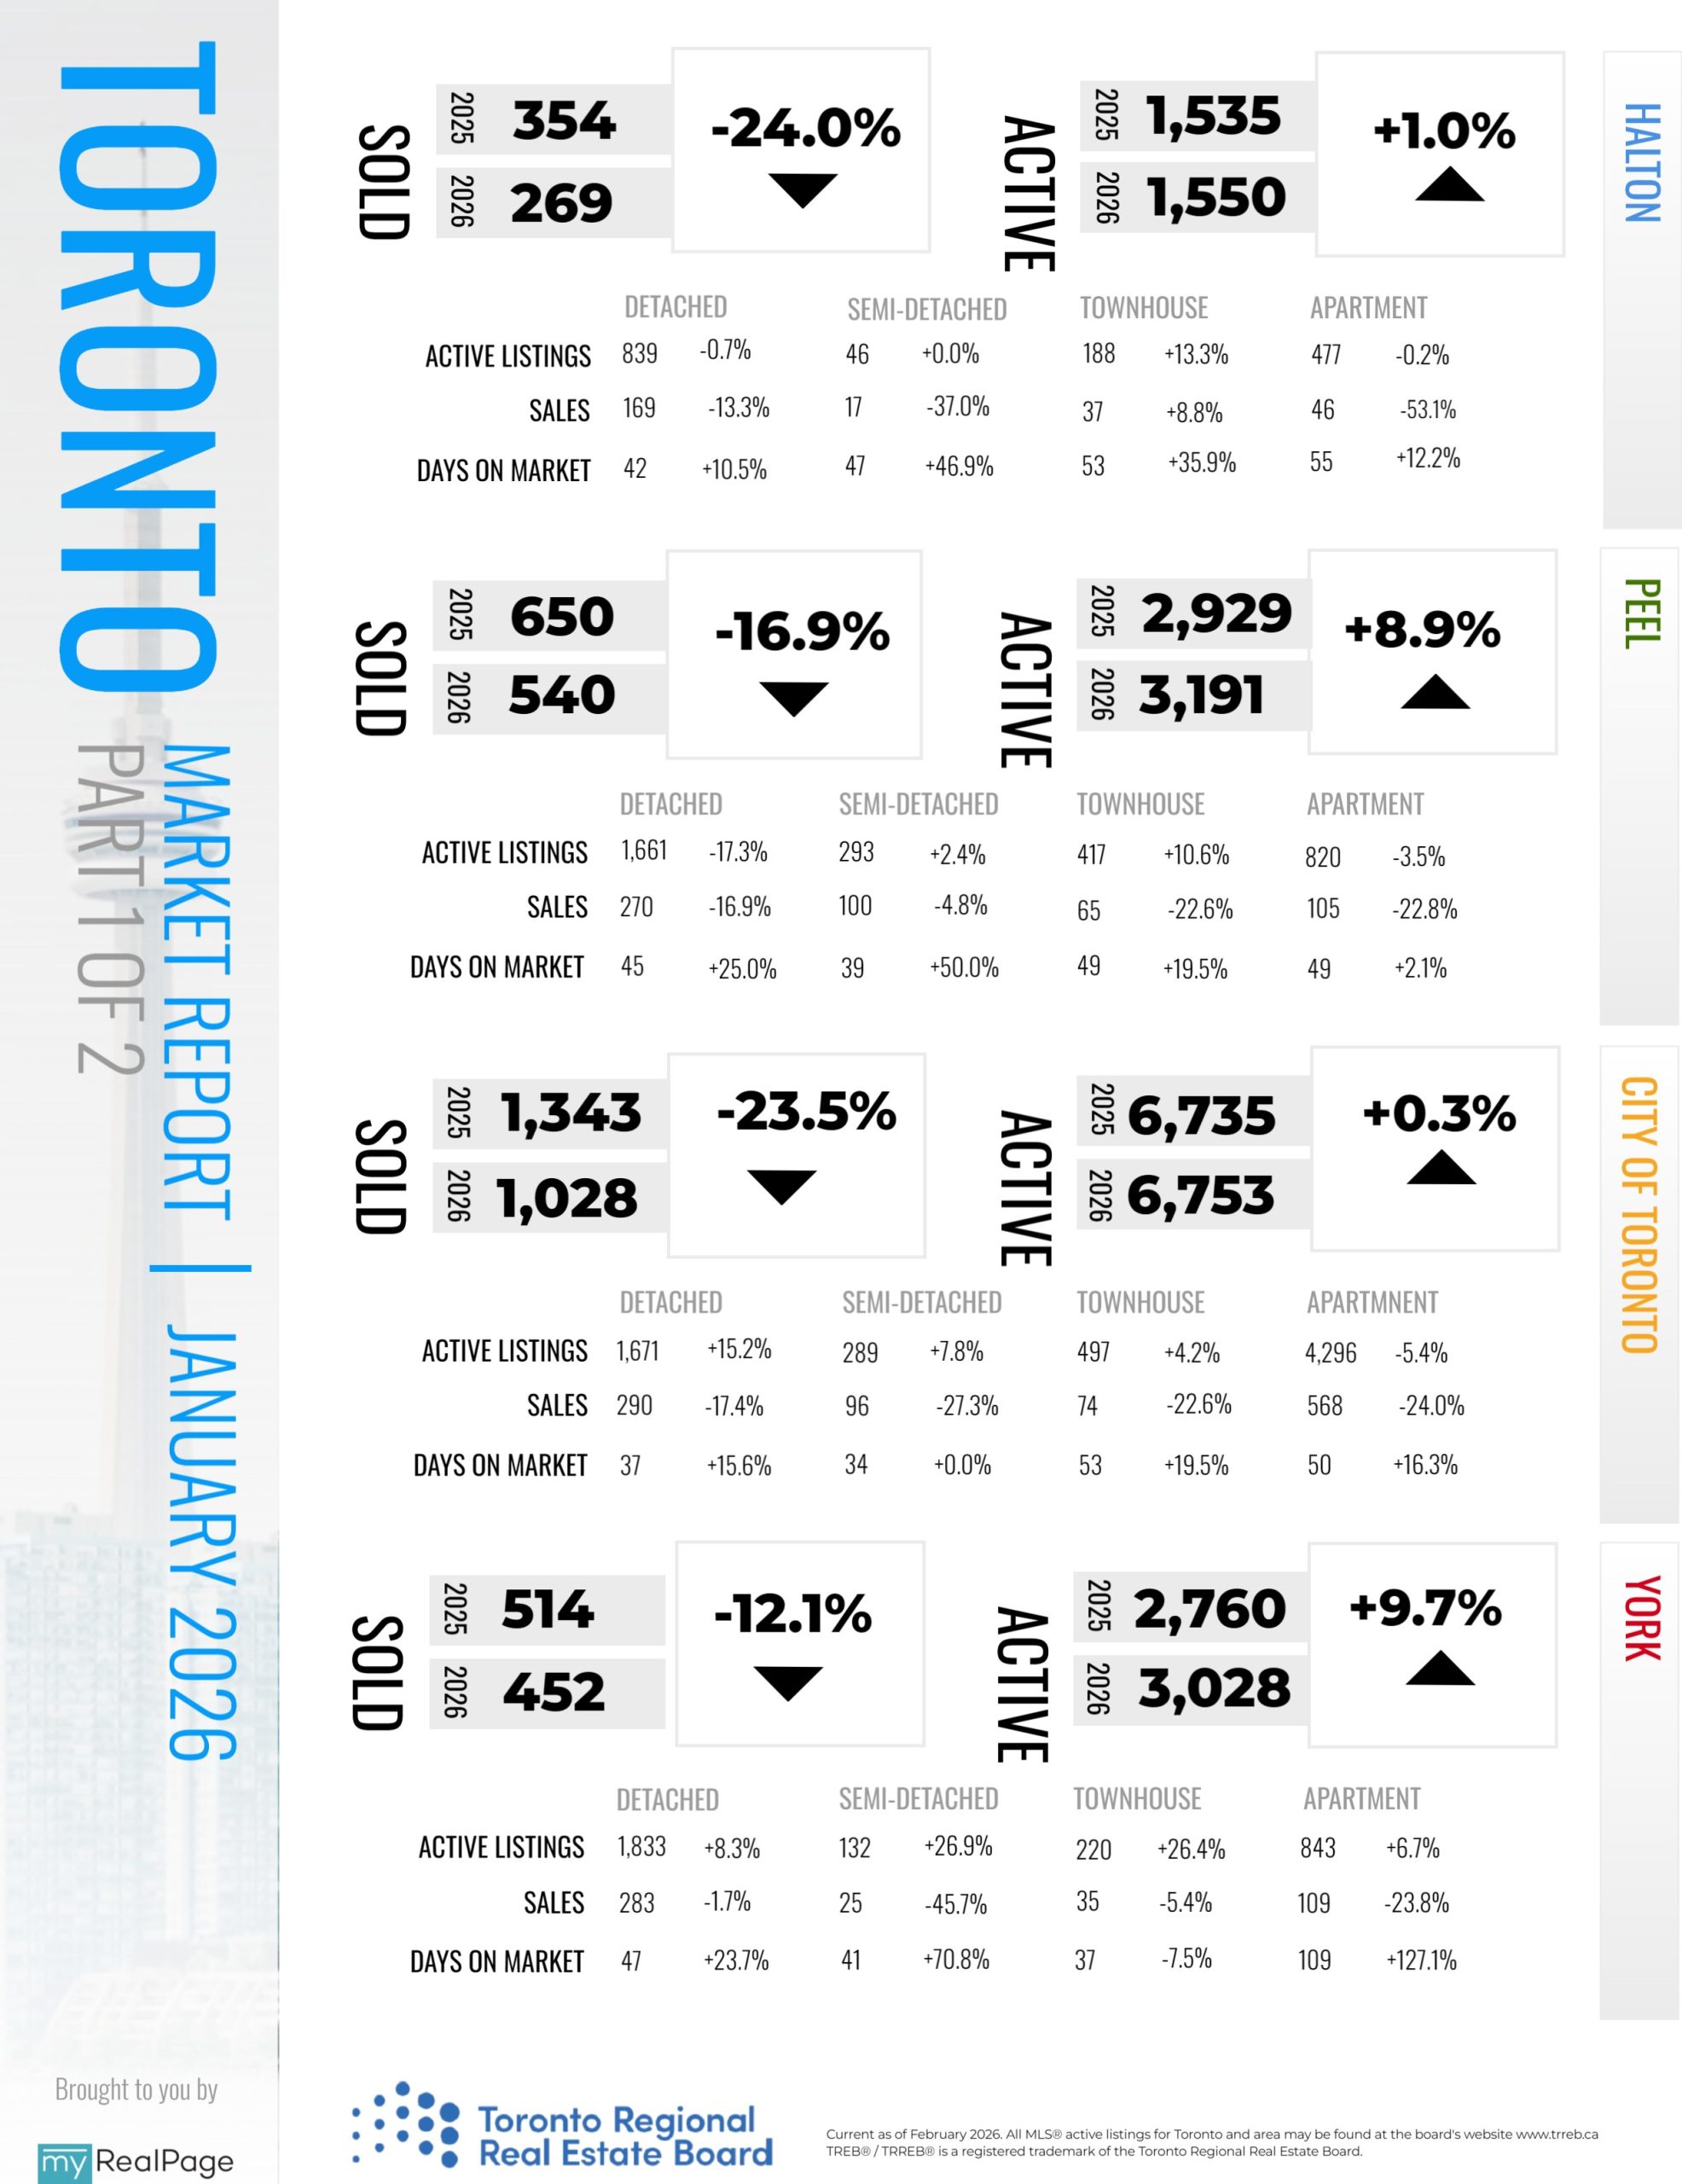
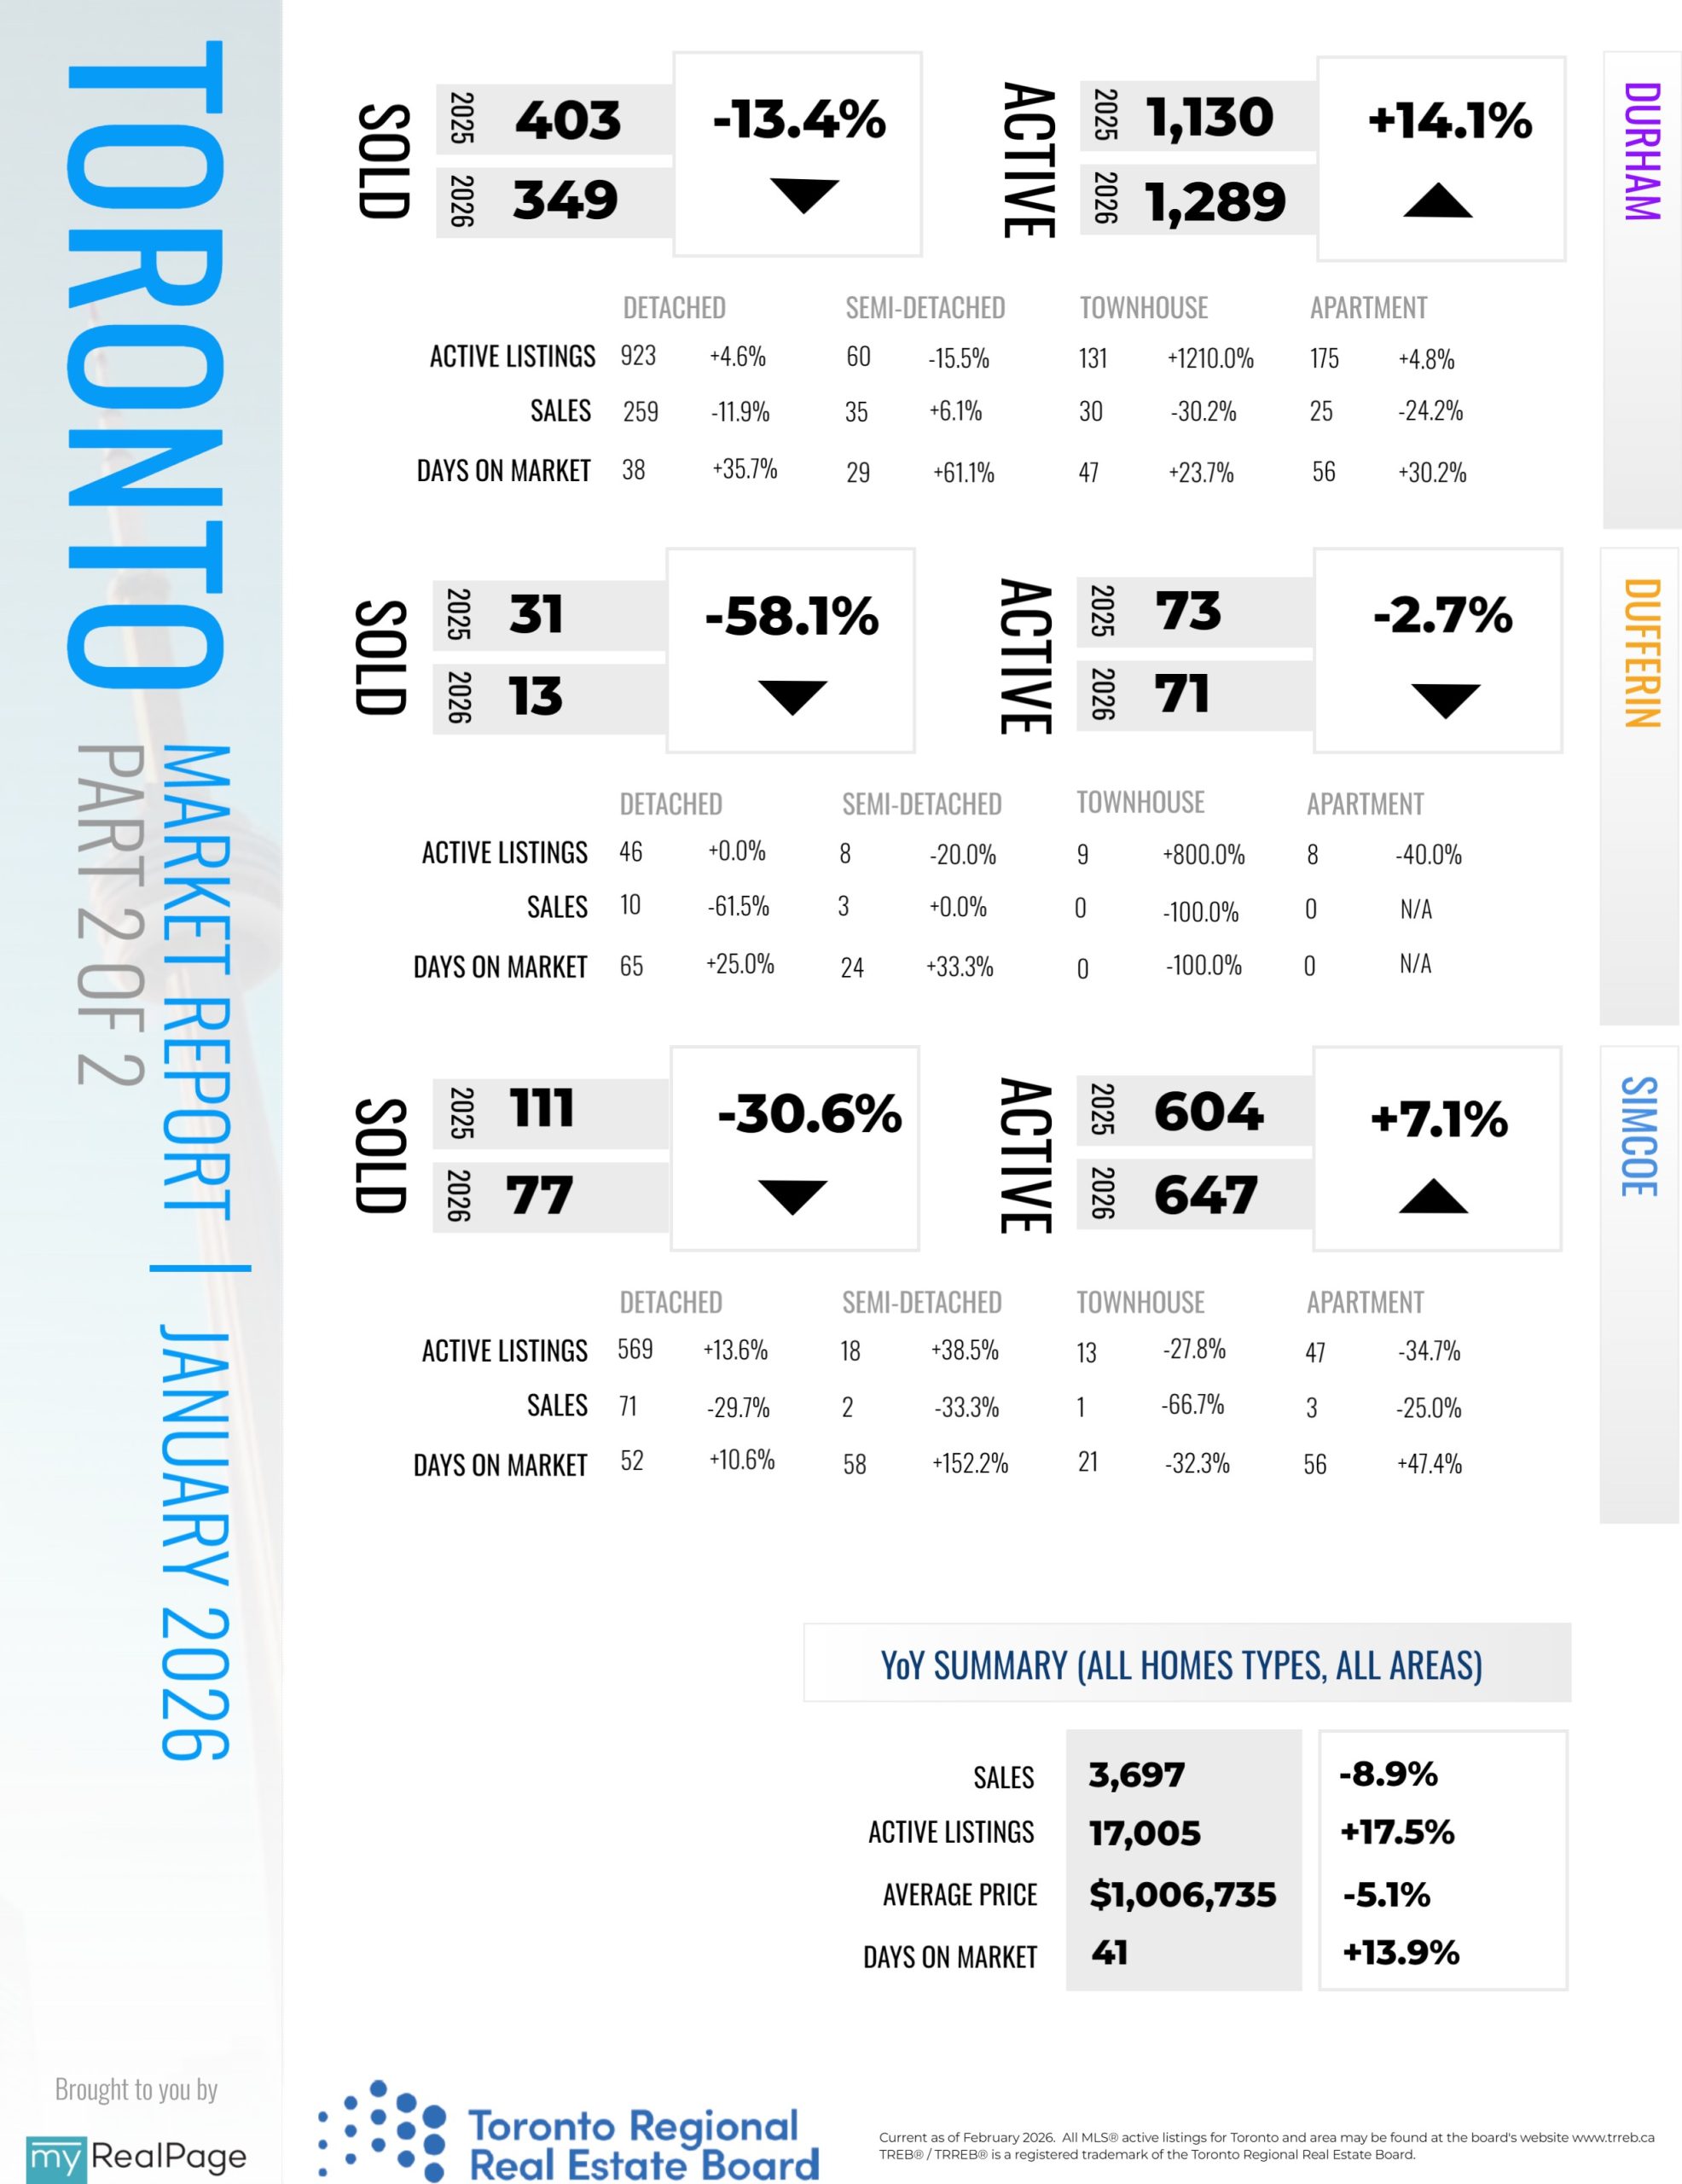
There were 3,082 home sales reported in January 2026 – down by 19.3 per cent compared to January 2025. New listings entered into the MLS® System amounted to 10,774 – down by 13.3 per cent yearover-year. The MLS® Home Price Index (MLS® HPI) Composite benchmark was down by eight per cent yearover-year in January 2026. The average selling price, at $973,289, was down by 6.5 per cent compared to January 2025.
On a seasonally adjusted basis, January 2026 home sales were down month-over-month compared to December 2025, while new listings were up slightly. Both the MLS® HPI composite and average price trended lower compared to December.
The 2026 TRREB Market Outlook and Year in Review Report is now available. The report covers all aspects of the GTA real estate market, including trends for new homes and condominiums, as well as a review of the commercial real estate market.
Read the full report on TRREB website!
The following data is a comparison between January 2025 and January 2026 numbers, and is current as of February of 2026. For last month’s numbers, check out our previous infographic!
Or follow this link for all our TREB / TRREB Infographics!
Download Printable Version – January 2026 TRREB, Toronto Market Report
Last Updated on February 9, 2026 by myRealPage
