INFOGRAPHICS: March 2026 CREB City And Region Market Reports

Trends differ based on property type
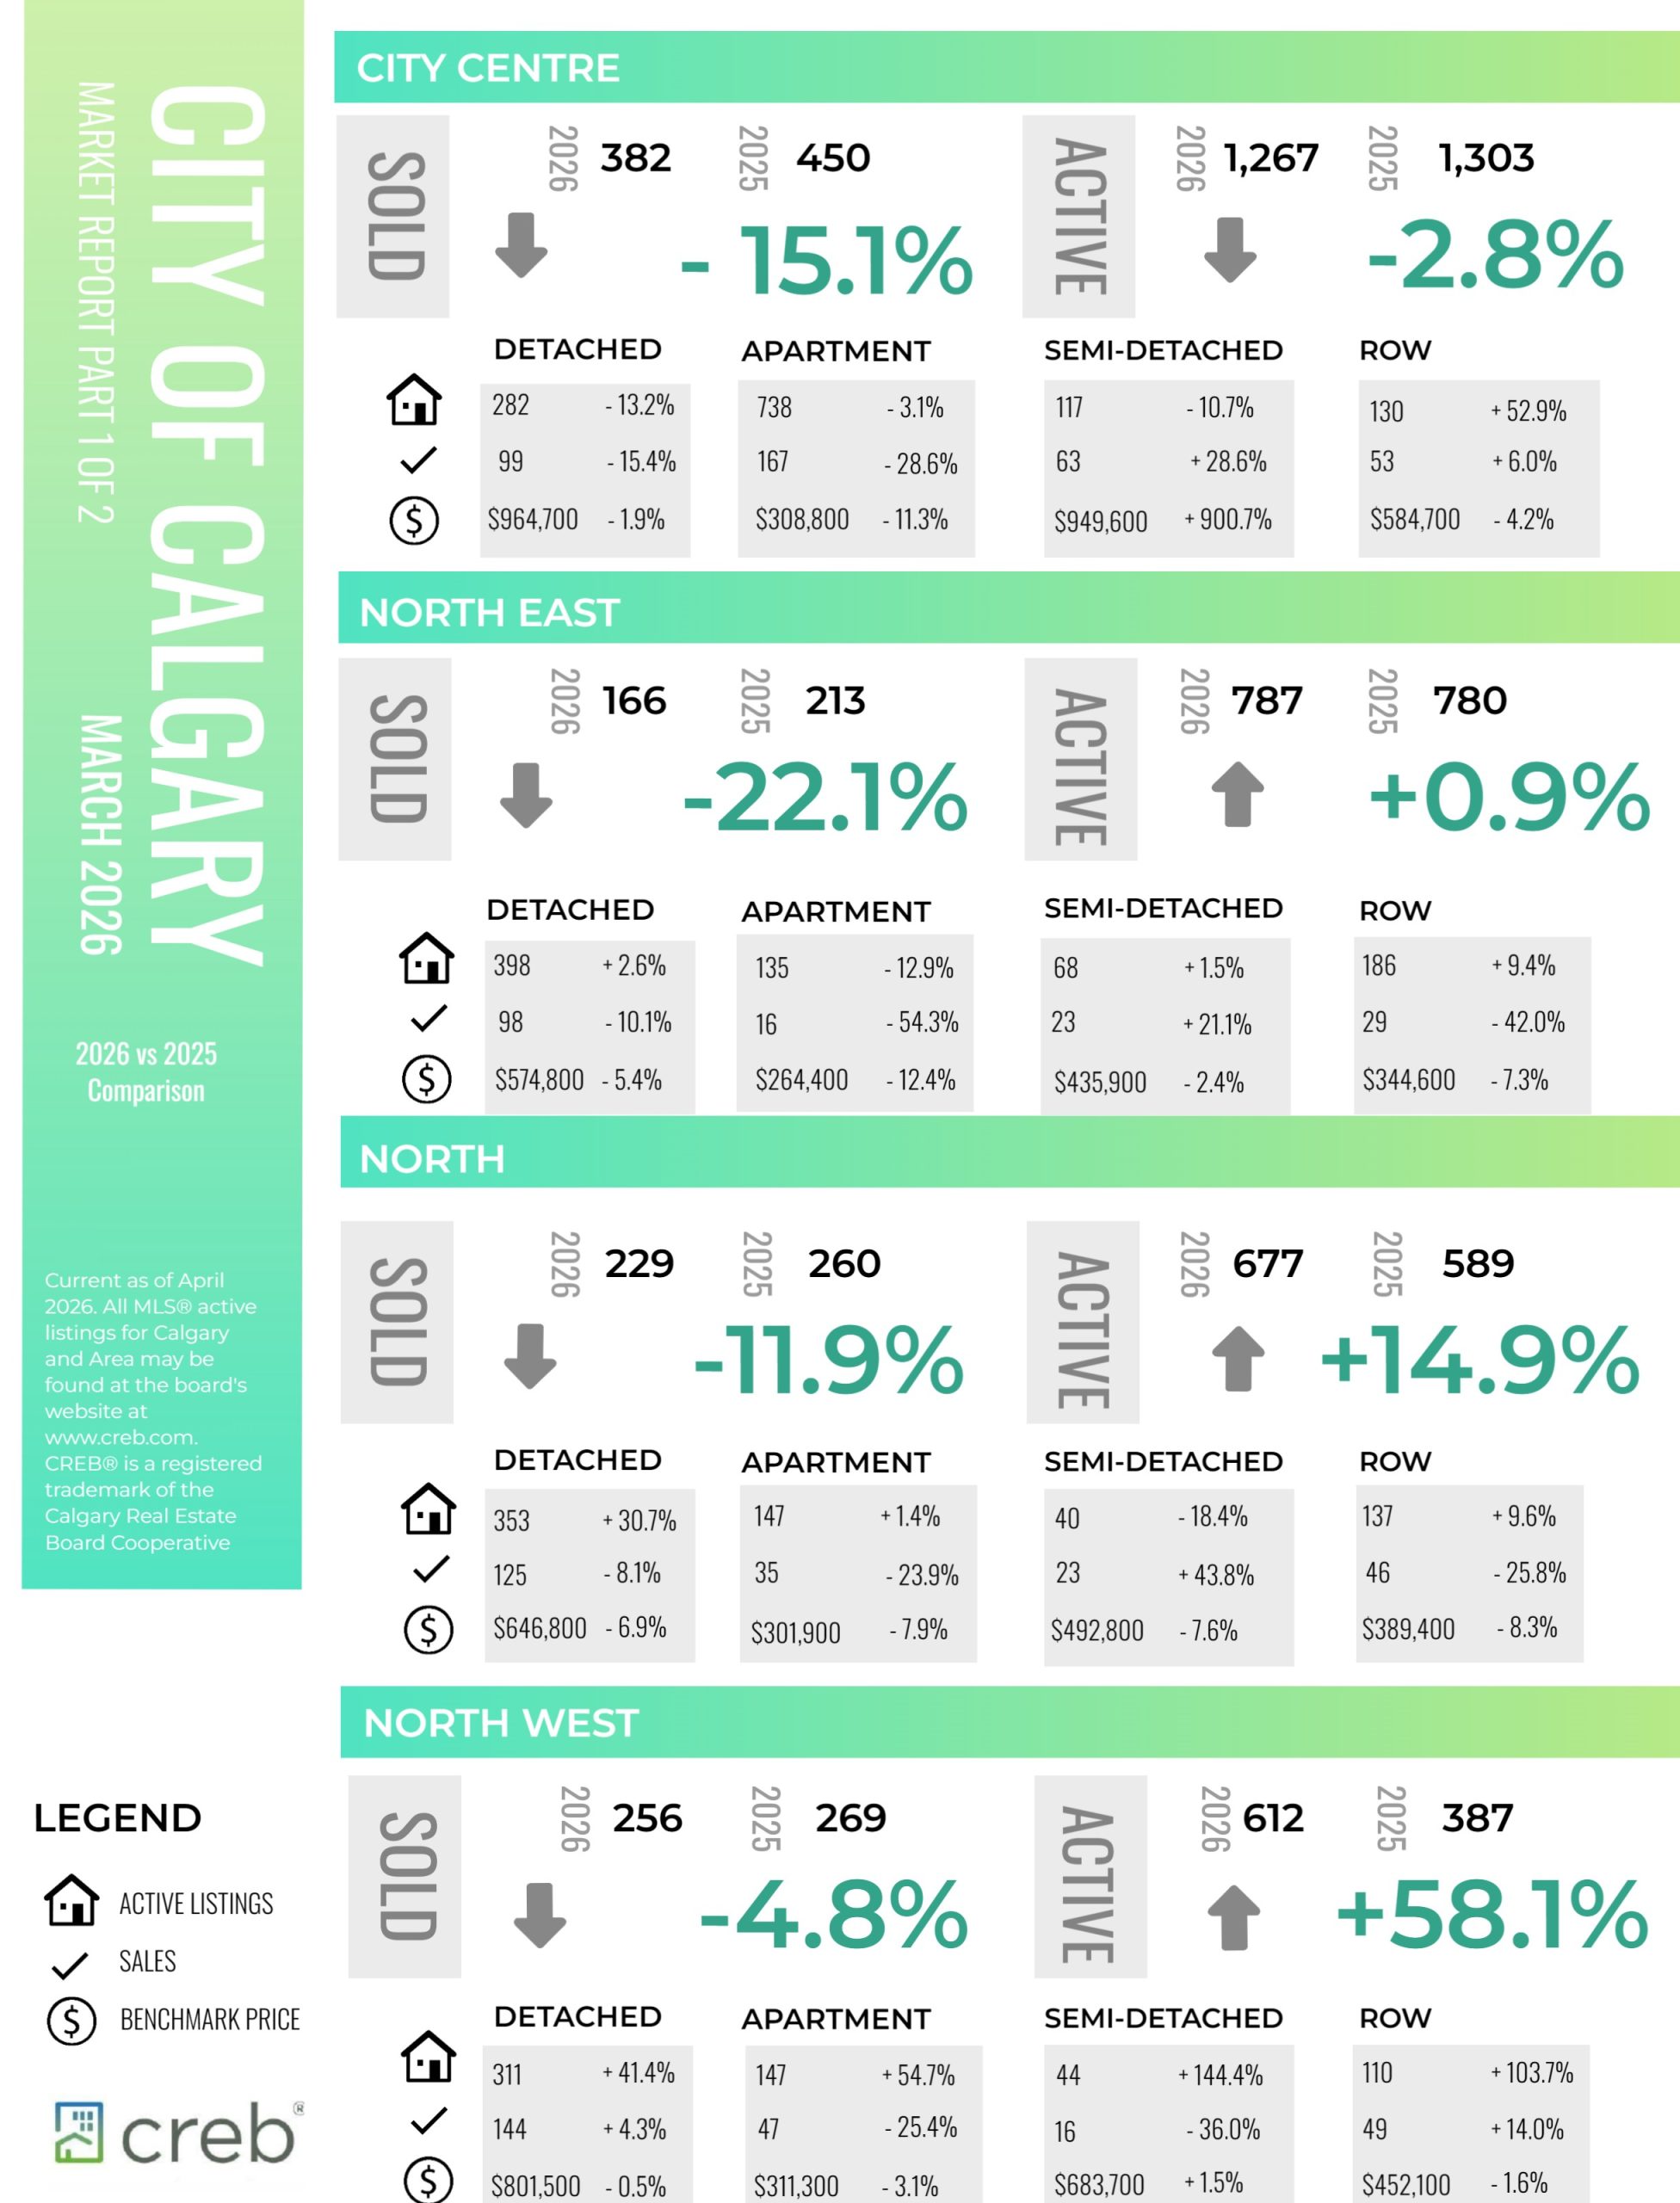
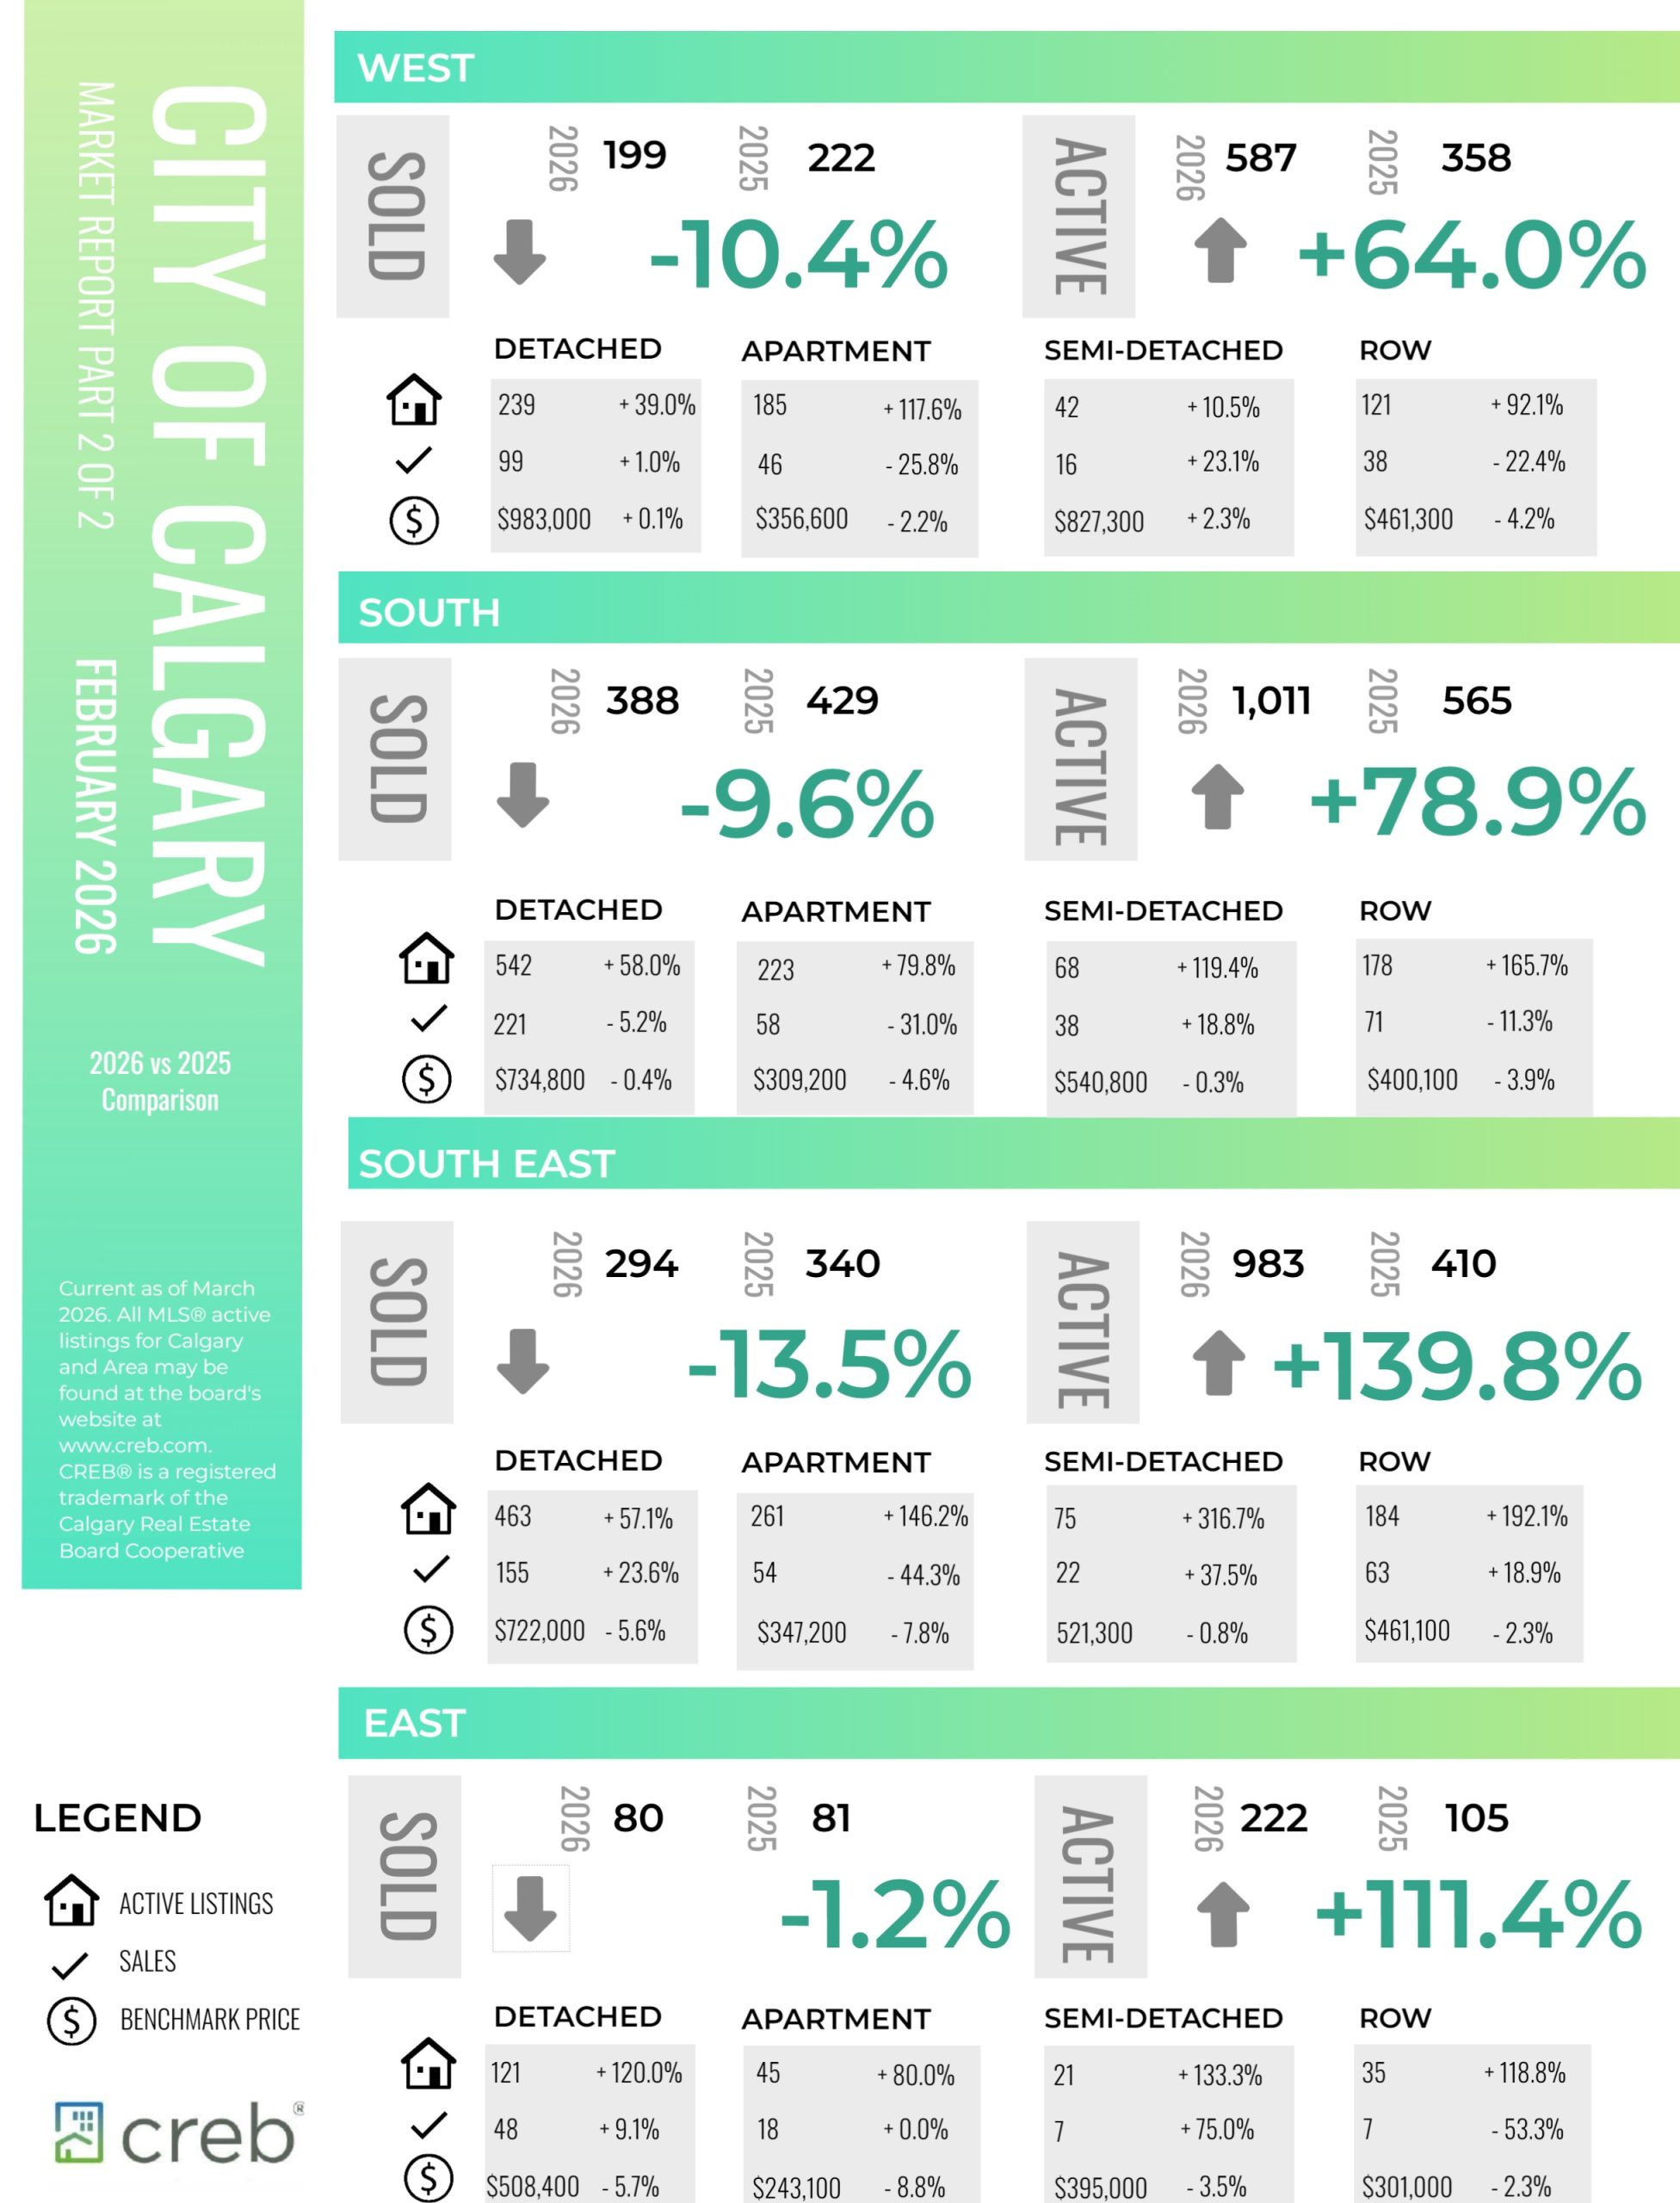
Supply conditions in March varied significantly depending on property type. Inventory levels saw a typical monthly rise, but compared with long-term trends, inventory remained well above the 10-year average for both row and apartment-style units and well below trend for detached homes. This is not a surprise given the pullback in detached housing starts last year despite record-high apartment-style starts.
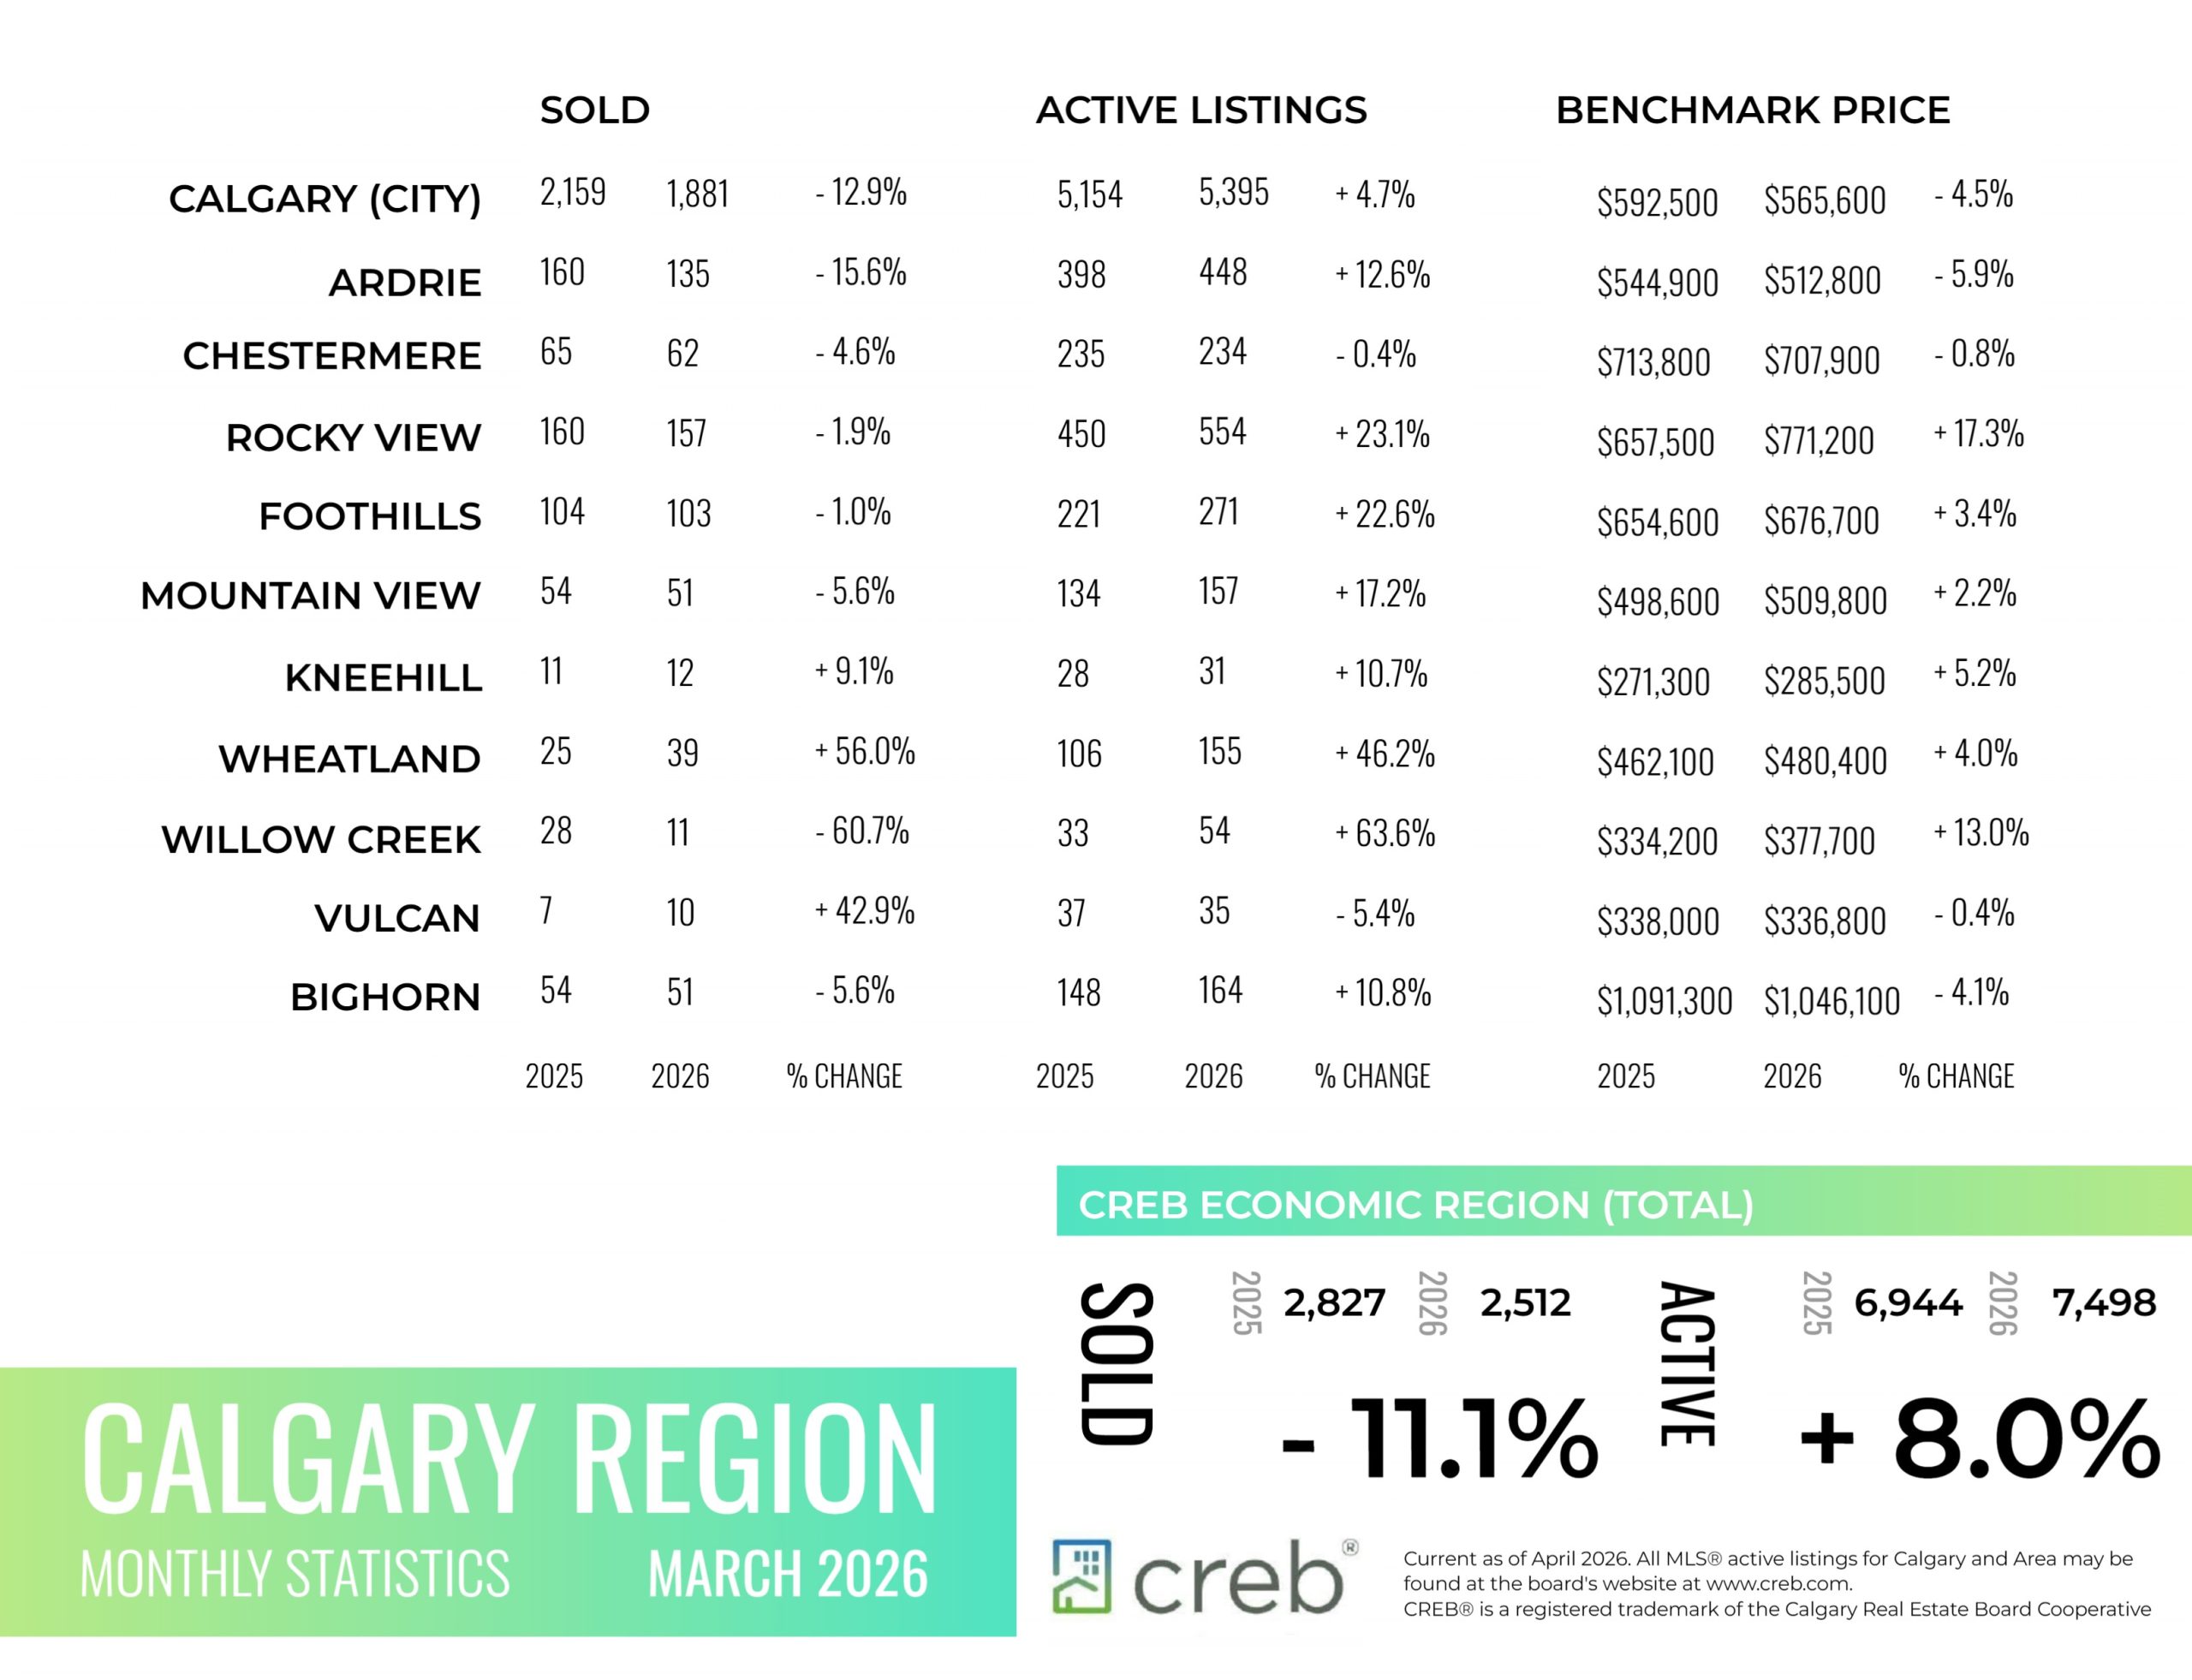
There were 1,881 sales in March, up from the previous month, but still 13 per cent lower than levels reported last year and below long-term trends for March. The decline in sales is mostly due to pullbacks in apartment-style activity, where increased supply choice and slower migration is spreading demand across a wider range of supply. Meanwhile, detached sales have also slowed compared to long-term trends, likely due to limited supply choice in some city districts.
“When considering total residential housing statistics, conditions appear to be relatively balanced as sales, new listings, inventories and prices all trended up over the previous month as we start to move into the spring market,” said Ann-Marie Lurie, CREB®’s Chief Economist. “However, when we look deeper, we are seeing a market that ranges from tighter conditions for detached homes to the apartment sector, where conditions tend to favour the buyer. As expected, this is supporting upward momentum in detached prices and downward pressure in the apartment condominium sector.”
The total unadjusted benchmark price in the city was $565,600, up nearly one per cent compared to February but down by more than four per cent compared to last year. After the first quarter, benchmark prices posted modest to stable conditions for lower density homes. However, apartment condominium prices continued to slide, dropping another three per cent in the first quarter compared to the fourth quarter of last year.
Read the full report on the CREB website!
The following data is a comparison between March 2026 and March 2025 numbers, and is current as of April 0f 2026. For last month’s numbers, check out our previous infographic.
Or follow this link for all our CREB Infographics!
Click on the images for a larger view!
Download Printable Version – March 2026 CREB, City of Calgary Report Pages 1 and 2
Download Printable Version – March 2026 CREB, Calgary Region Report
Last Updated on April 6, 2026 by myRealPage
