INFOGRAPHICS: November 2023 VREB Victoria Market Reports

Slower winter markets can benefit buyers and sellers
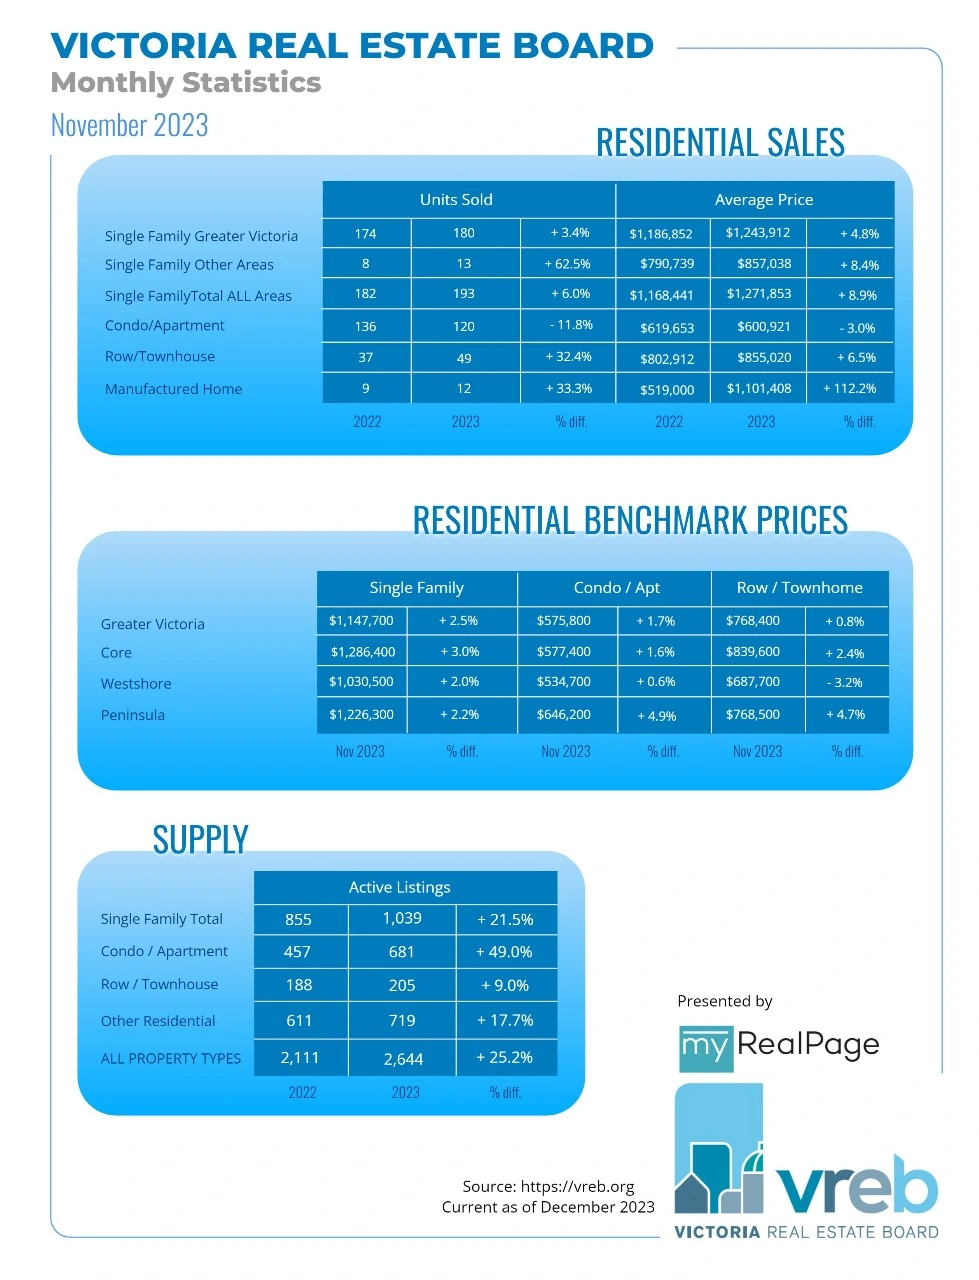
A total of 394 properties sold in the Victoria Real Estate Board region this November, a 2.6 per cent increase from the 384 properties sold in November 2022 and a 3.2 per cent decrease from October 2023. Sales of condominiums were down 11.8 per cent from November 2022 with 120 units sold. Sales of single family homes increased by 6 per cent from November 2022 with 193 sold.
“It’s unsurprising to see this slight relaxation of sales in the market,” said Victoria Real Estate Board Chair Graden Sol. “Given the current interest rate environment, our sales numbers are lower than long term averages, but the pattern of seasonality within those lower numbers is what we would expect for this part of the year. We have seen a healthy twenty-five per cent increase in the number of listings on market compared to last year and this is positive news as we recover from that long-term trend of very low inventory.”
There were 2,644 active listings for sale on the Victoria Real Estate Board Multiple Listing Service® at the end of November 2023, a decrease of 4.1 per cent compared to the previous month of October and a 25.2 per cent increase from the 2,111 active listings for sale at the end of November 2022.
Read the full report on VREB website!
The following data is a comparison between November 2023 and November 2022 numbers, and is current as of December 2023. Click here to check out last month’s figures!
You can also follow this link for all our Victoria Board monthly infographics!
Click on the images for a larger view!
Download Printable Version – November 2023 VREB, Victoria Market Report
Last Updated on December 5, 2023 by myRealPage
