INFOGRAPHICS: November 2025 TRREB Toronto Market Reports

GTA REALTORS Release November Stats
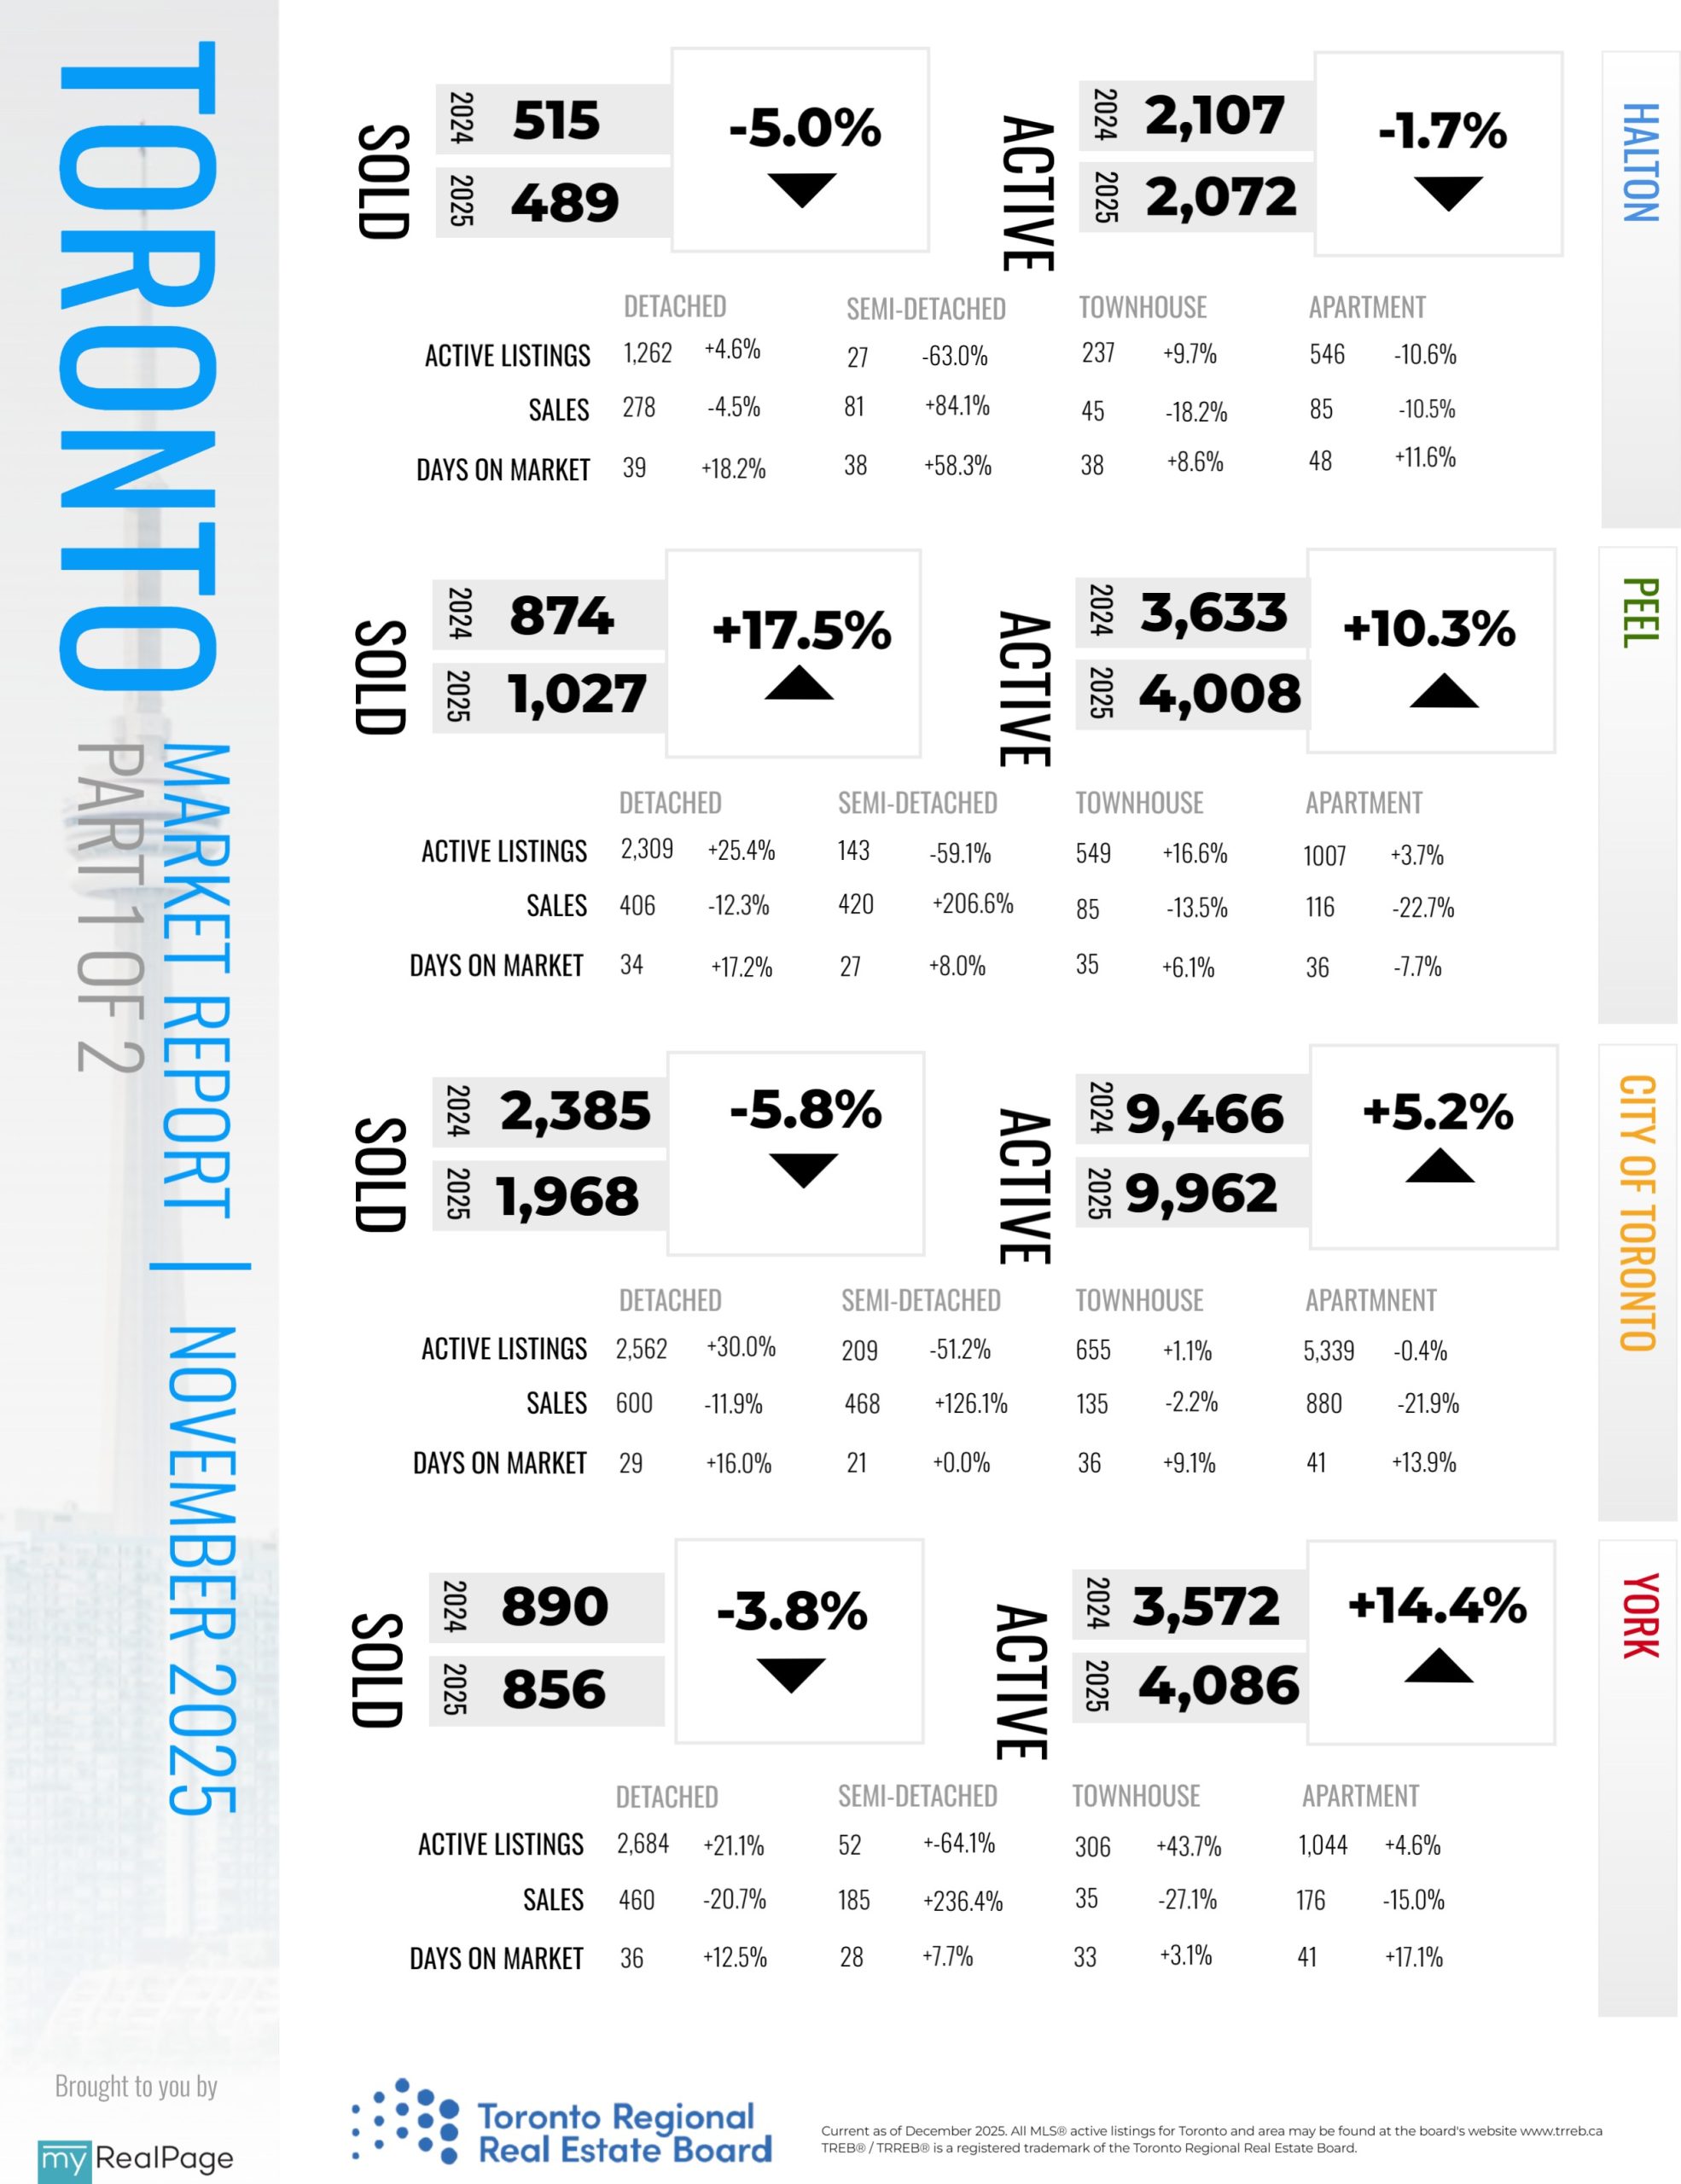
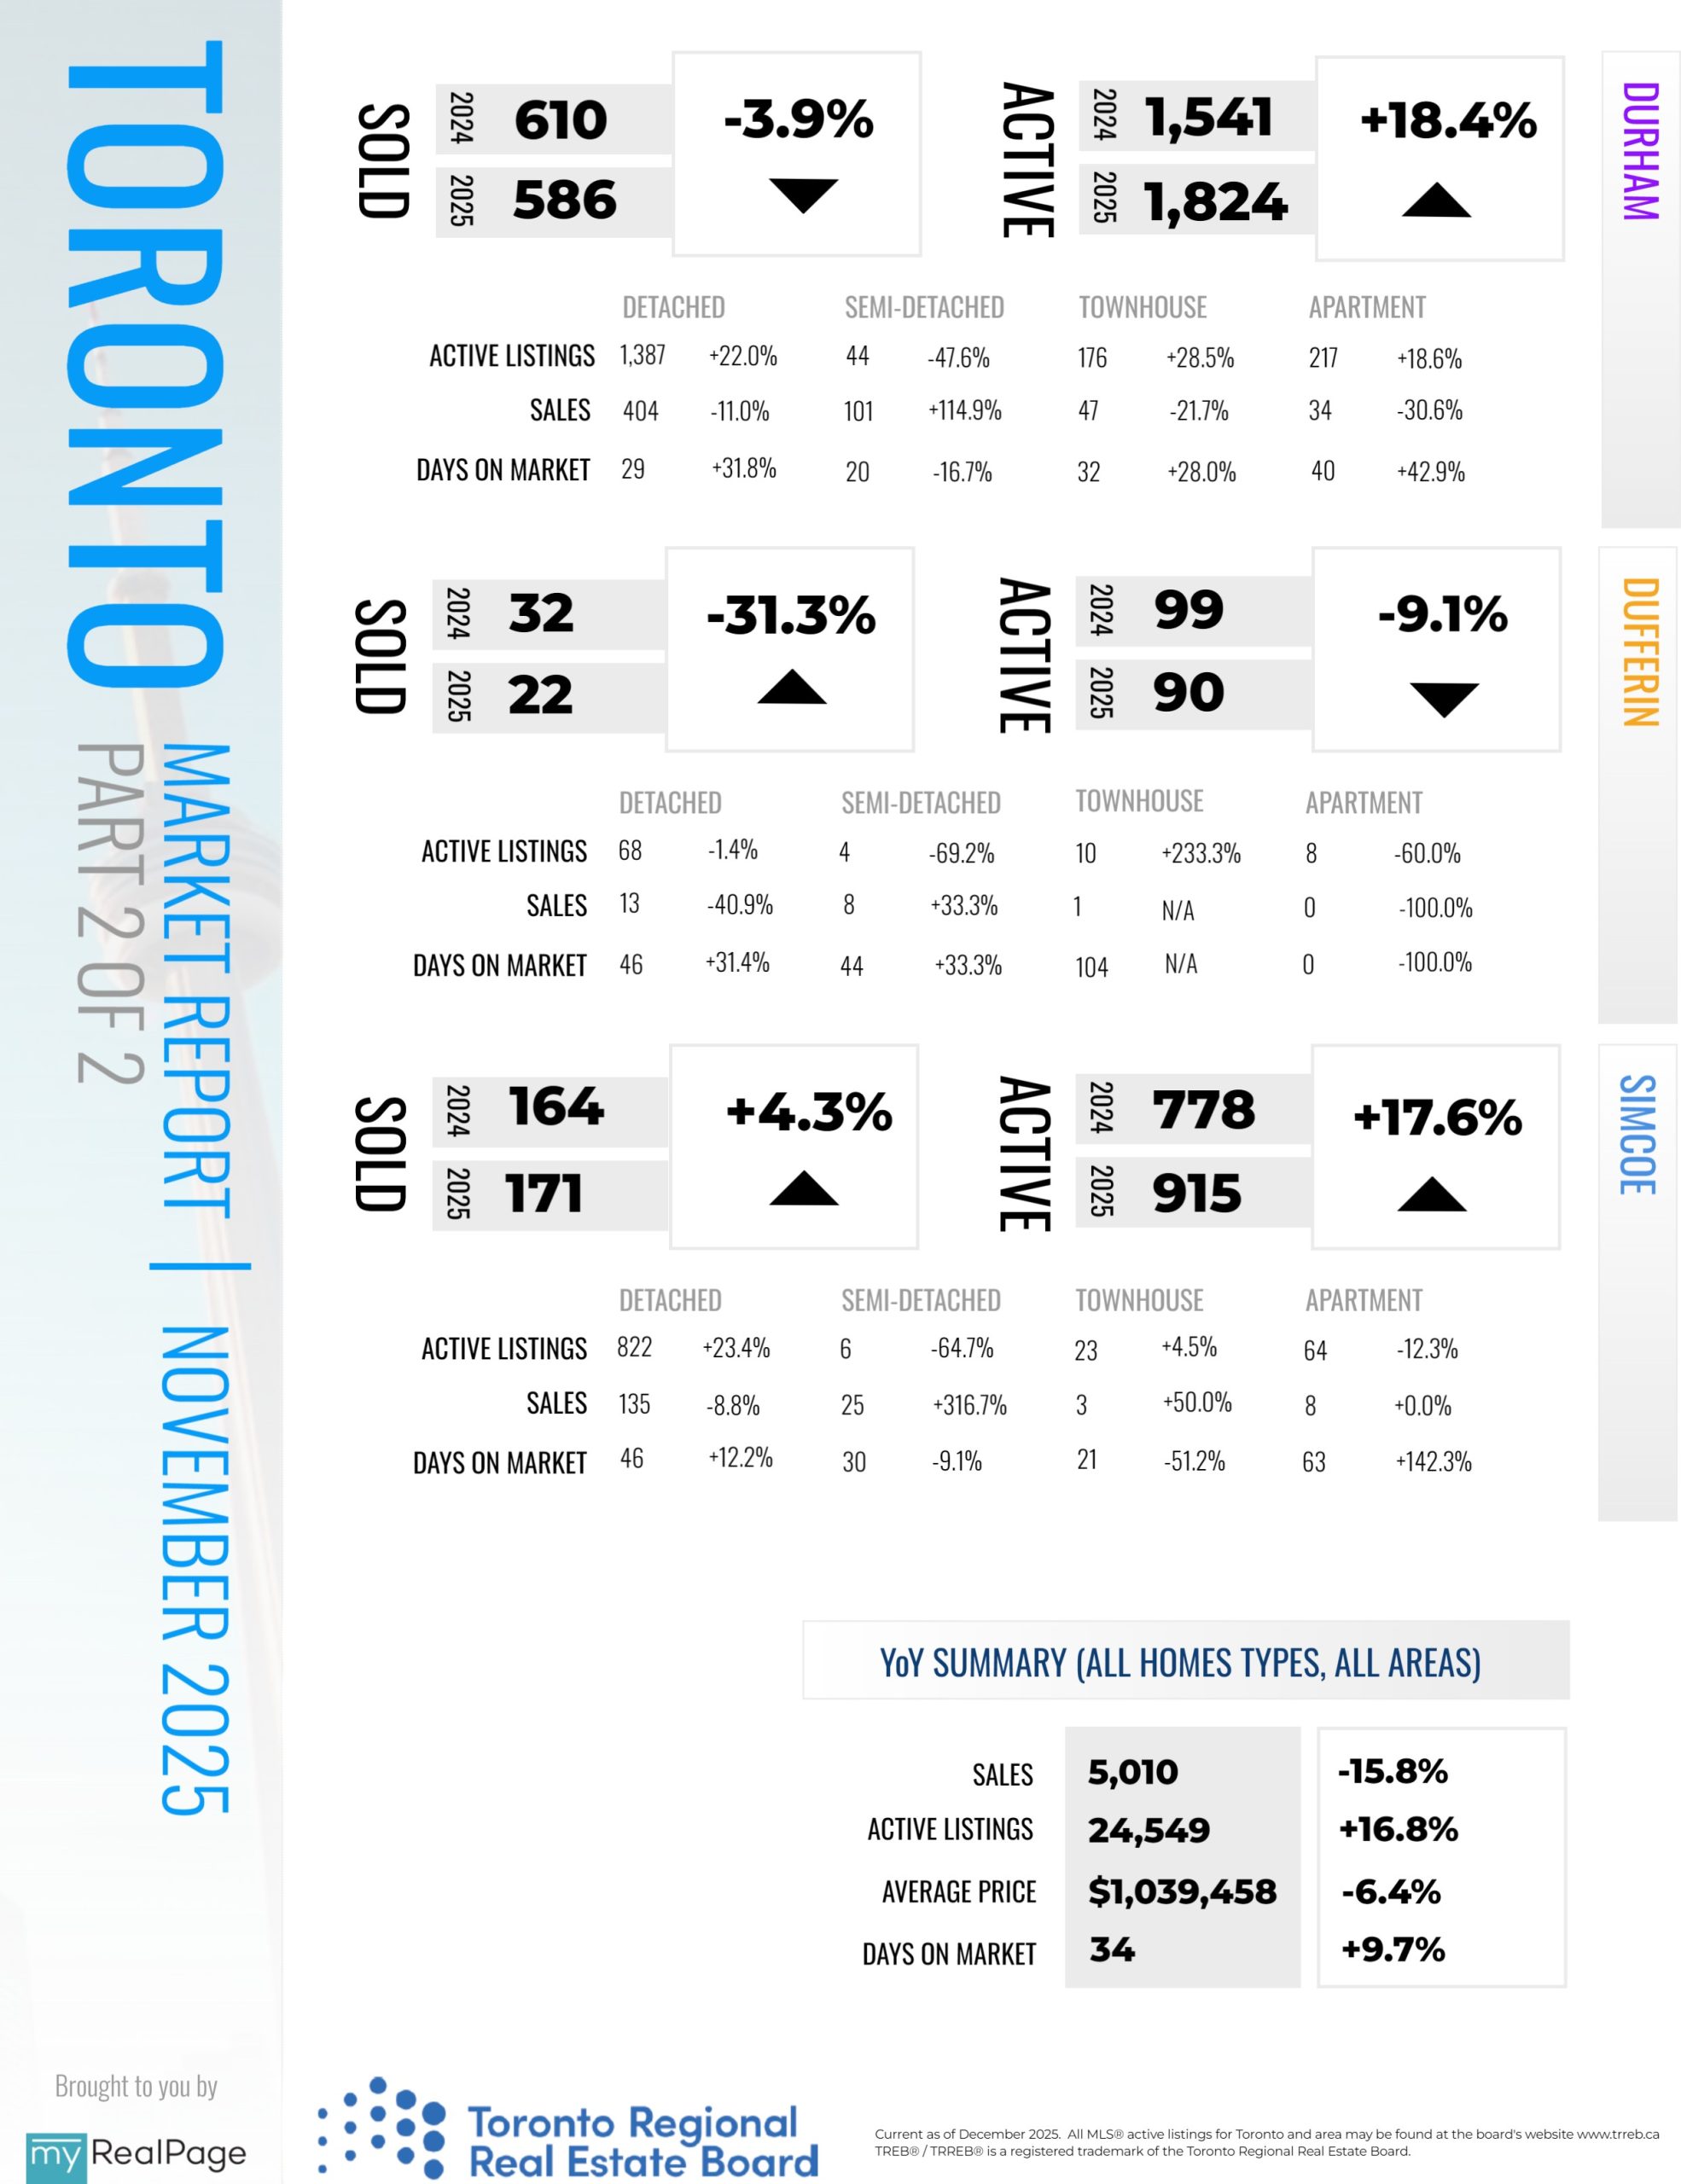
Greater Toronto Area (GTA) home sales, new listings, and average selling price were down compared to a year earlier in November 2024. Intending homebuyers remained on the sidelines awaiting more positive economic news.
“There are many GTA households who want to take advantage of lower borrowing costs and more favourable selling prices. What they need most is confidence in their long-term employment outlook. Fortunately, we saw encouraging news on jobs and the broader economy in November. If this positive momentum continues, consumer confidence will strengthen, and more people will be in a position to consider purchasing a home in 2026,” said TRREB President Elechia Barry-Sproule.
GTA REALTORS® reported 5,010 home sales through TRREB’s MLS® System in November 2025 – down by 15.8 per cent compared to November 2024. New listings entered into the MLS® System amounted to 11,134 – down by four per cent year-over-year.
Read the full report on TRREB website!
The following data is a comparison between November 2025 and November 2024 numbers, and is current as of December of 2025. For last month’s numbers, check out our previous infographic!
Or follow this link for all our TREB / TRREB Infographics!
Download Printable Version – November 2025 TRREB, Toronto Market Report
Last Updated on December 10, 2025 by myRealPage
